Liverpool
—
|
0 – 1
|
Arsenal
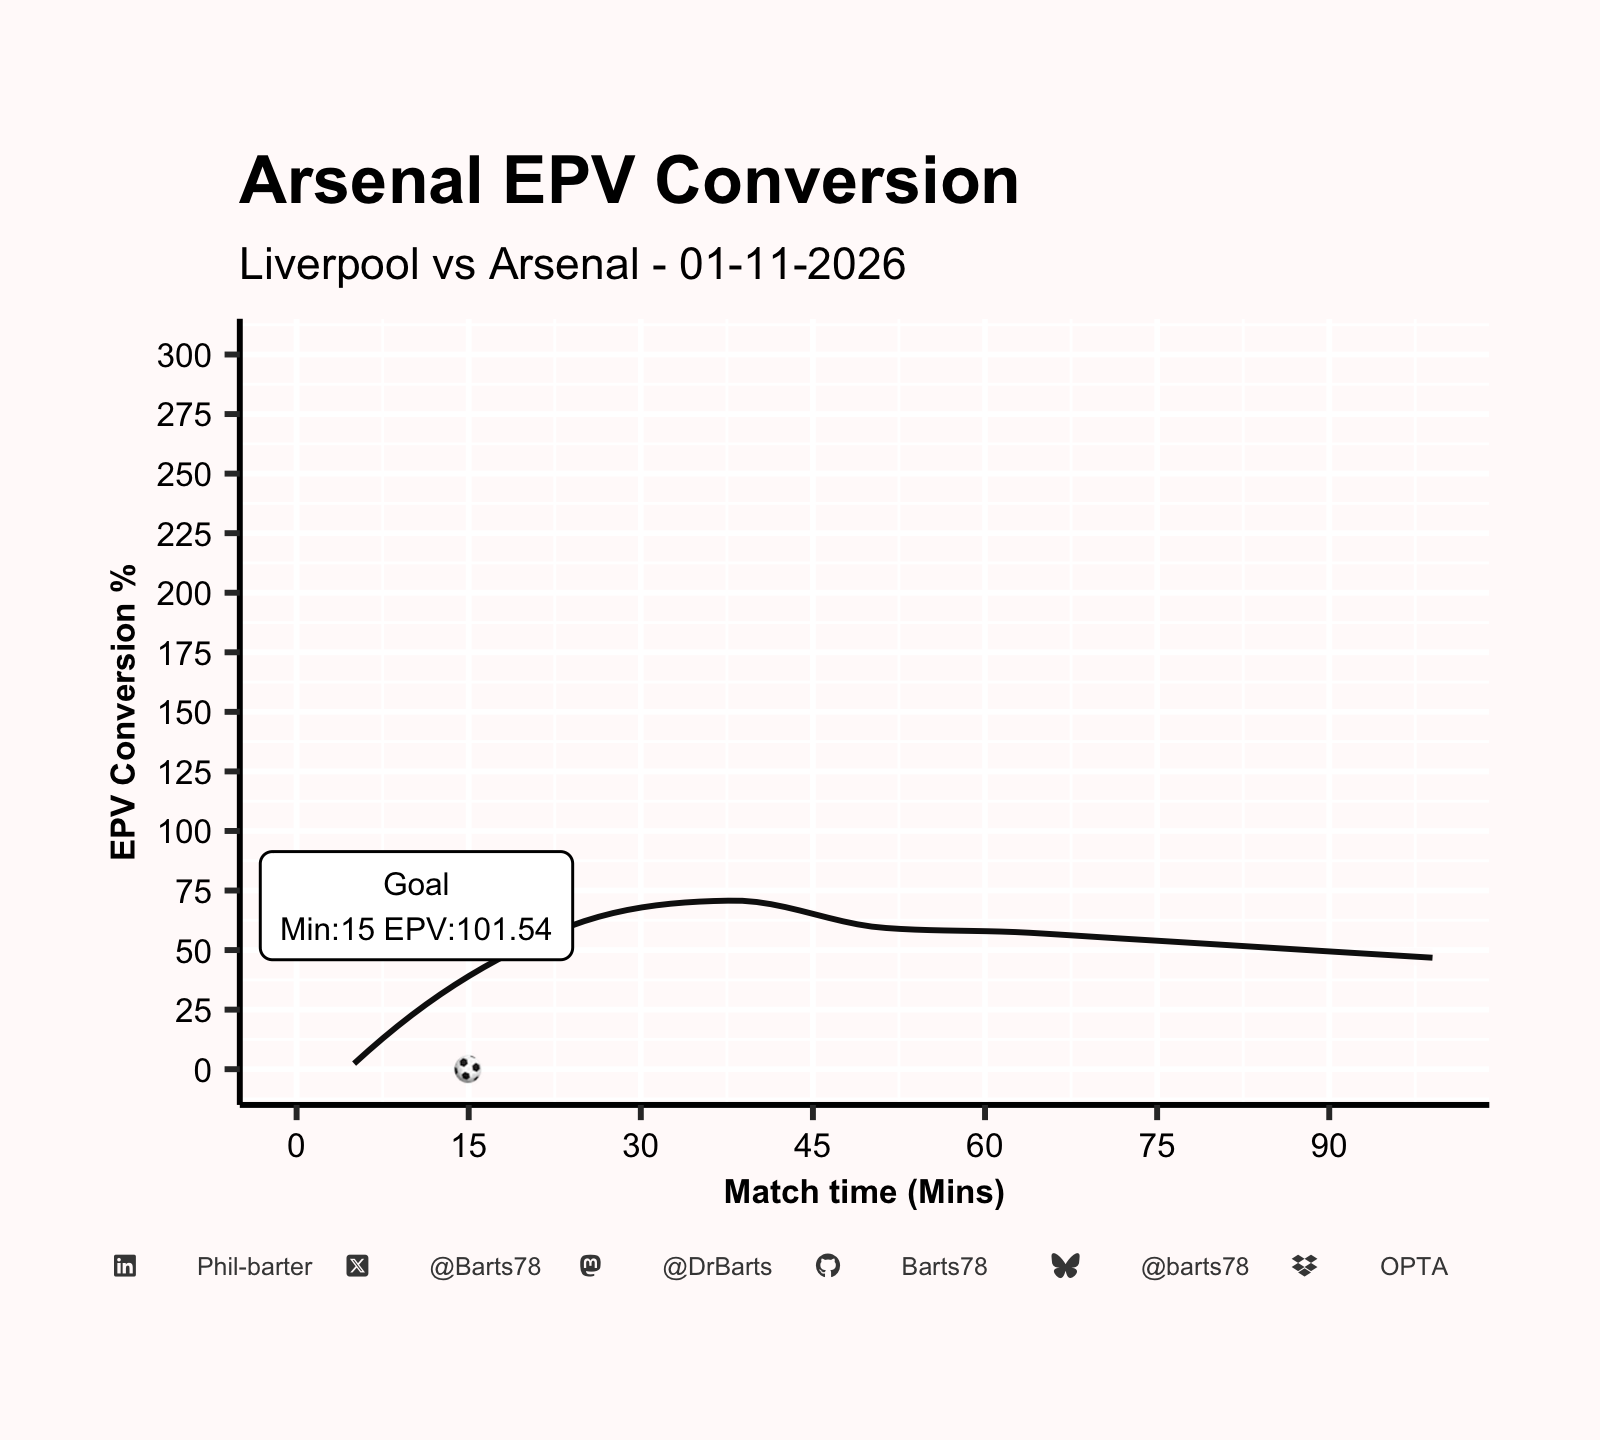
Havertz 16'
|
xG
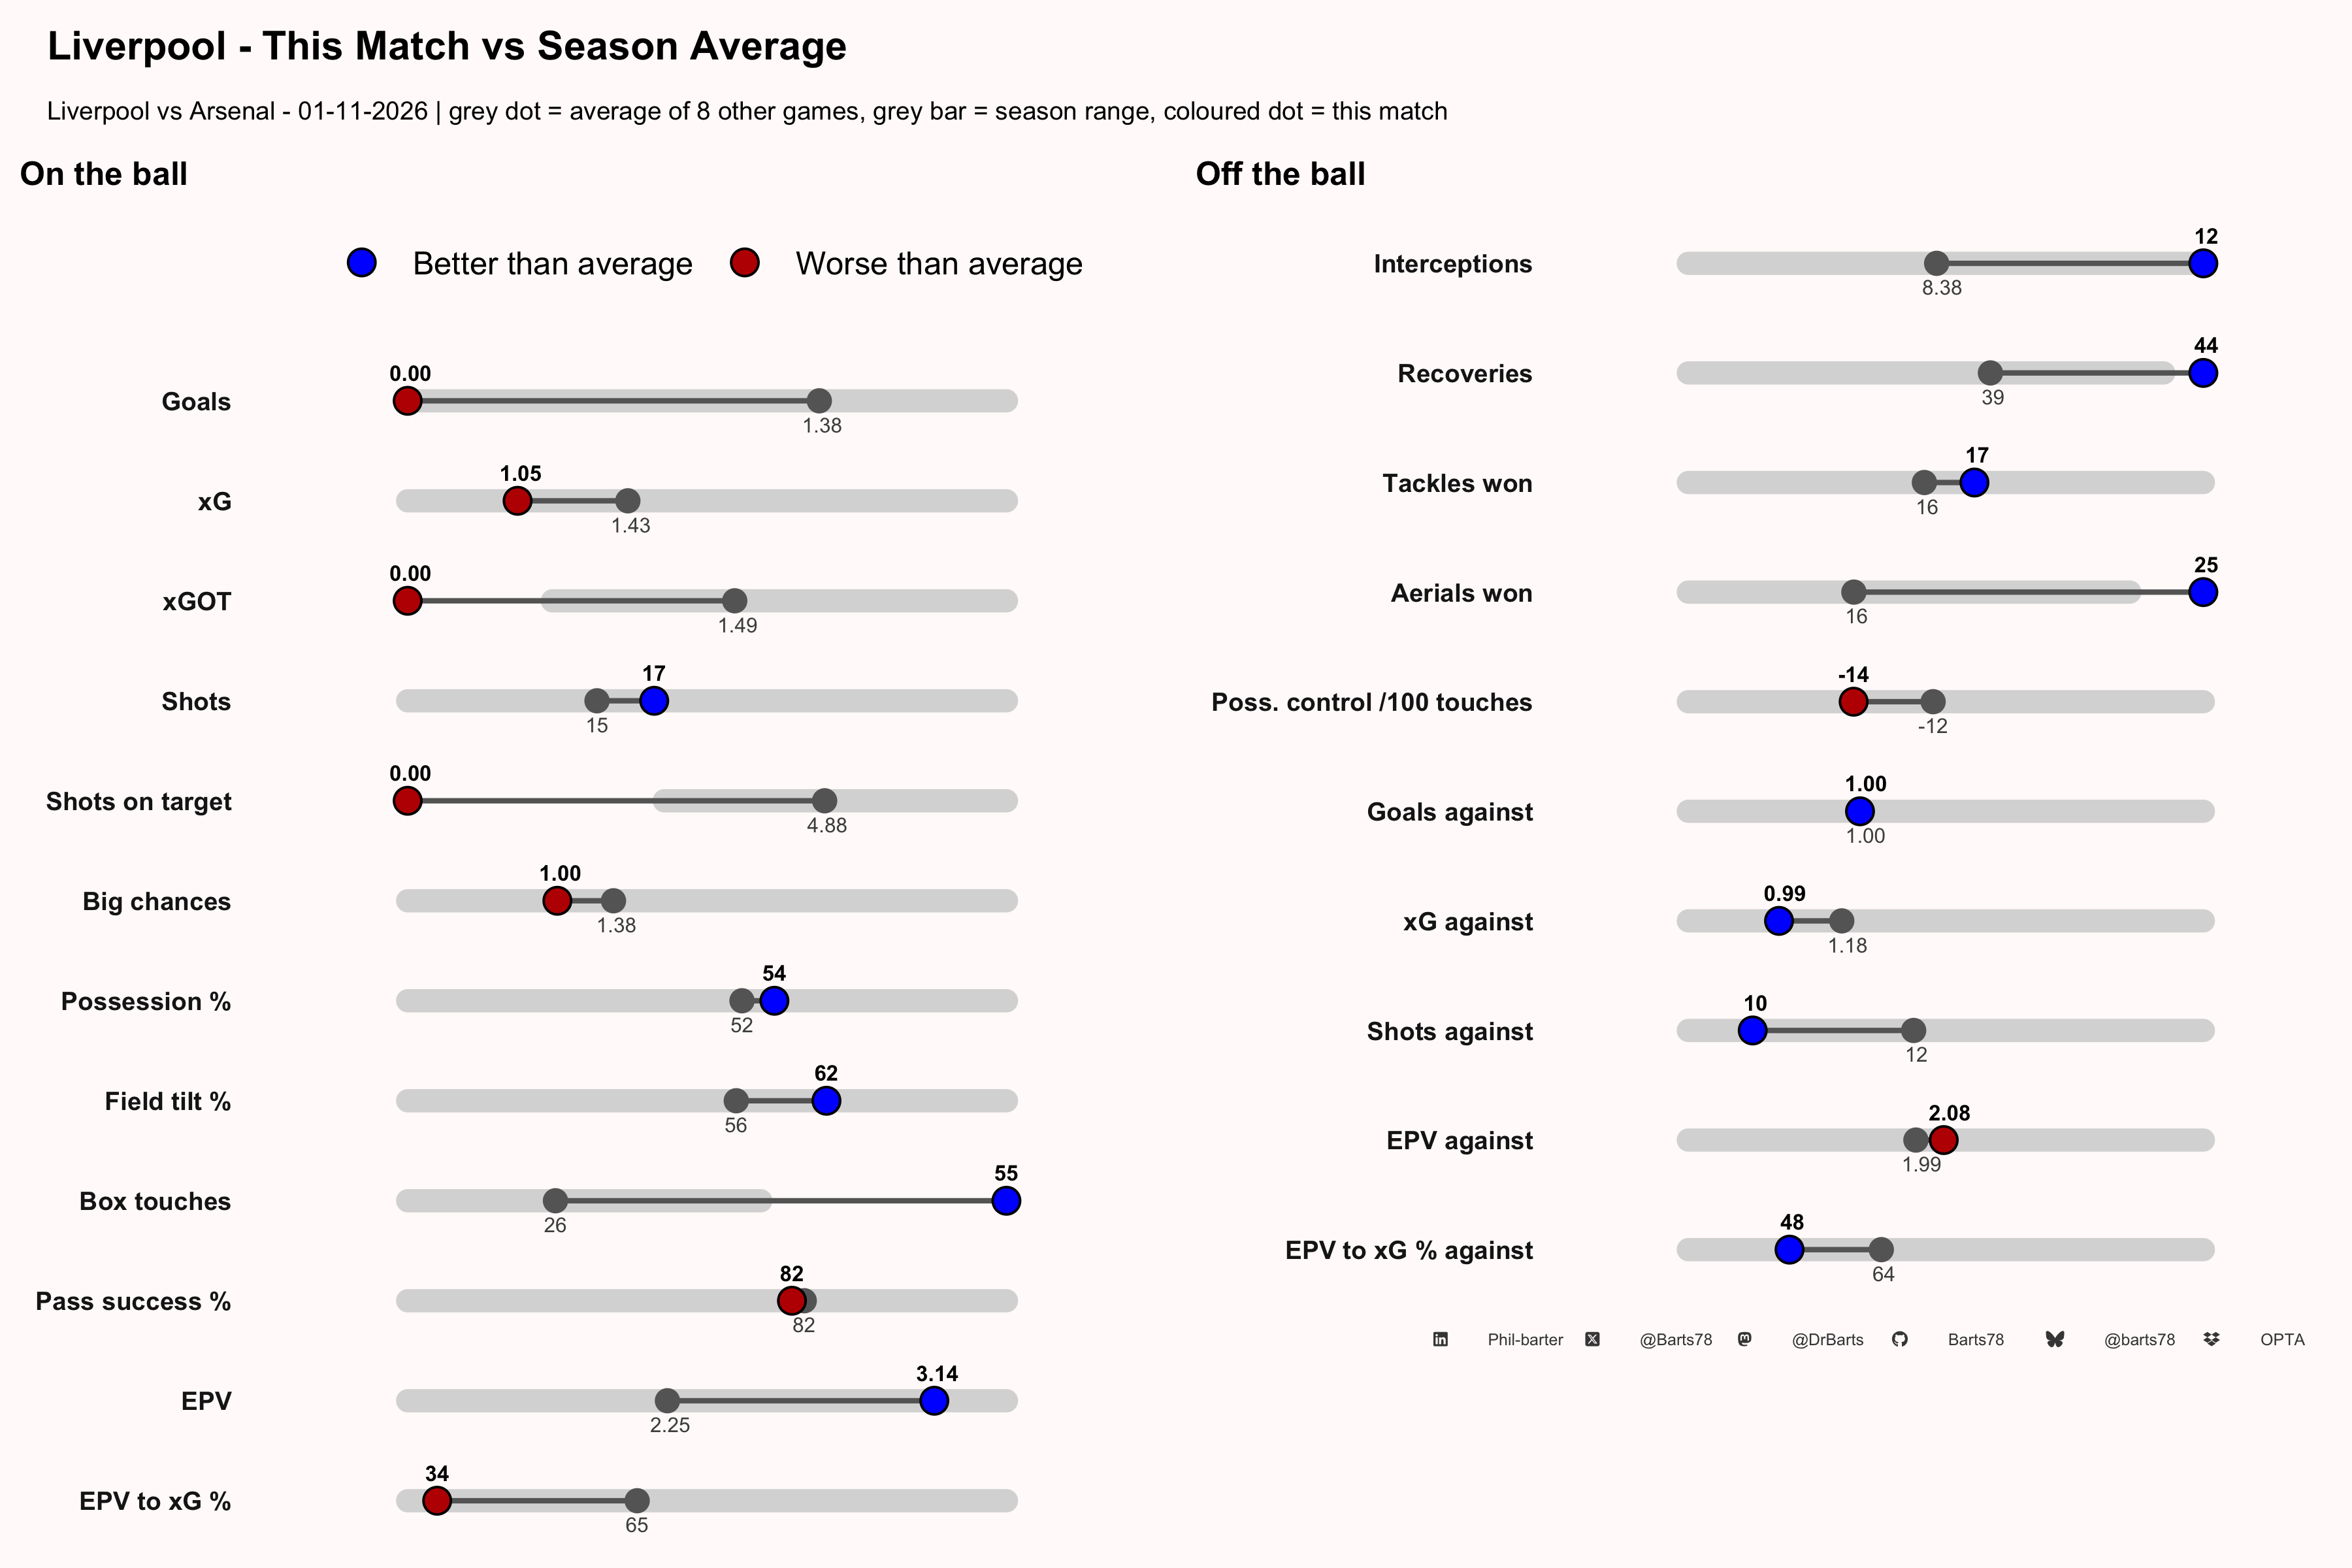
LIV 1.05 – 0.99 ARS
xGOT
LIV 0.00 – 1.45 ARS
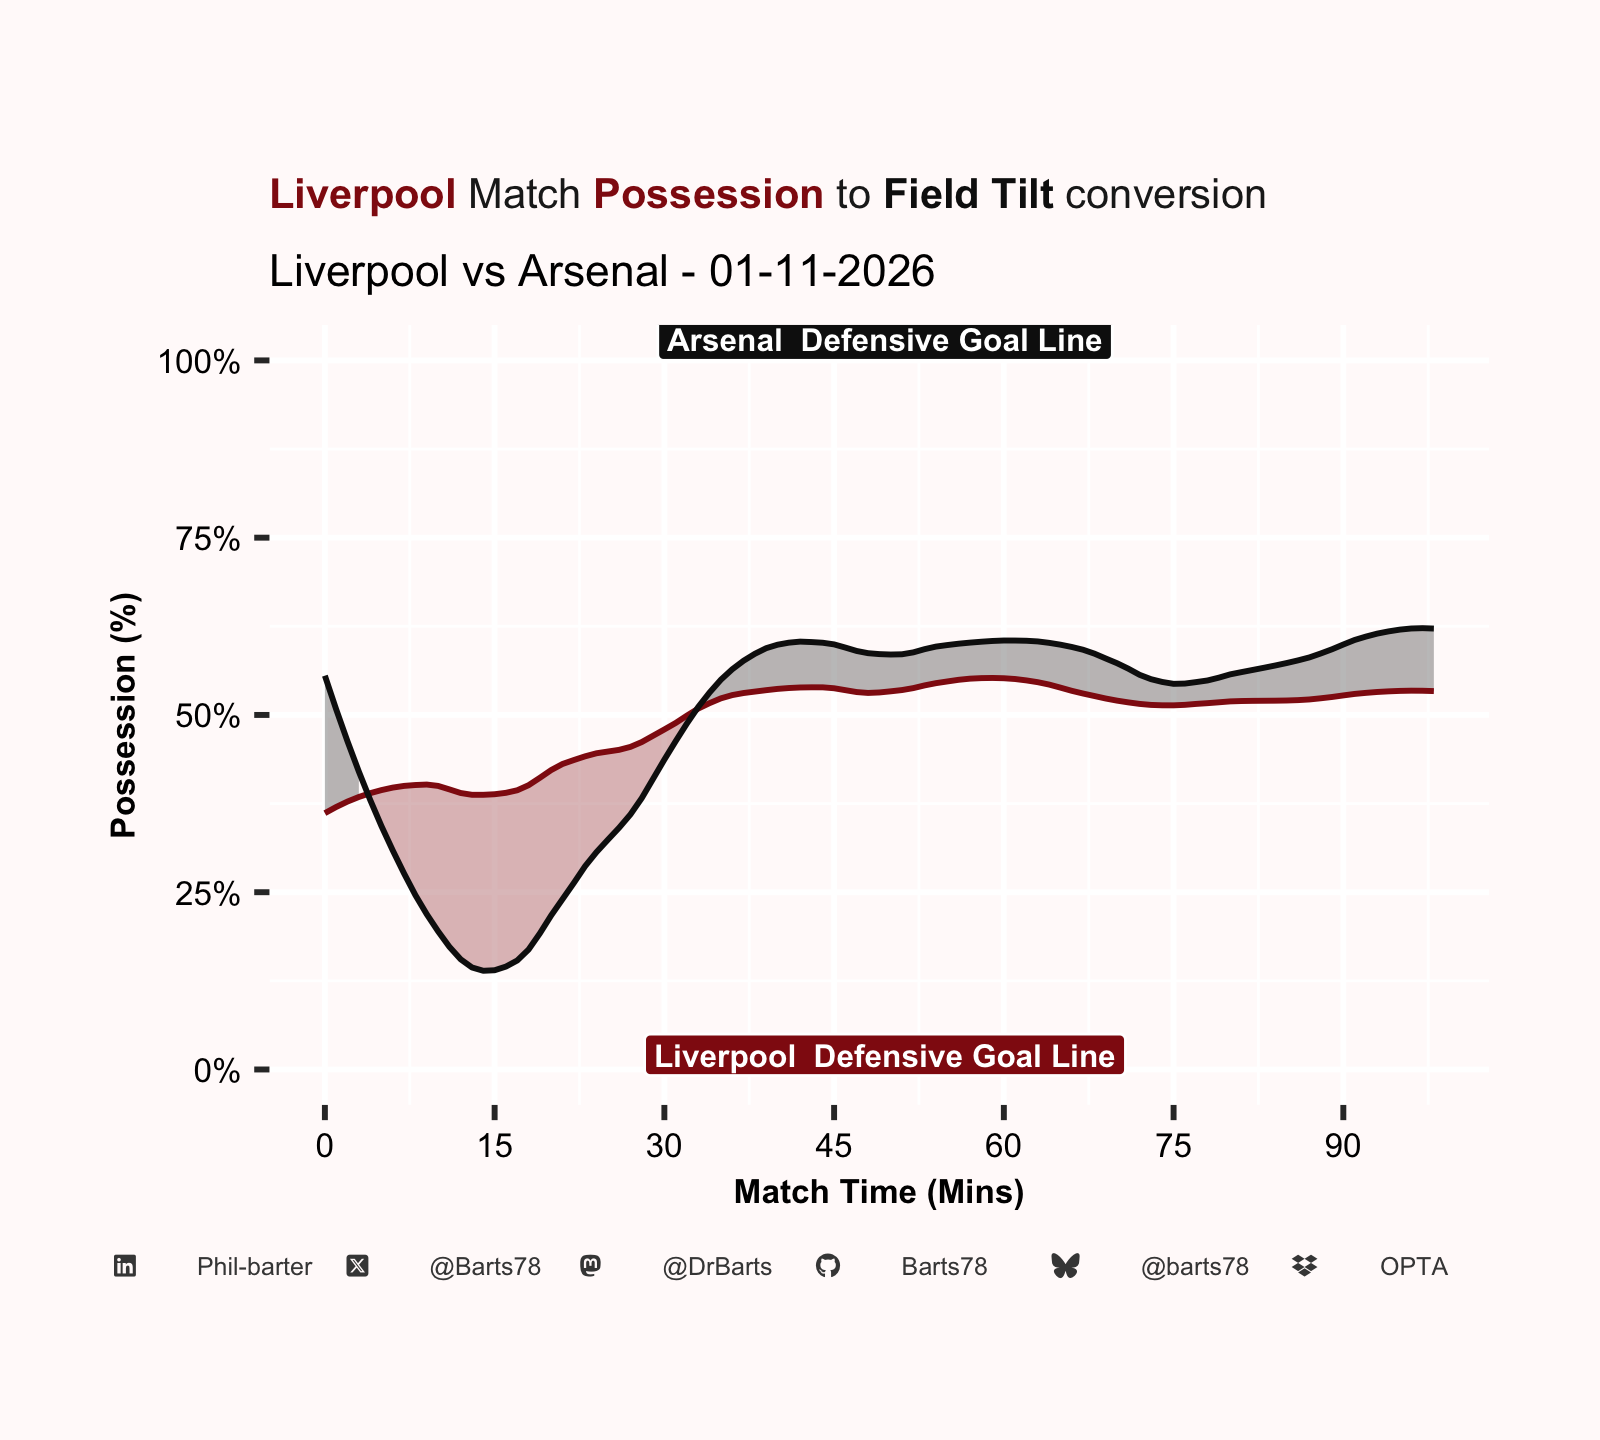
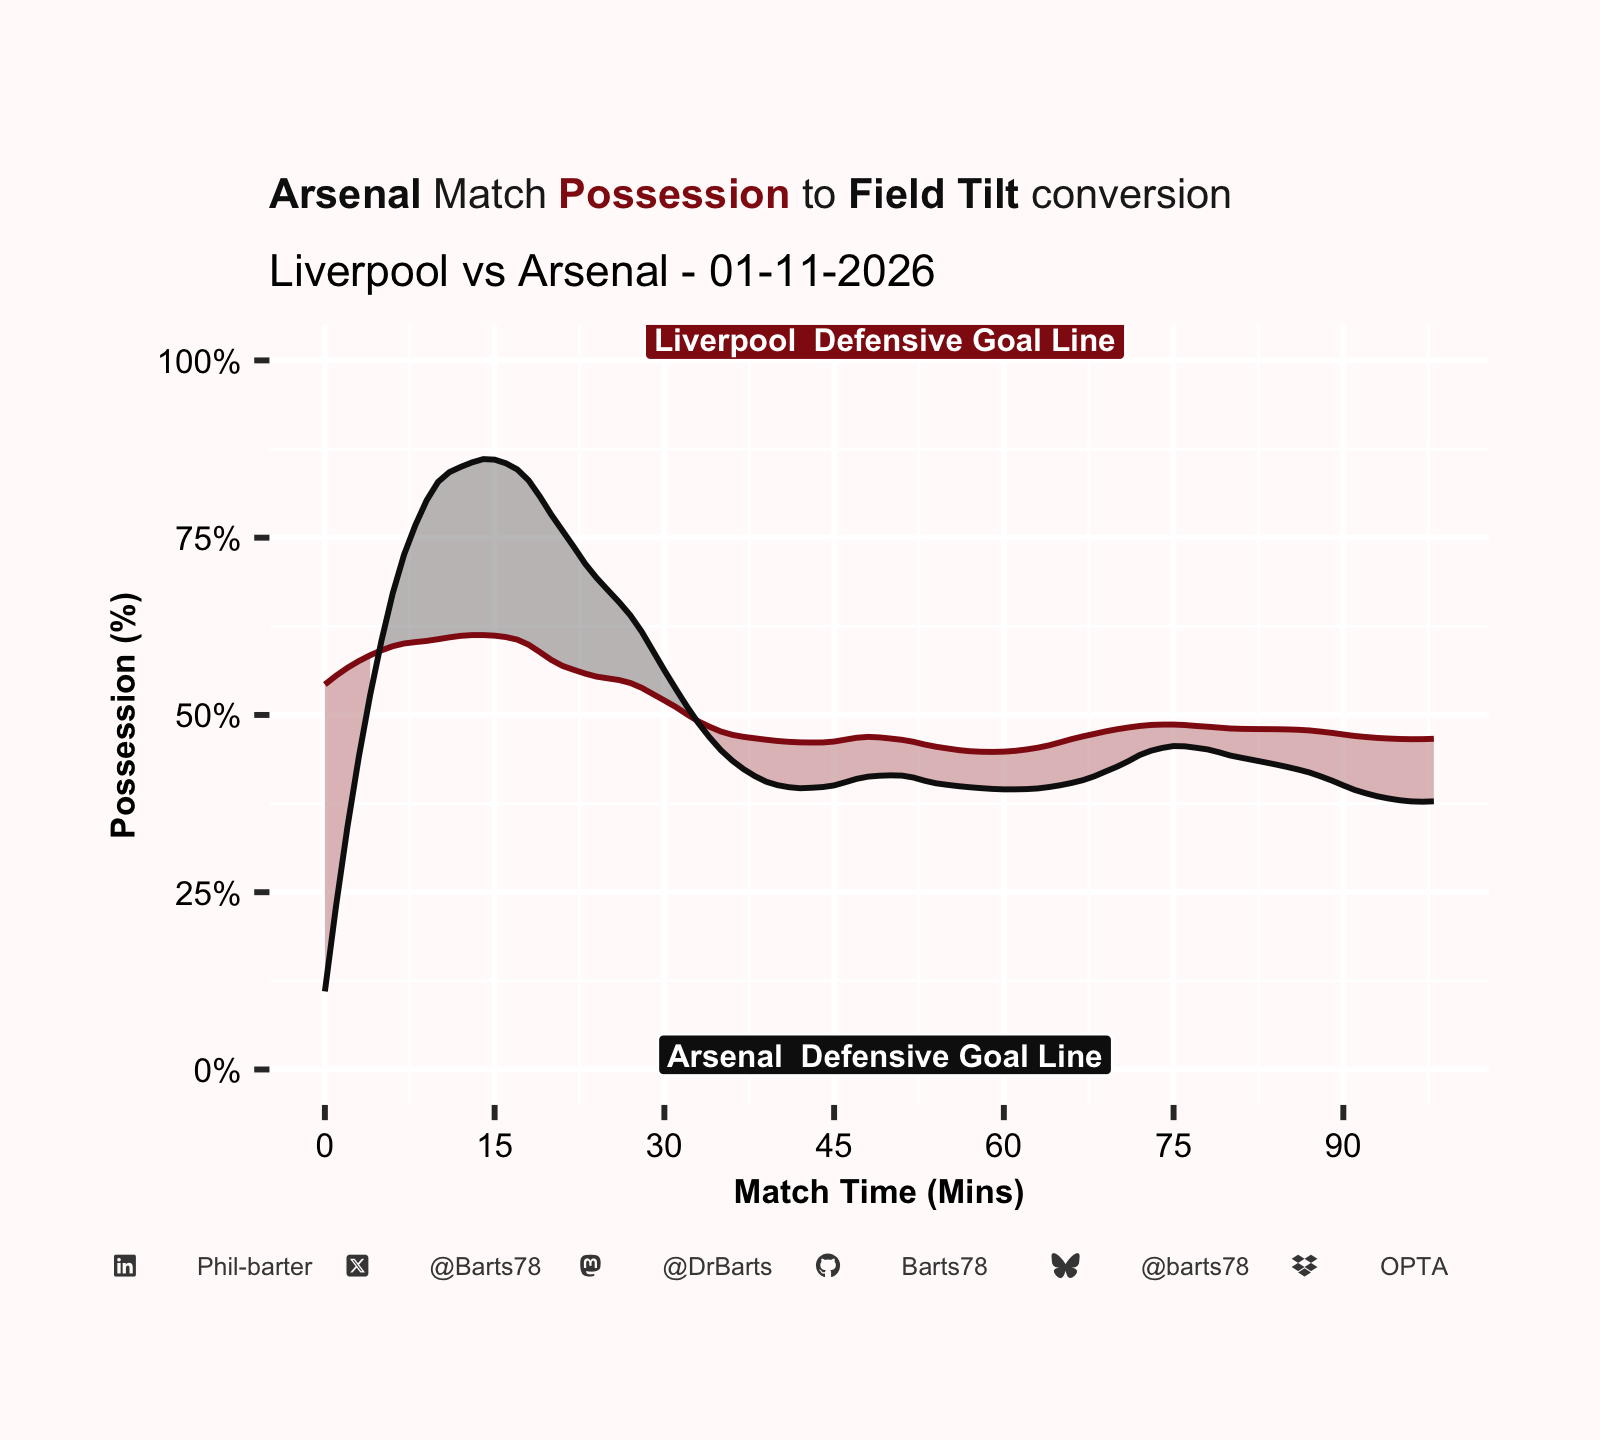
Field Tilt %
LIV 61% – 39% ARS
PPDA (lower = more intense press)
LIV 8.38 – 12.24 ARS
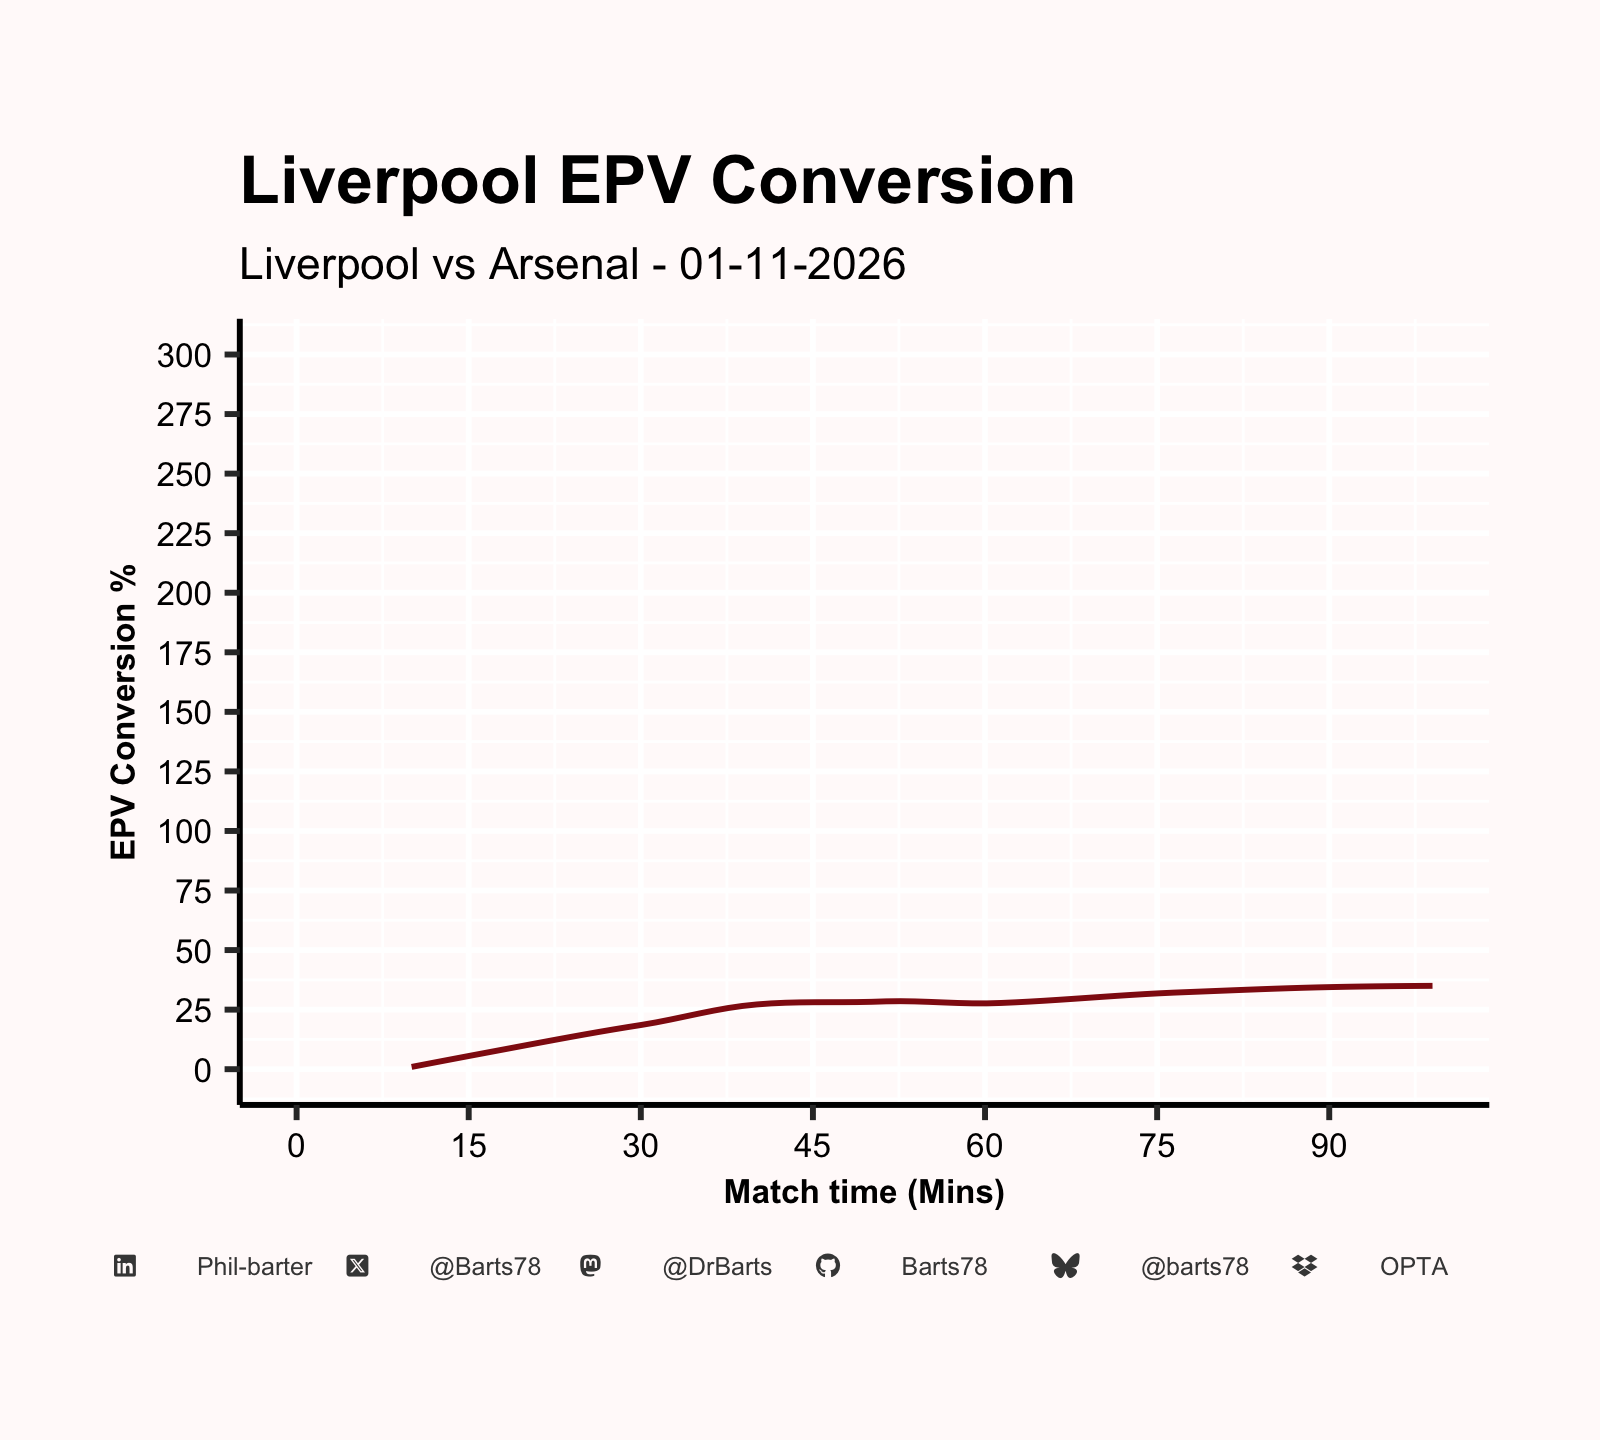
EPV
LIV 3.14 – 2.08 ARS
EPV to xG Conversion %
LIV 33% – 48% ARS
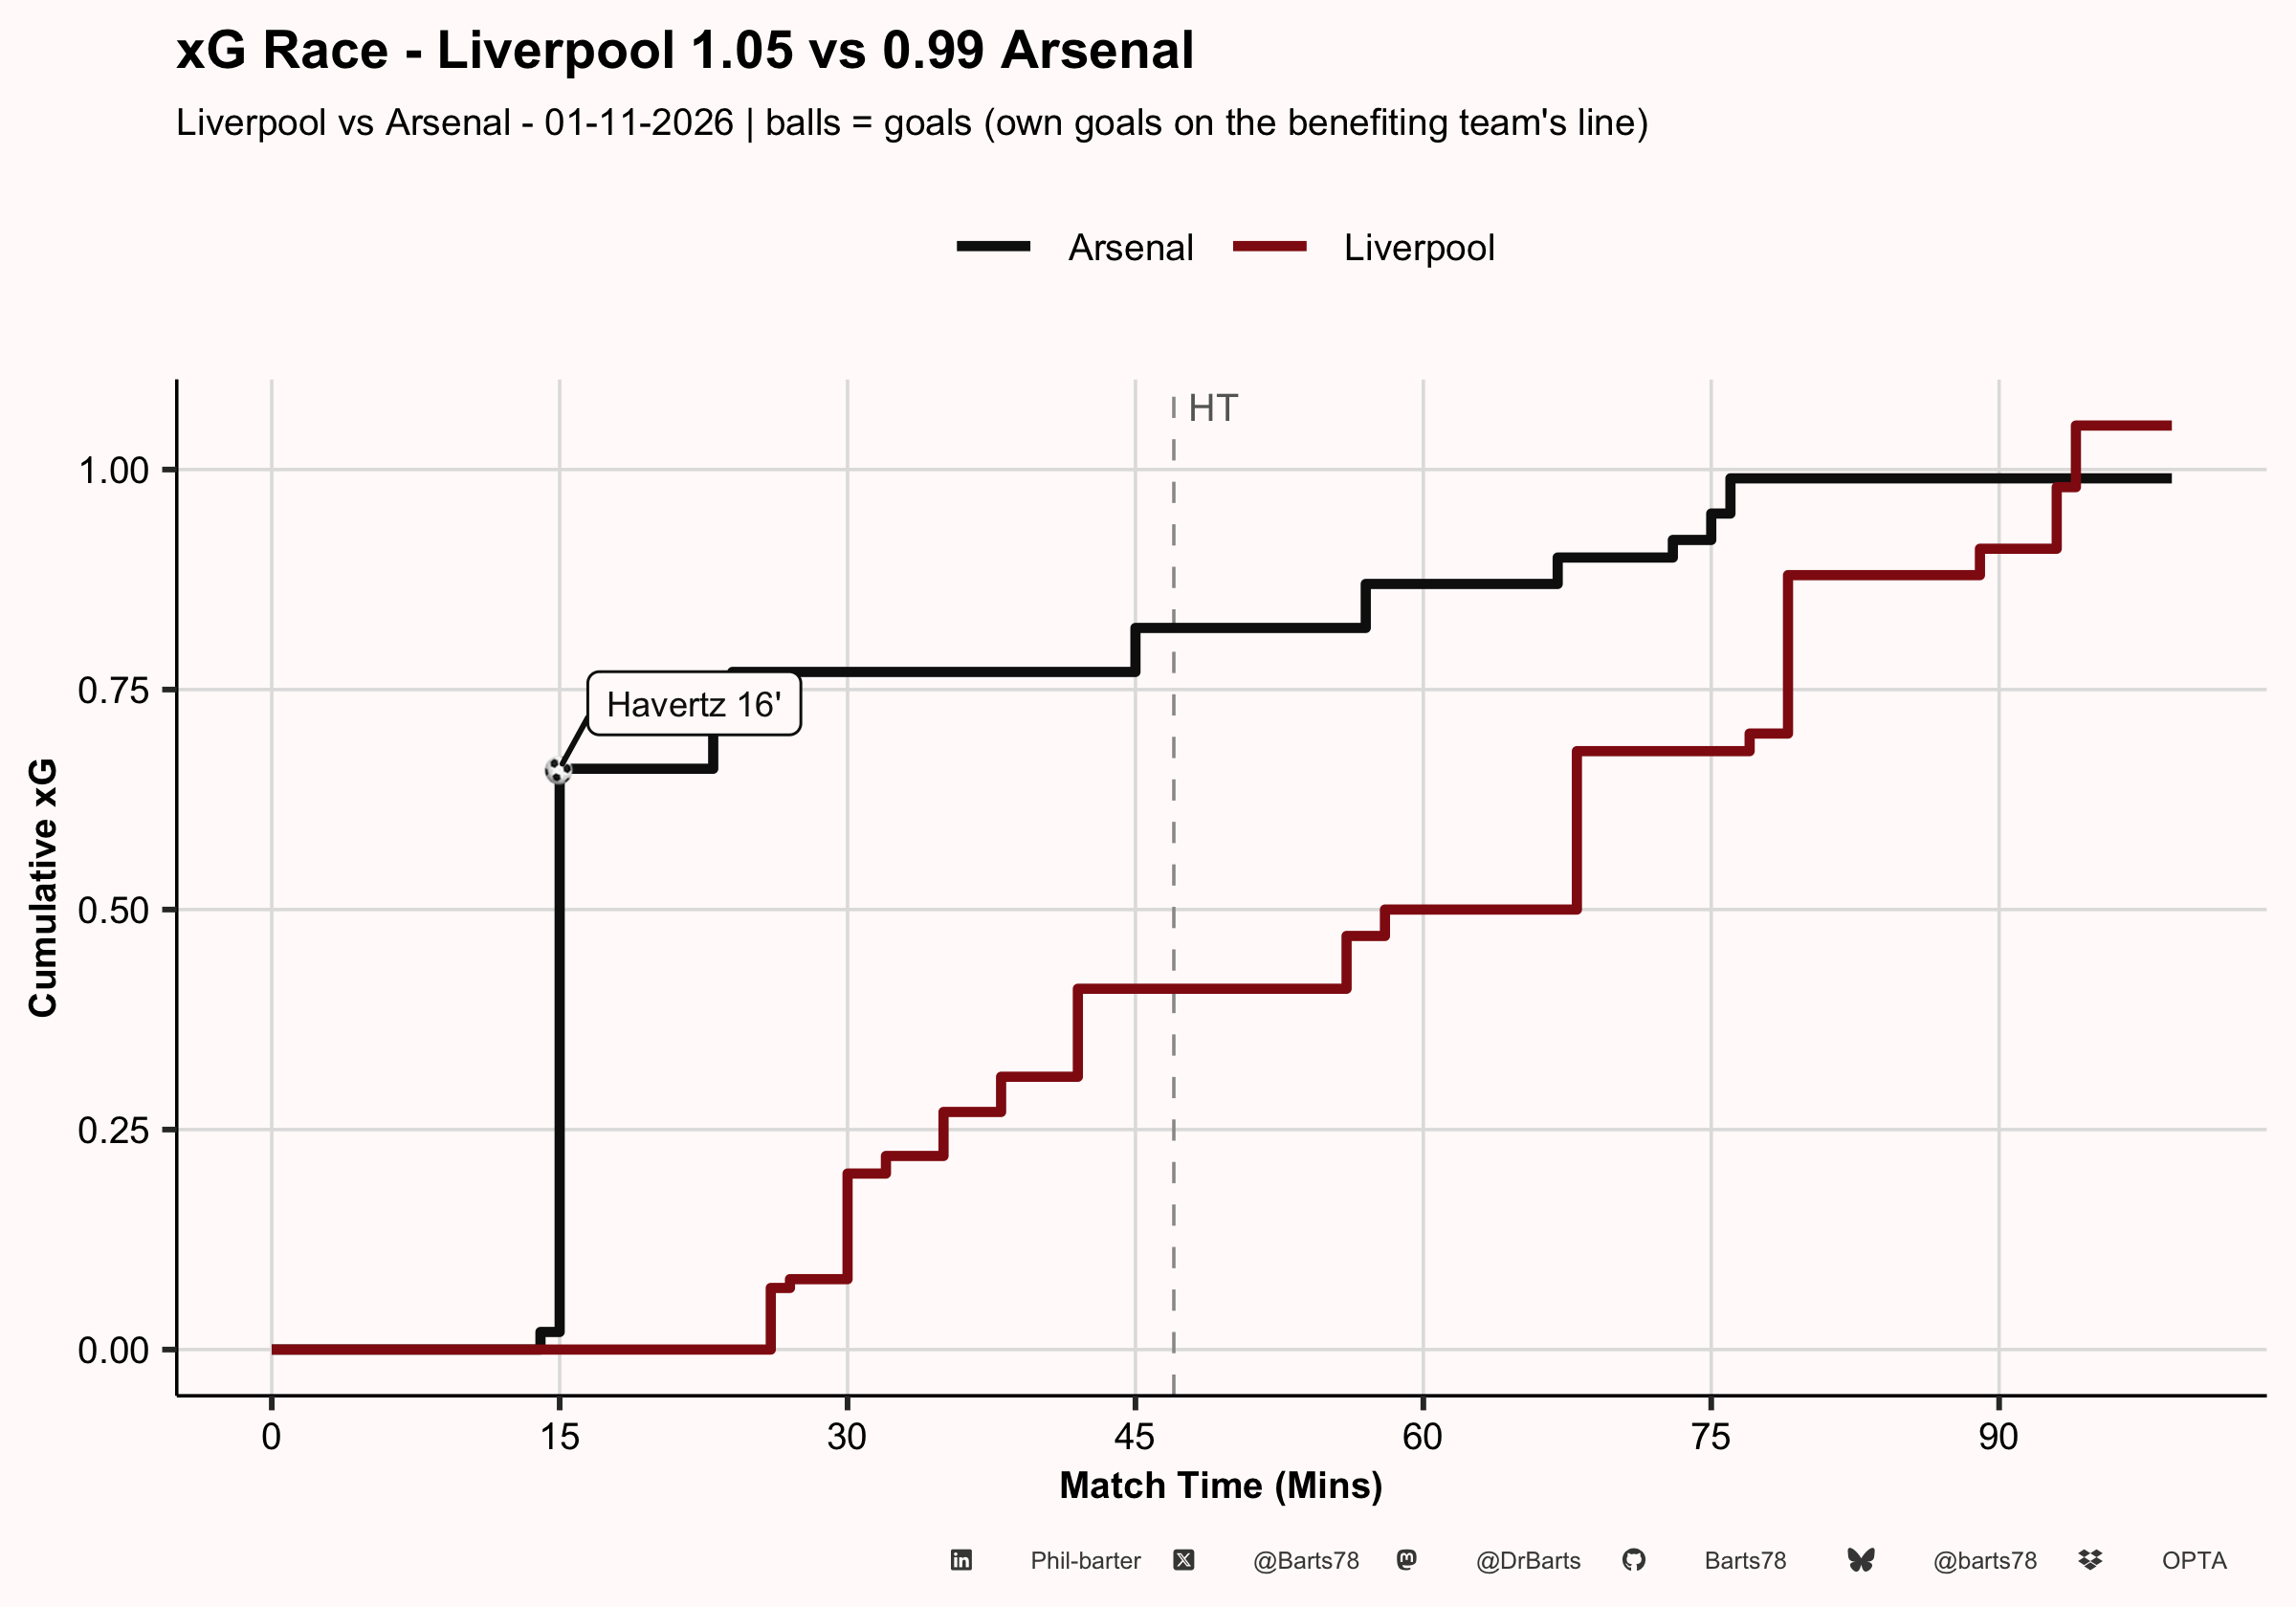
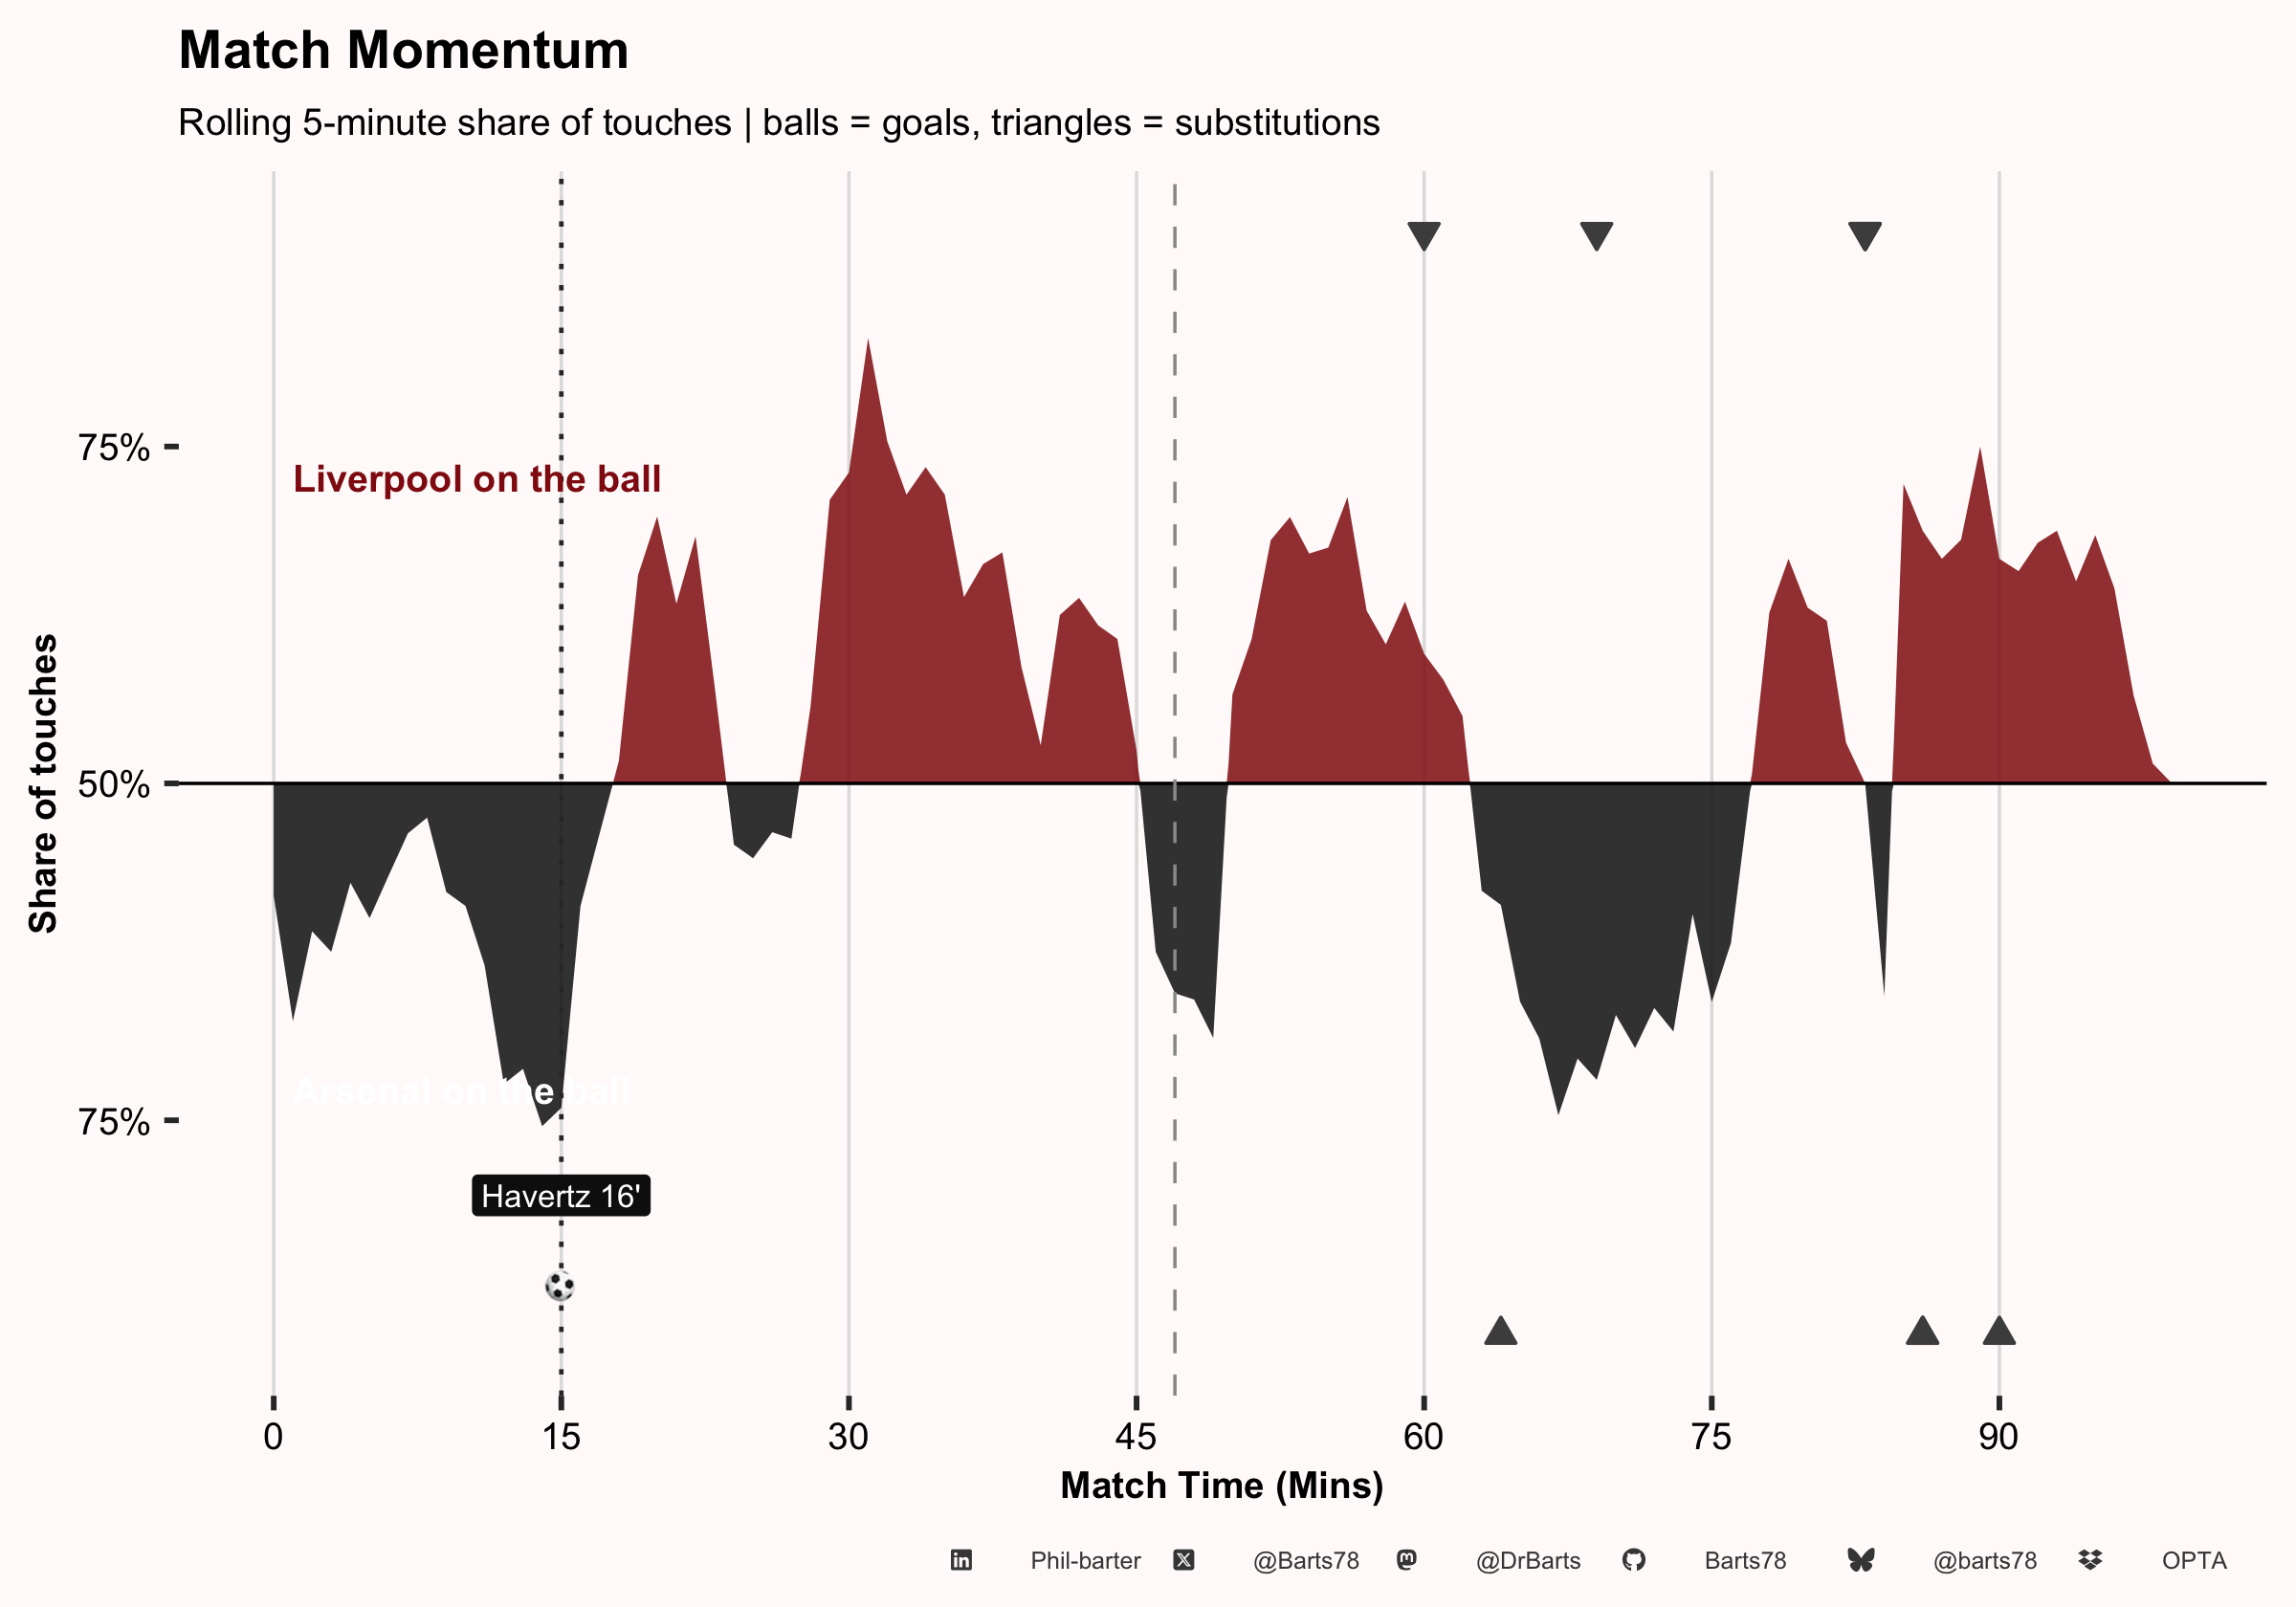
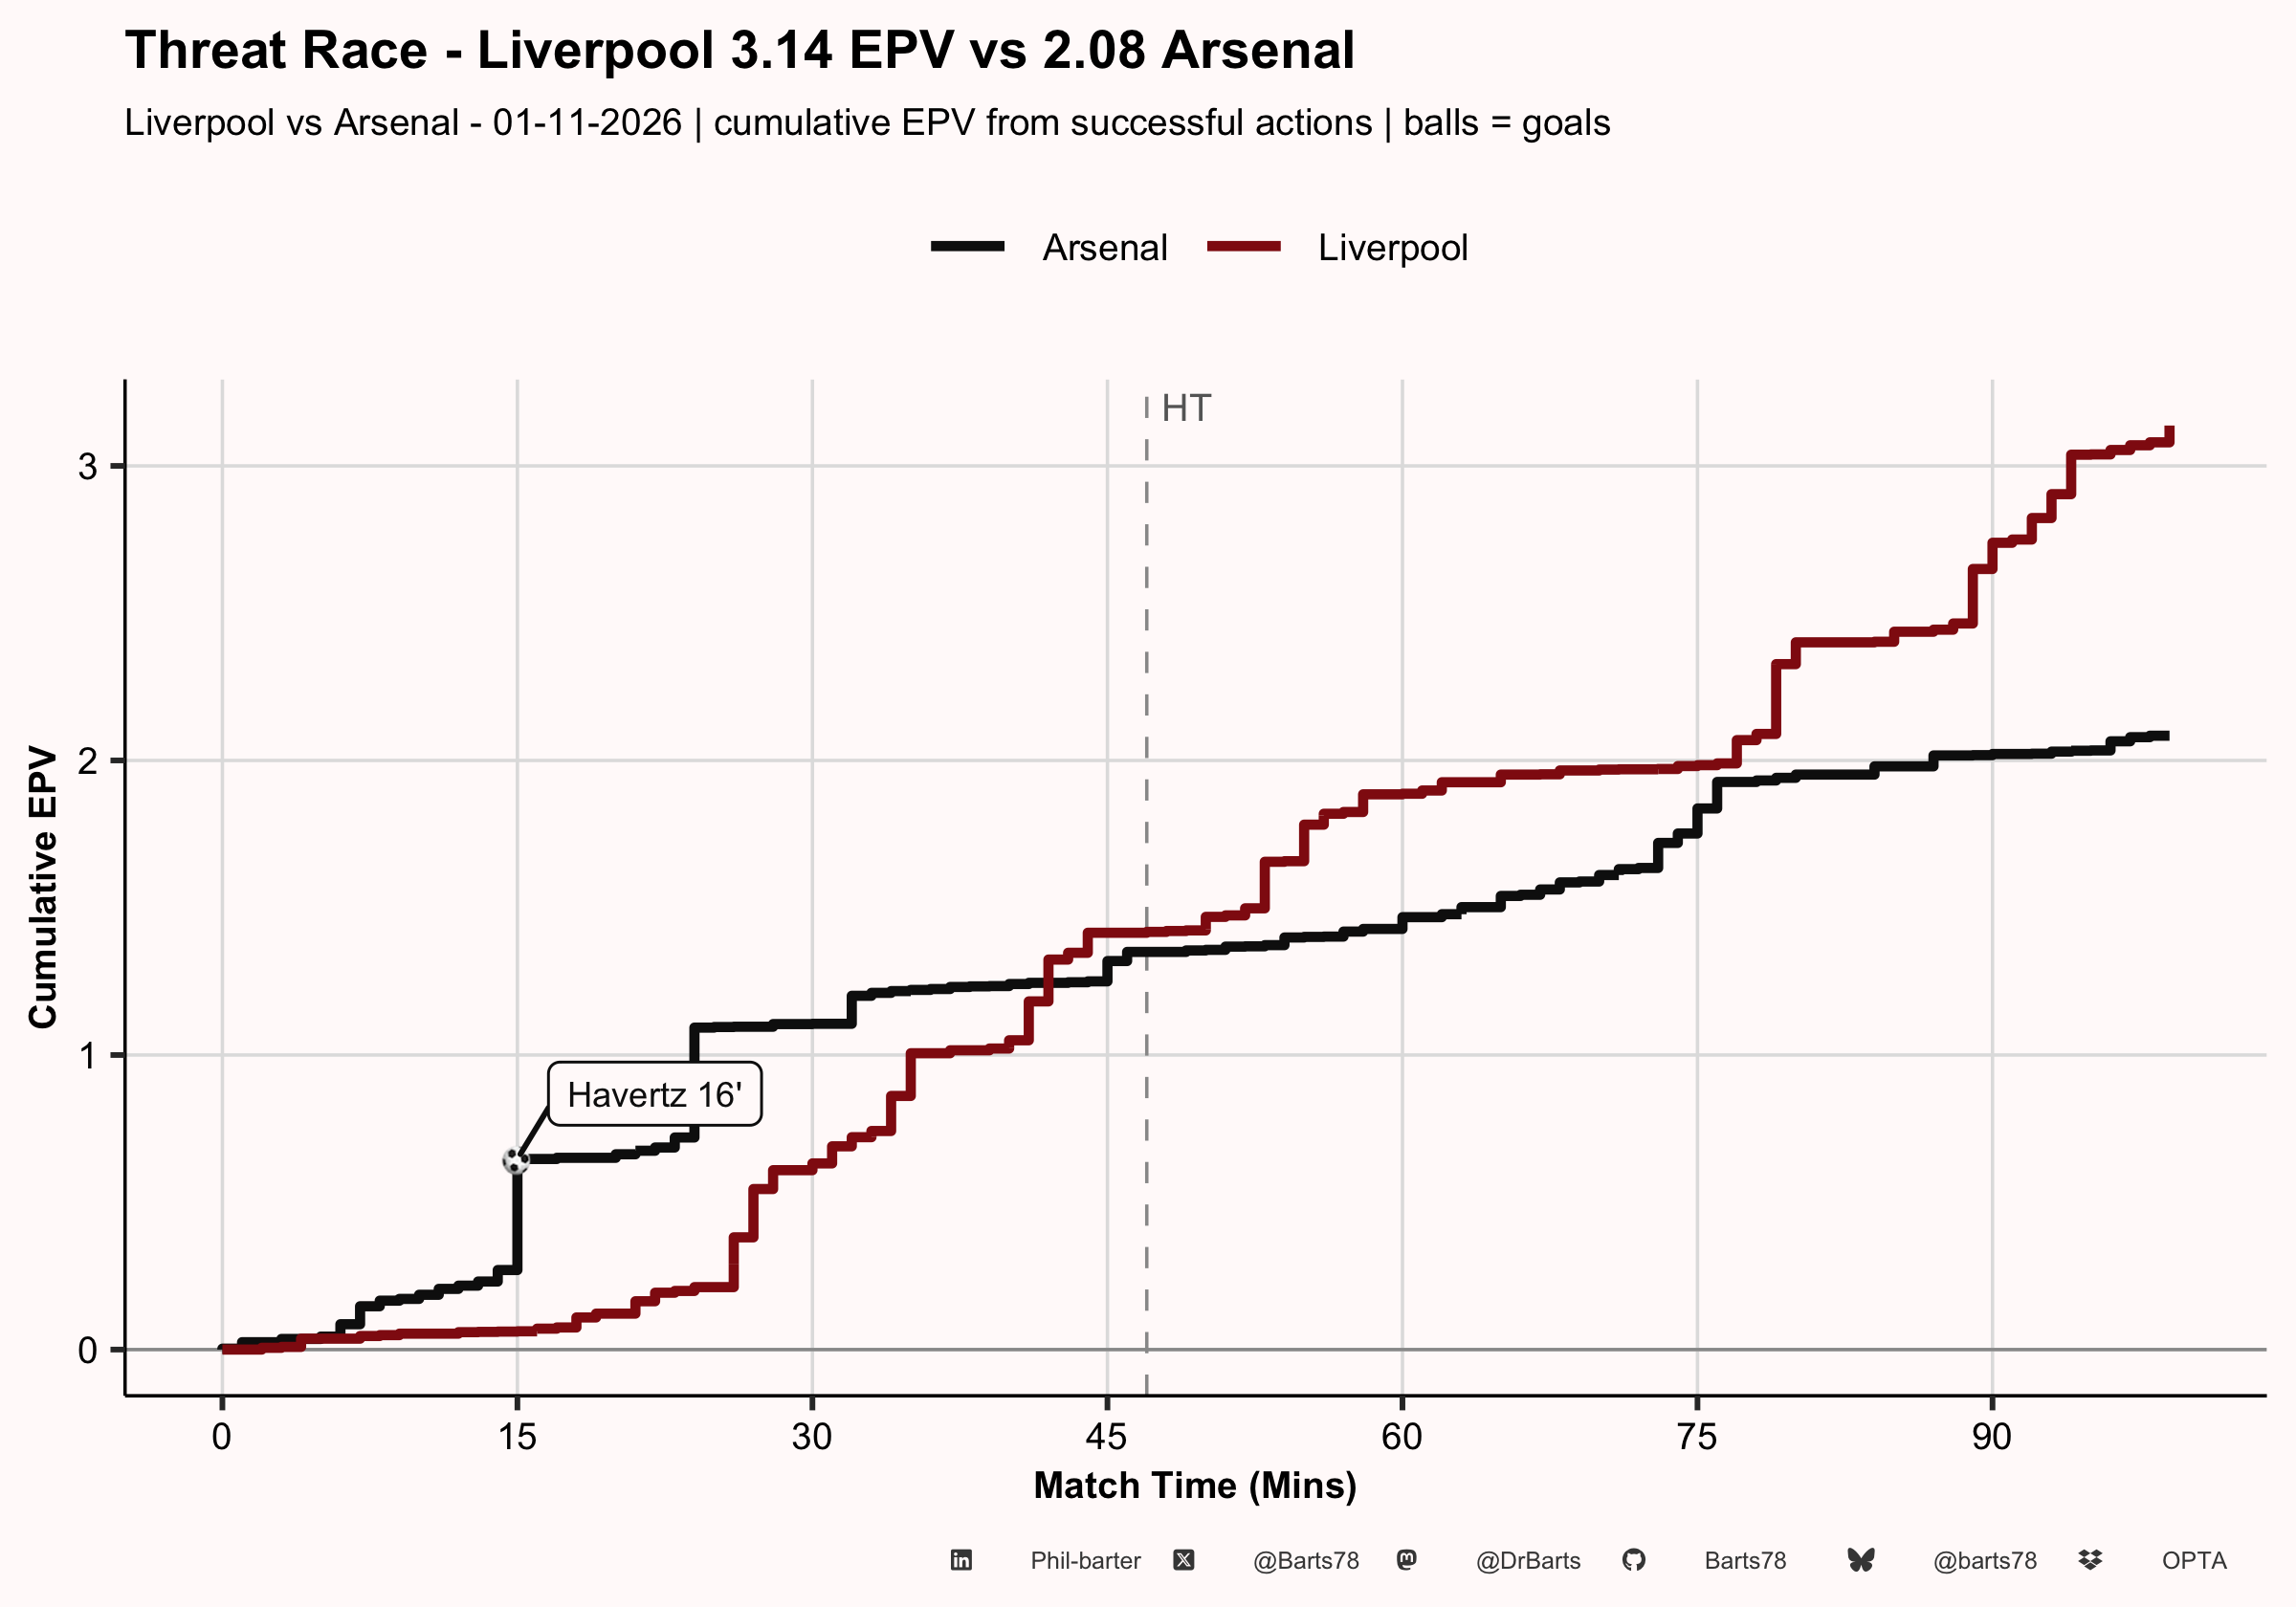
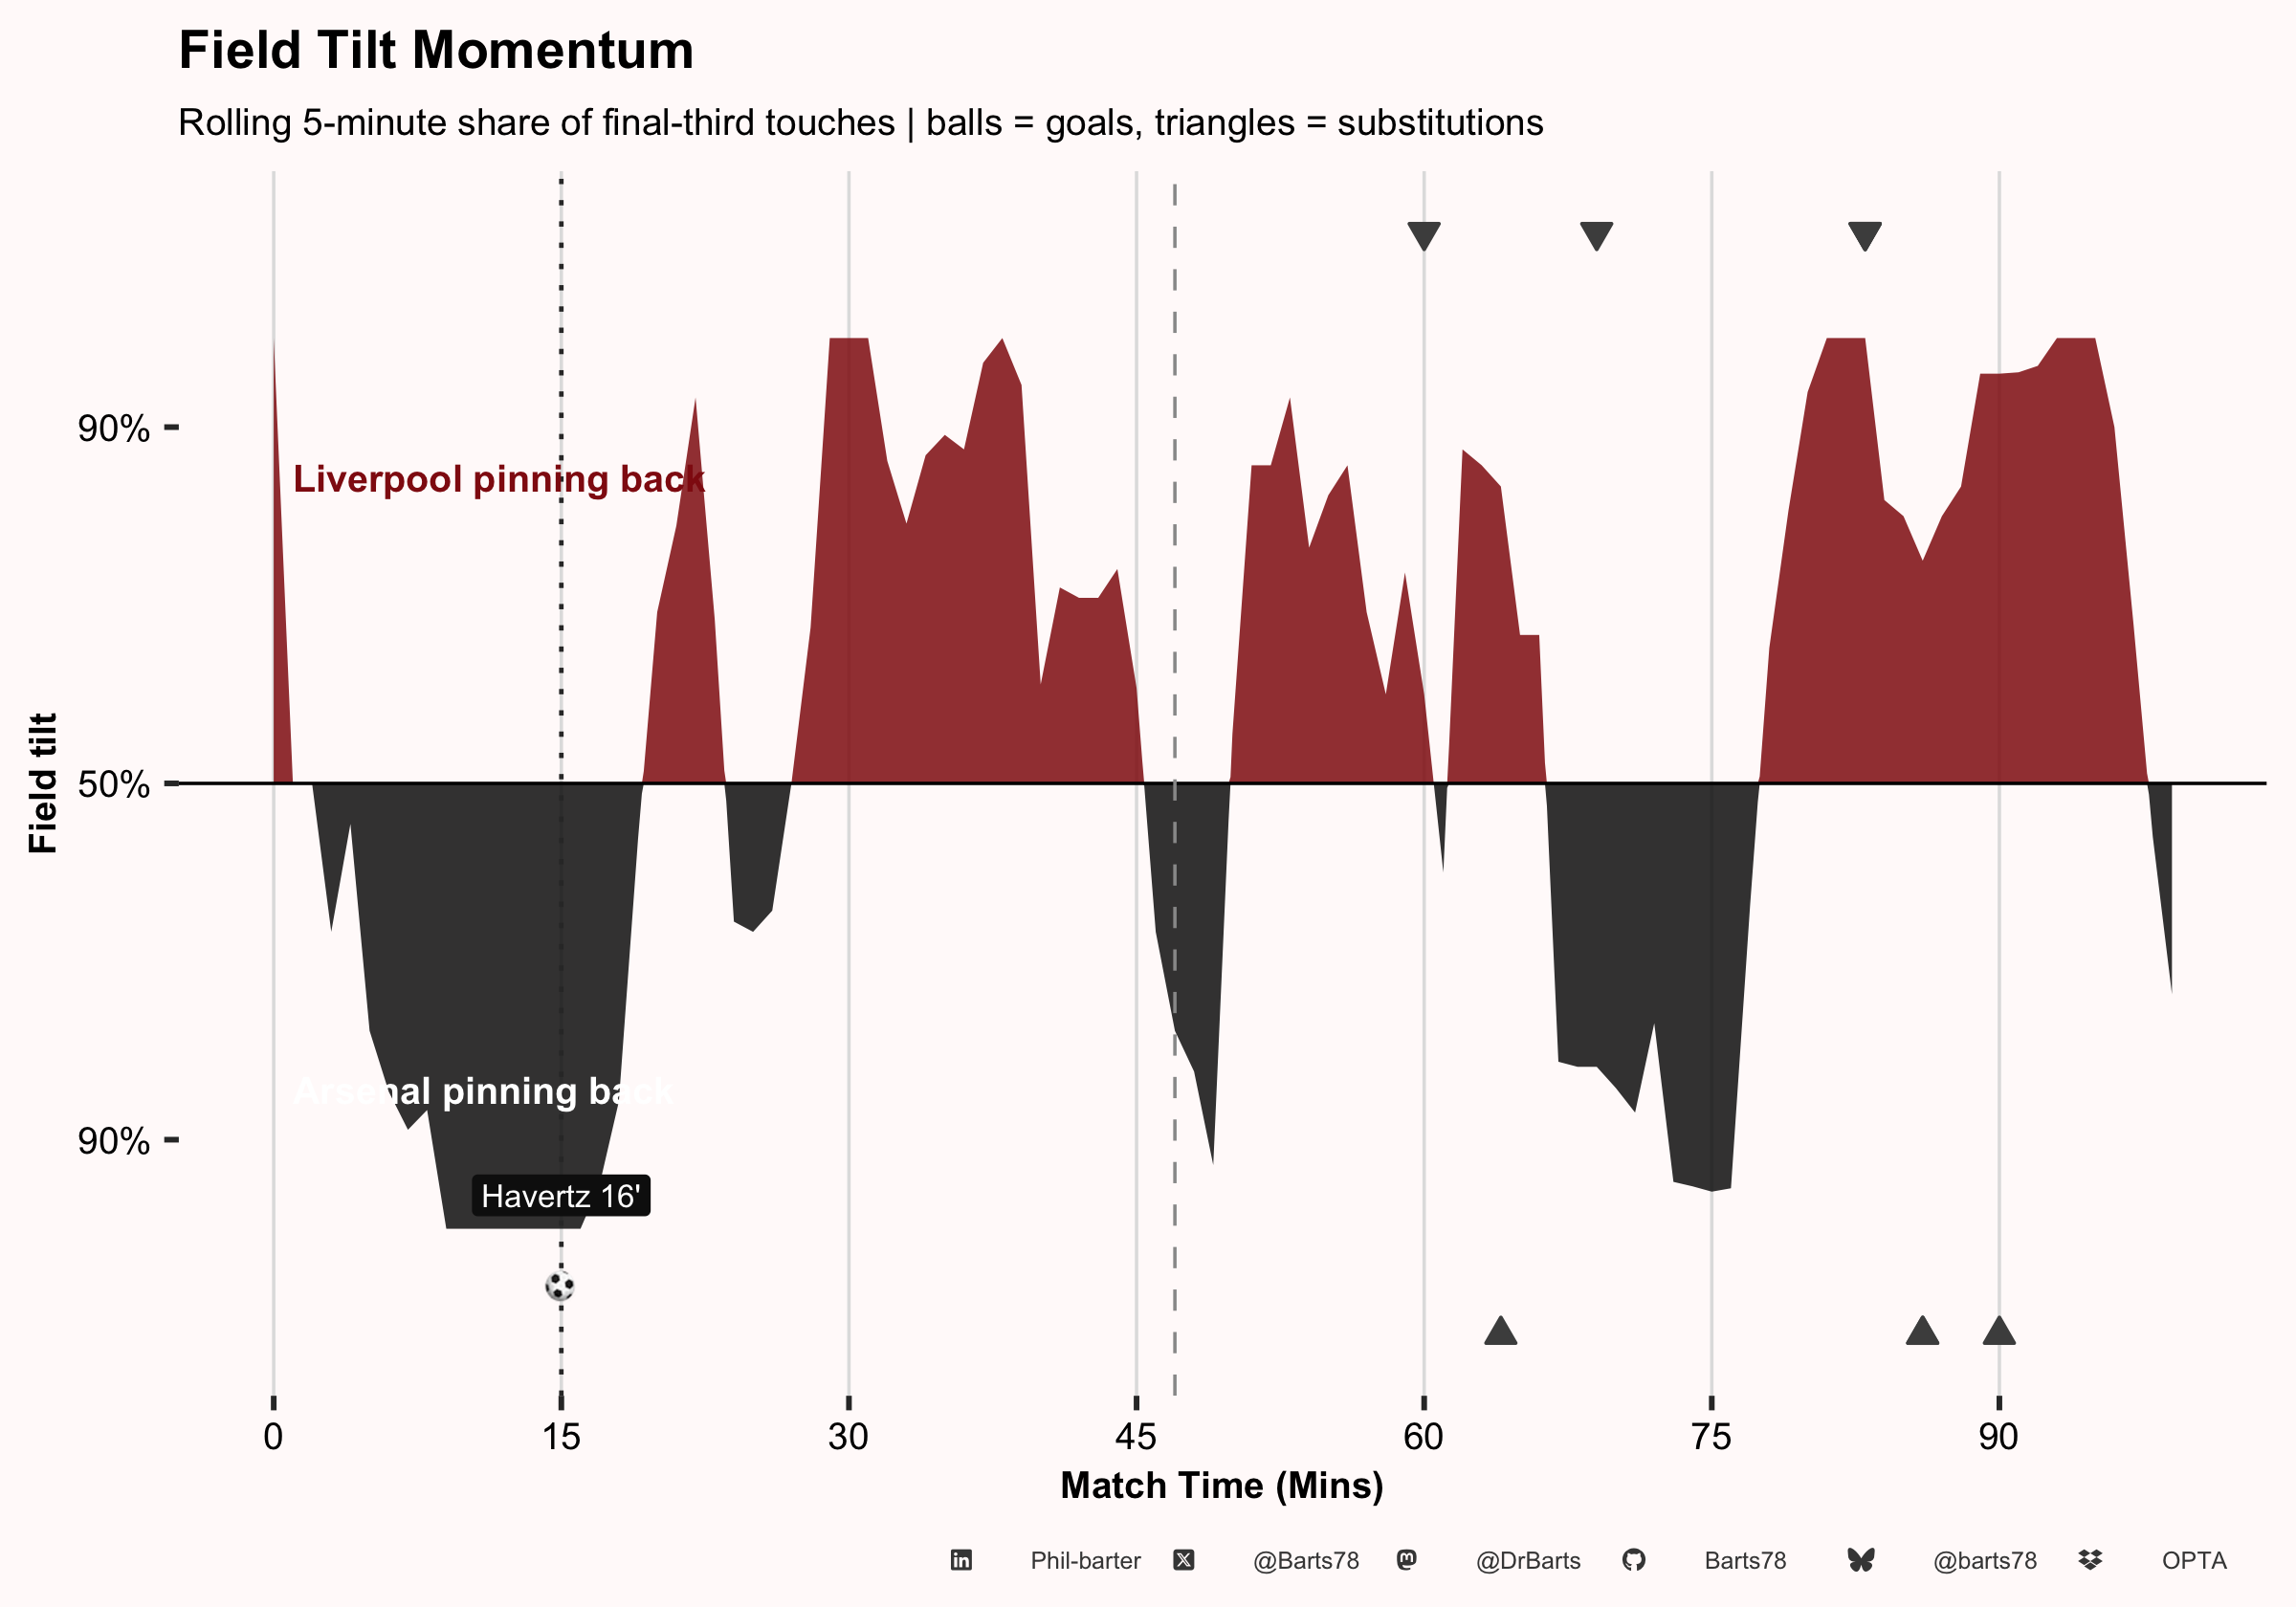
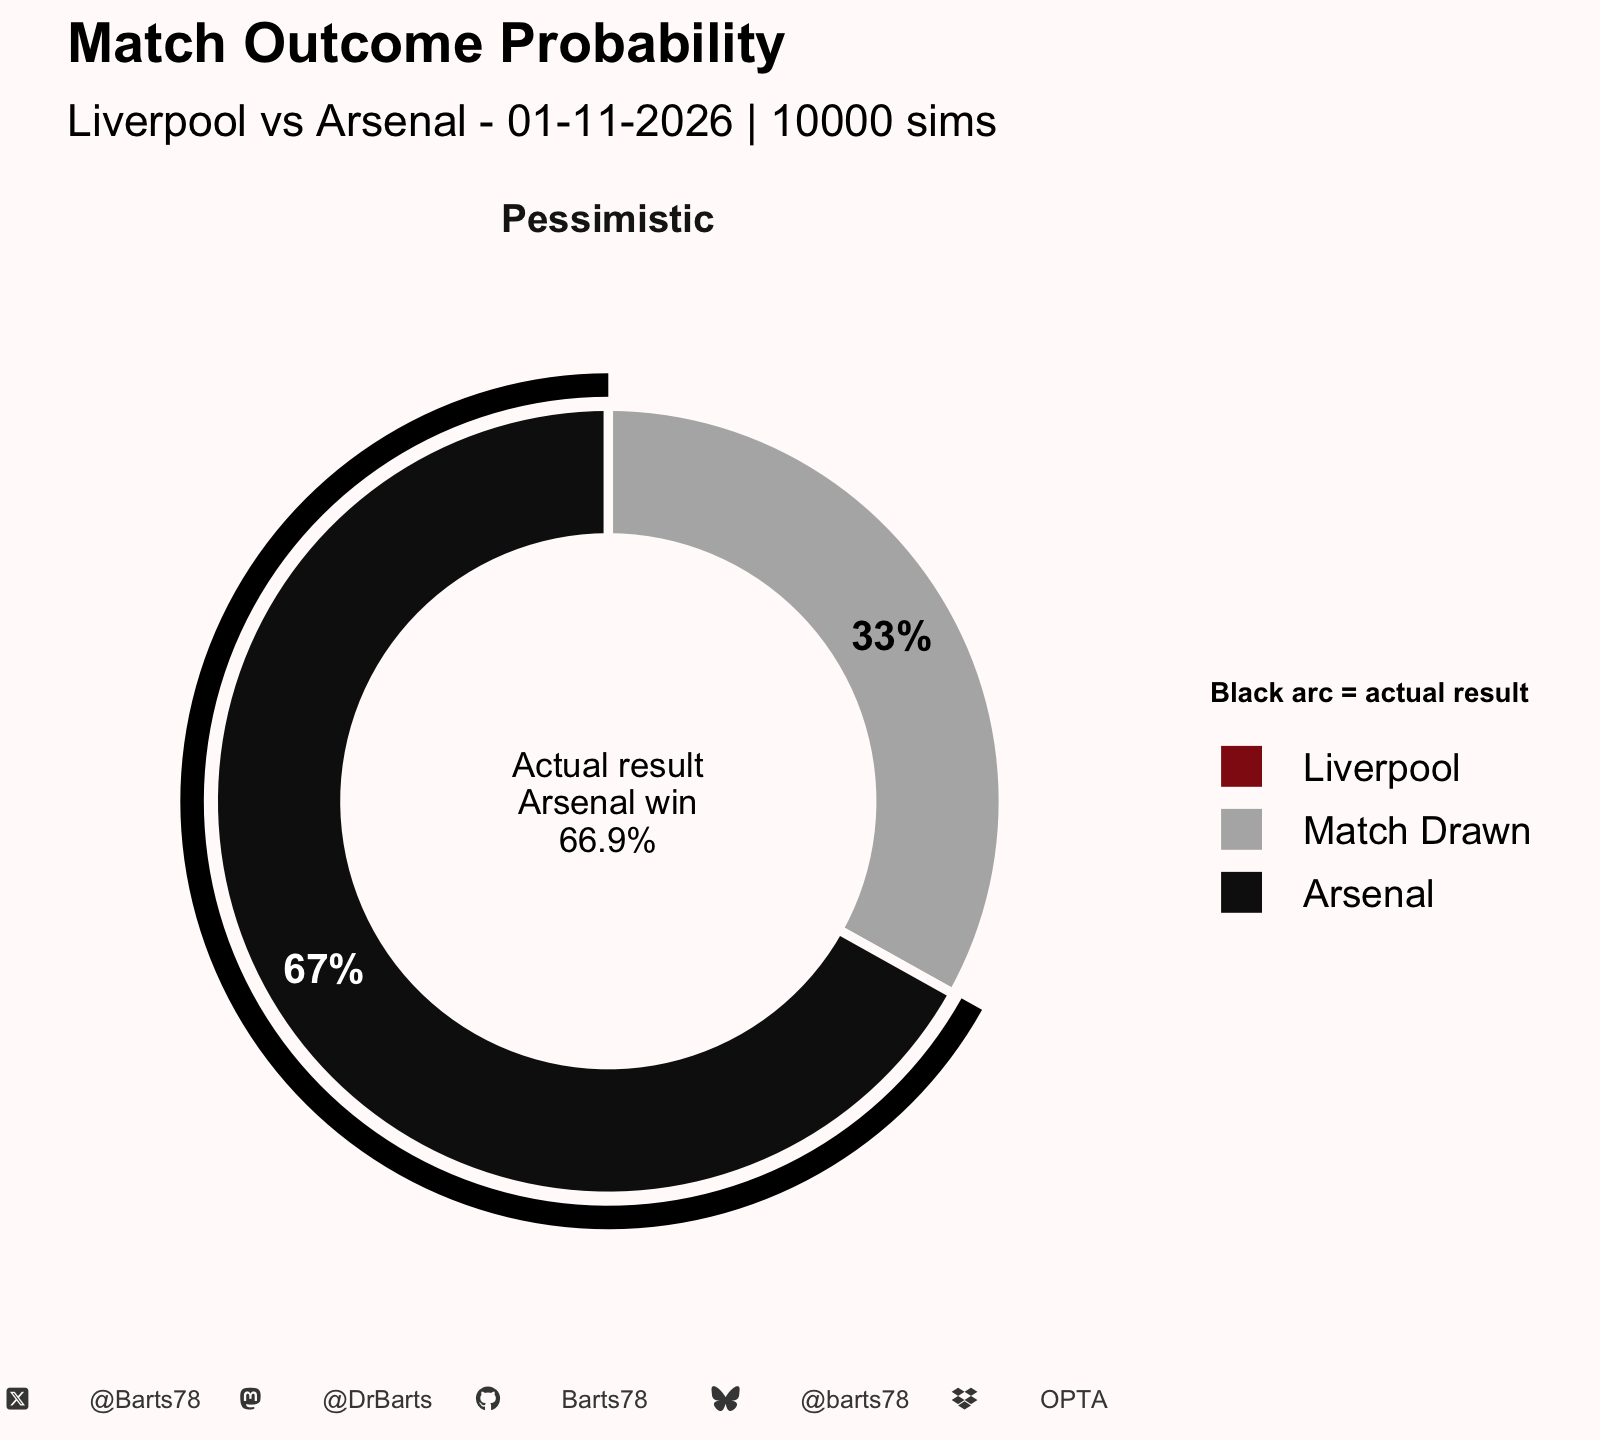
- Arsenal beat Liverpool 1–0 despite trailing on xG (0.99 vs 1.05). Liverpool's peak field tilt was 79% in the 2nd Quarter. Arsenal's peak field tilt was 73% in the 1st Quarter.
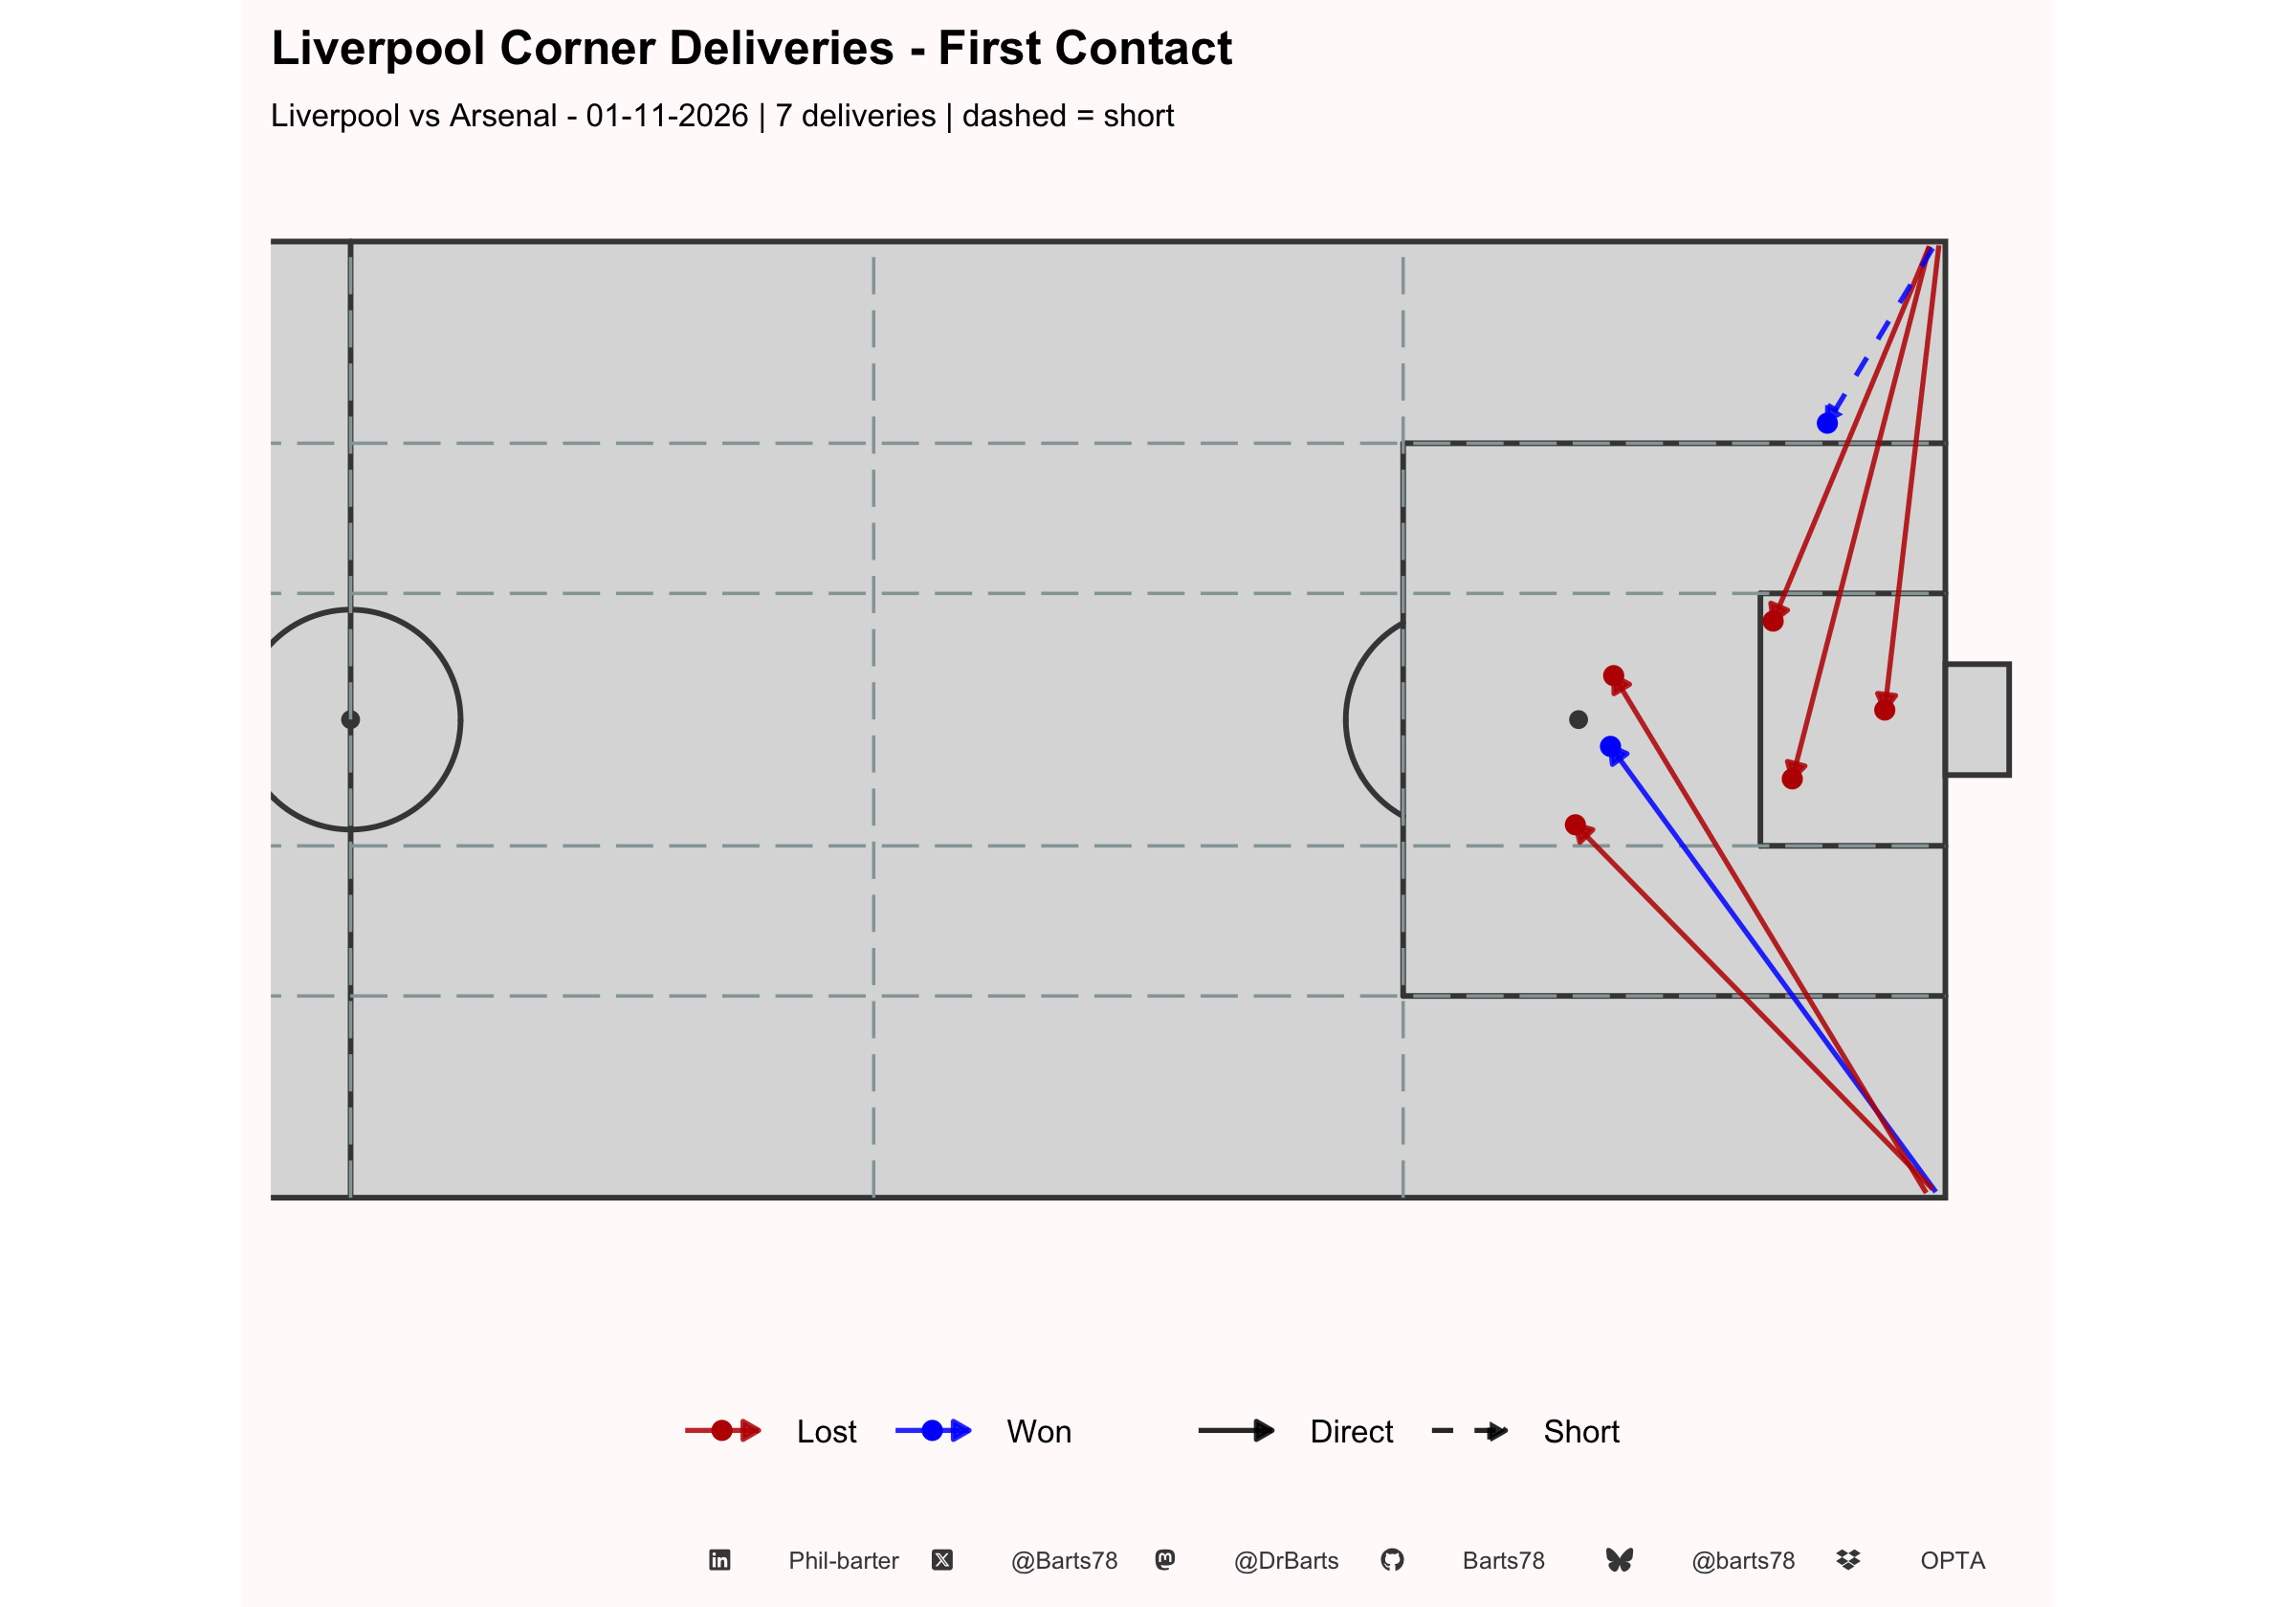
- Liverpool took 7 corners (1 short), winning first contact on 1 of 6 direct deliveries. Set pieces produced 4 shots worth 0.12 xG (11% of their xG).
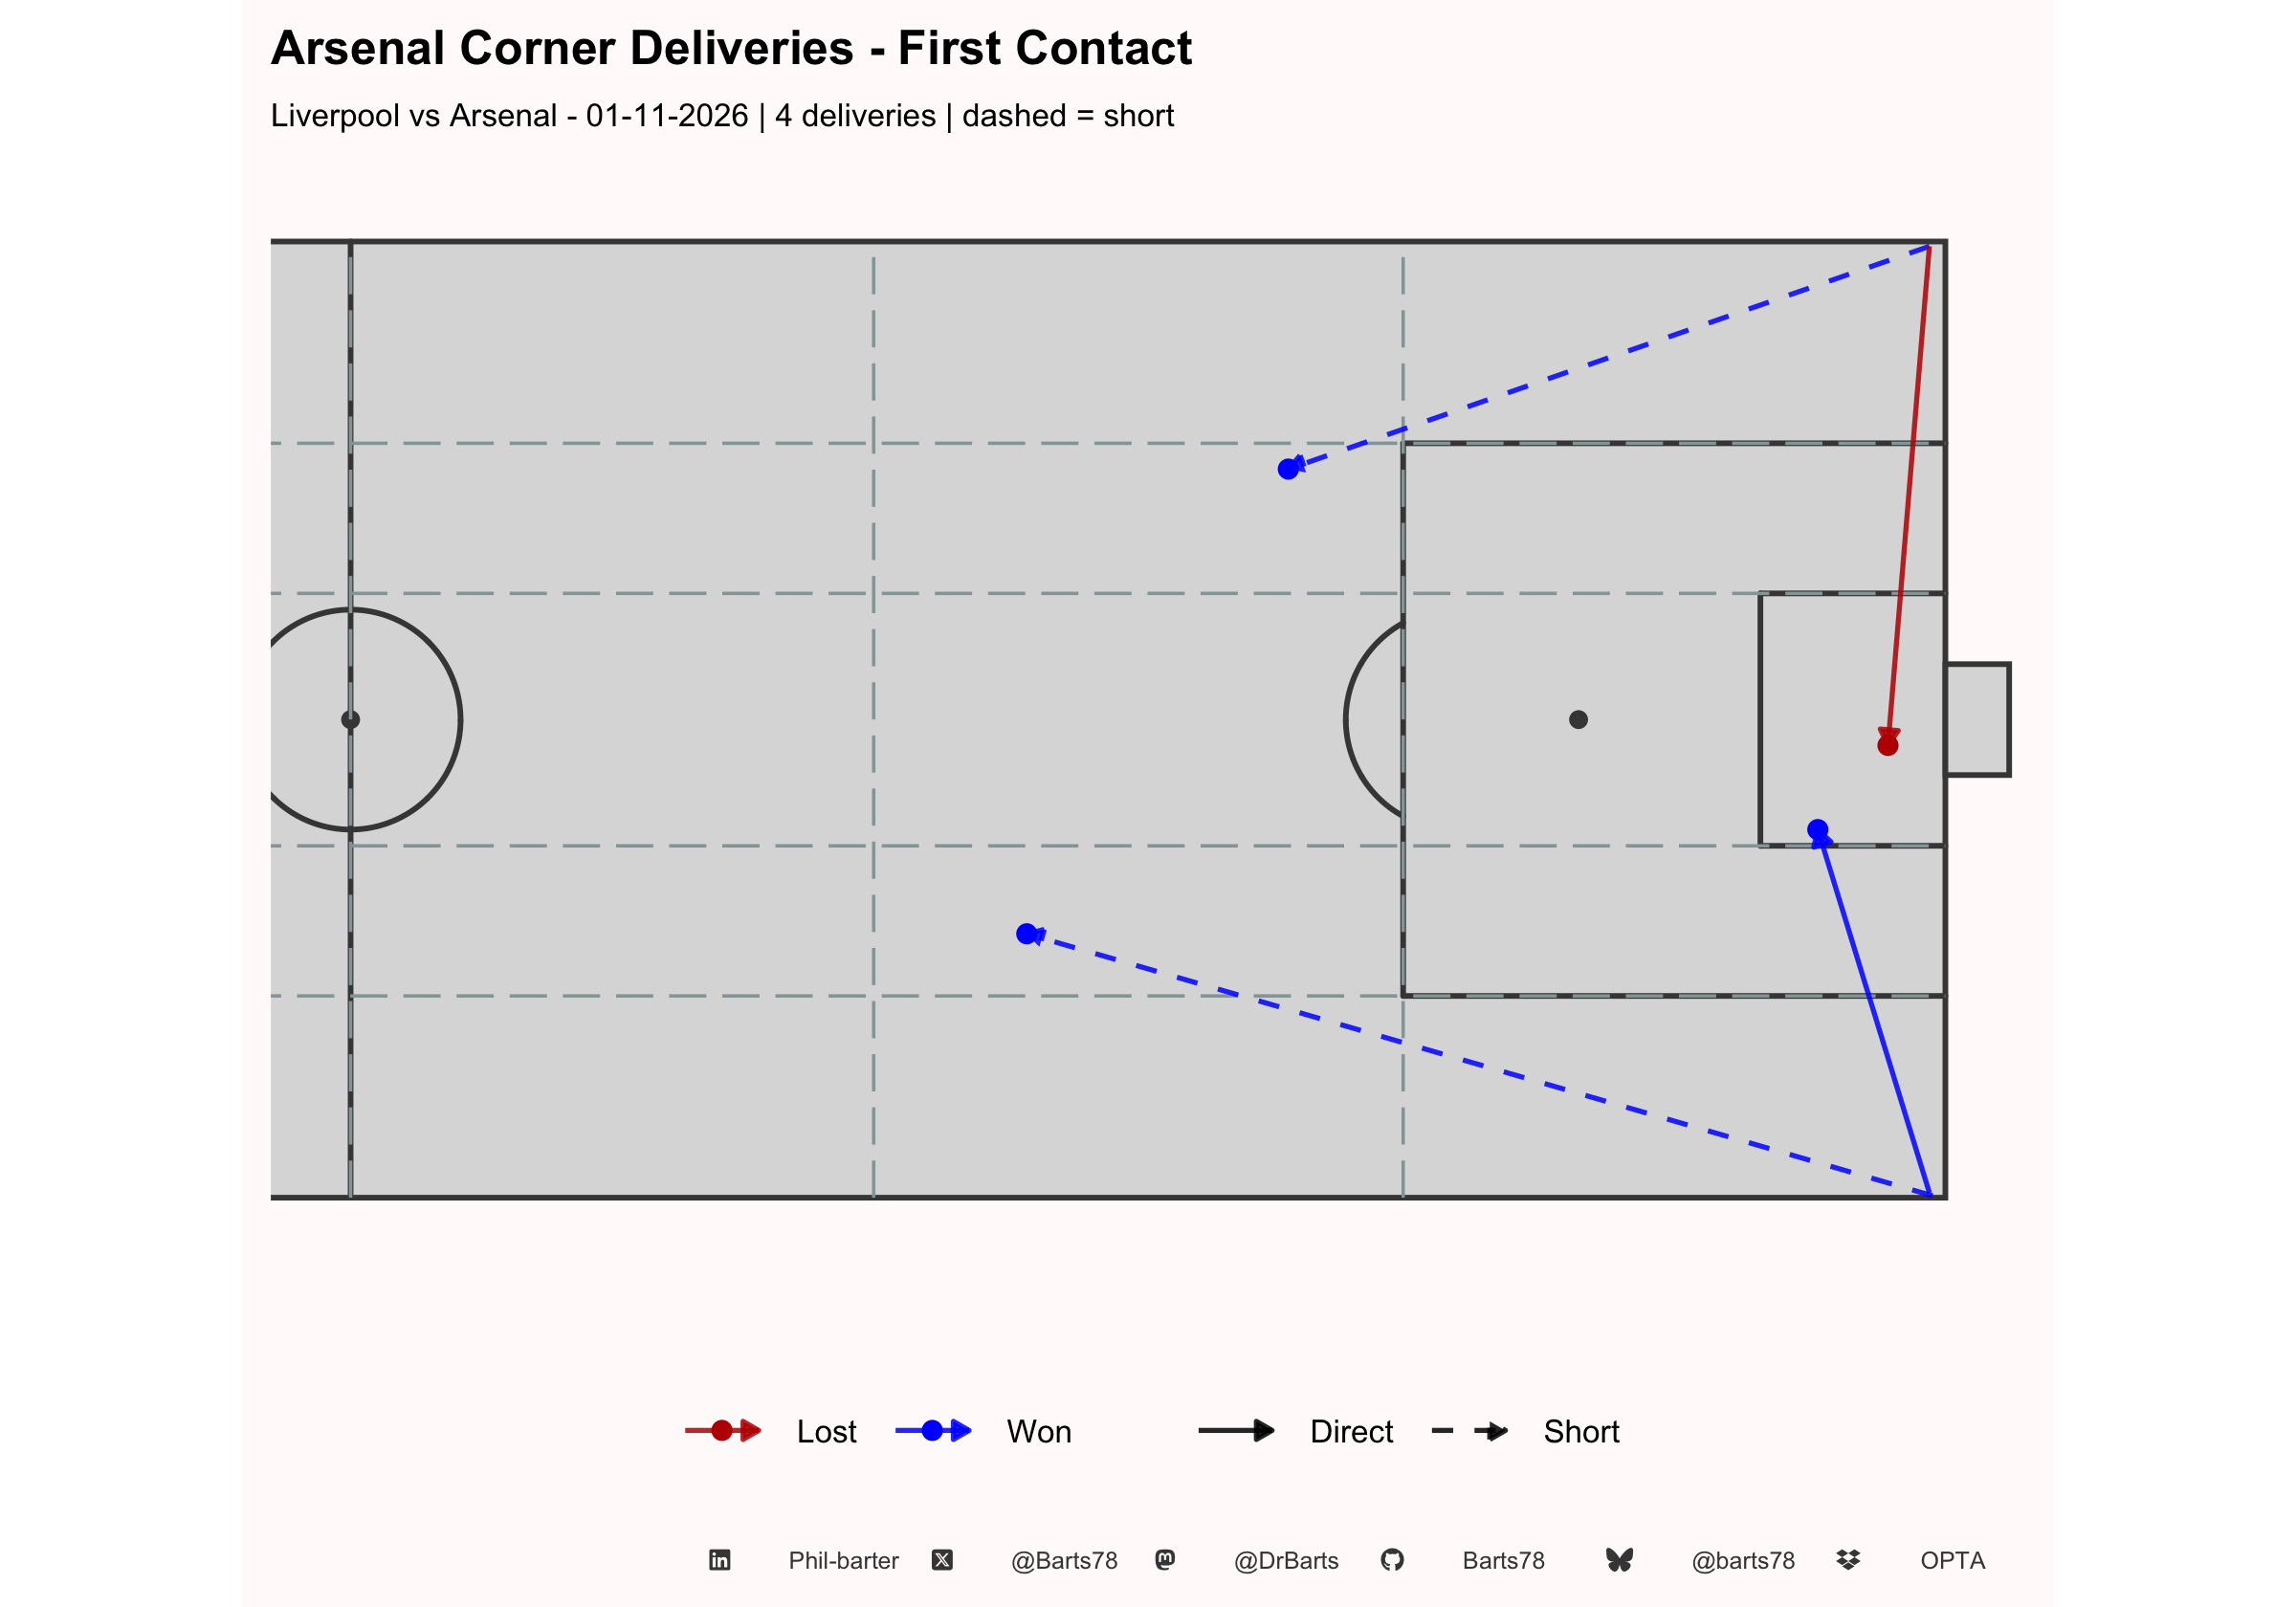
- Arsenal took 4 corners (2 short), winning first contact on 1 of 2 direct deliveries. Set pieces produced 1 shot worth 0.04 xG (4% of their xG).
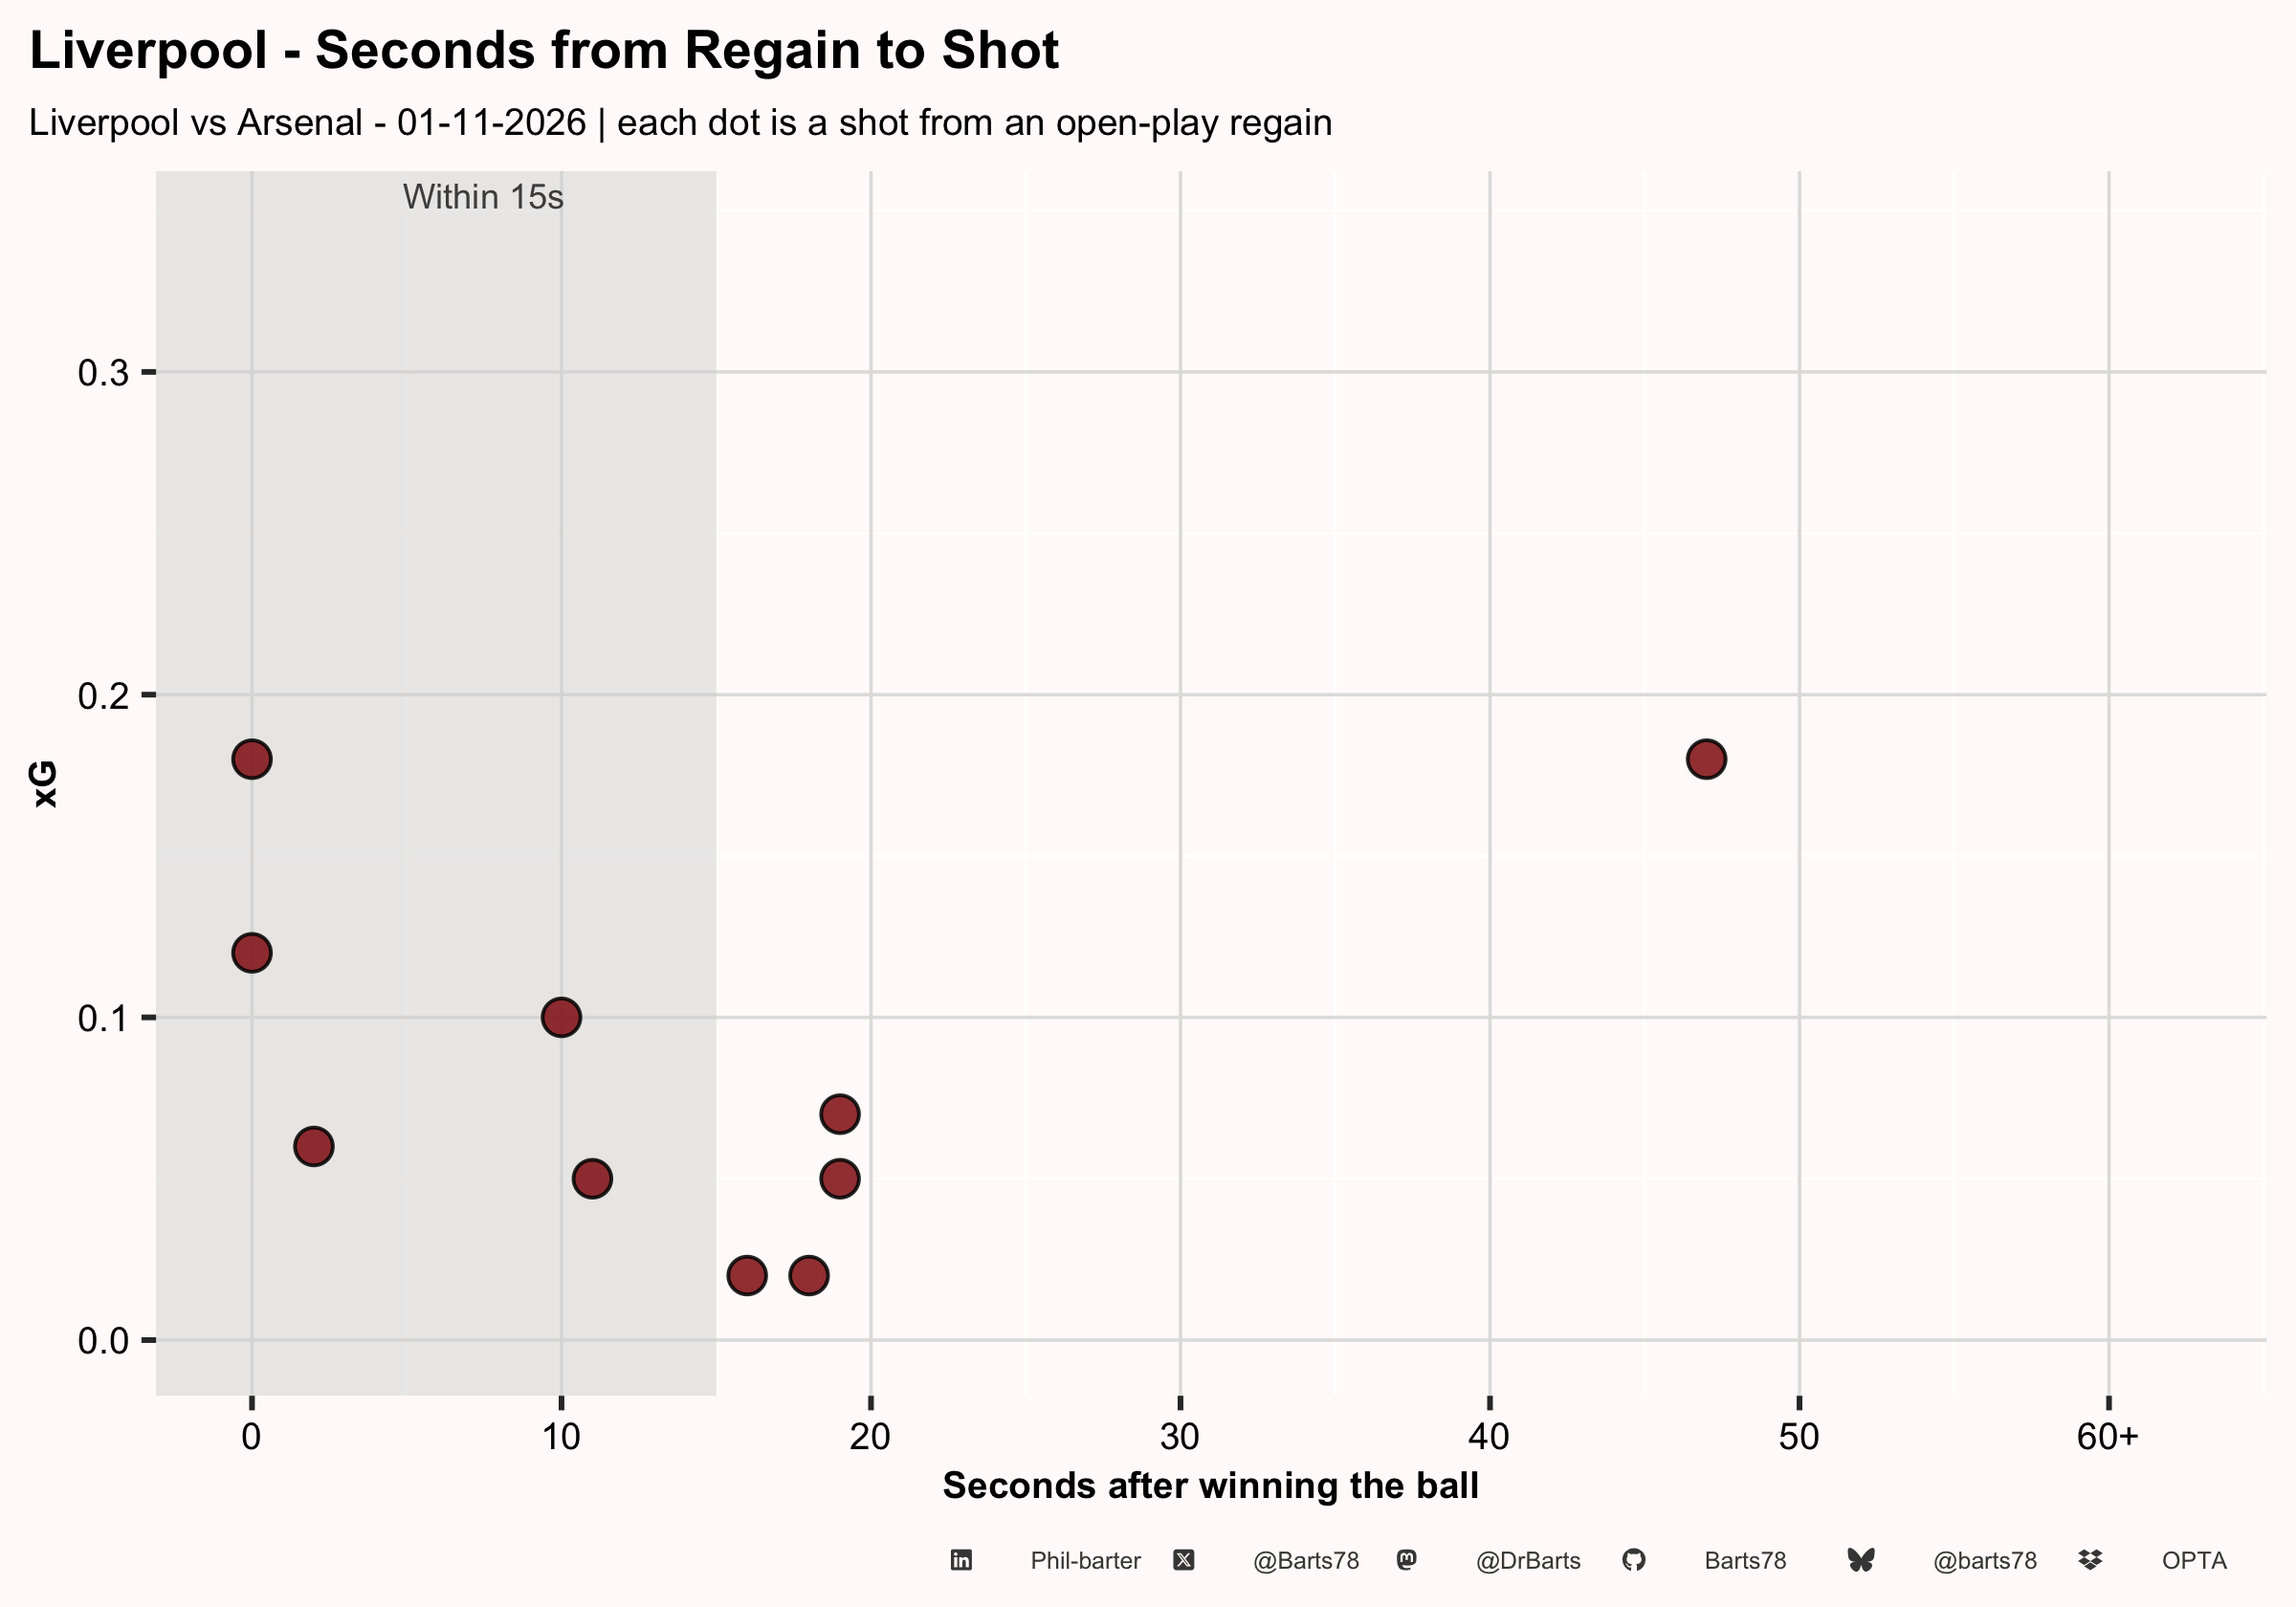
- Liverpool won the ball in open play 105 times (17 in the attacking third) and had 5 shots within 15 seconds of a regain, worth 0.51 xG.
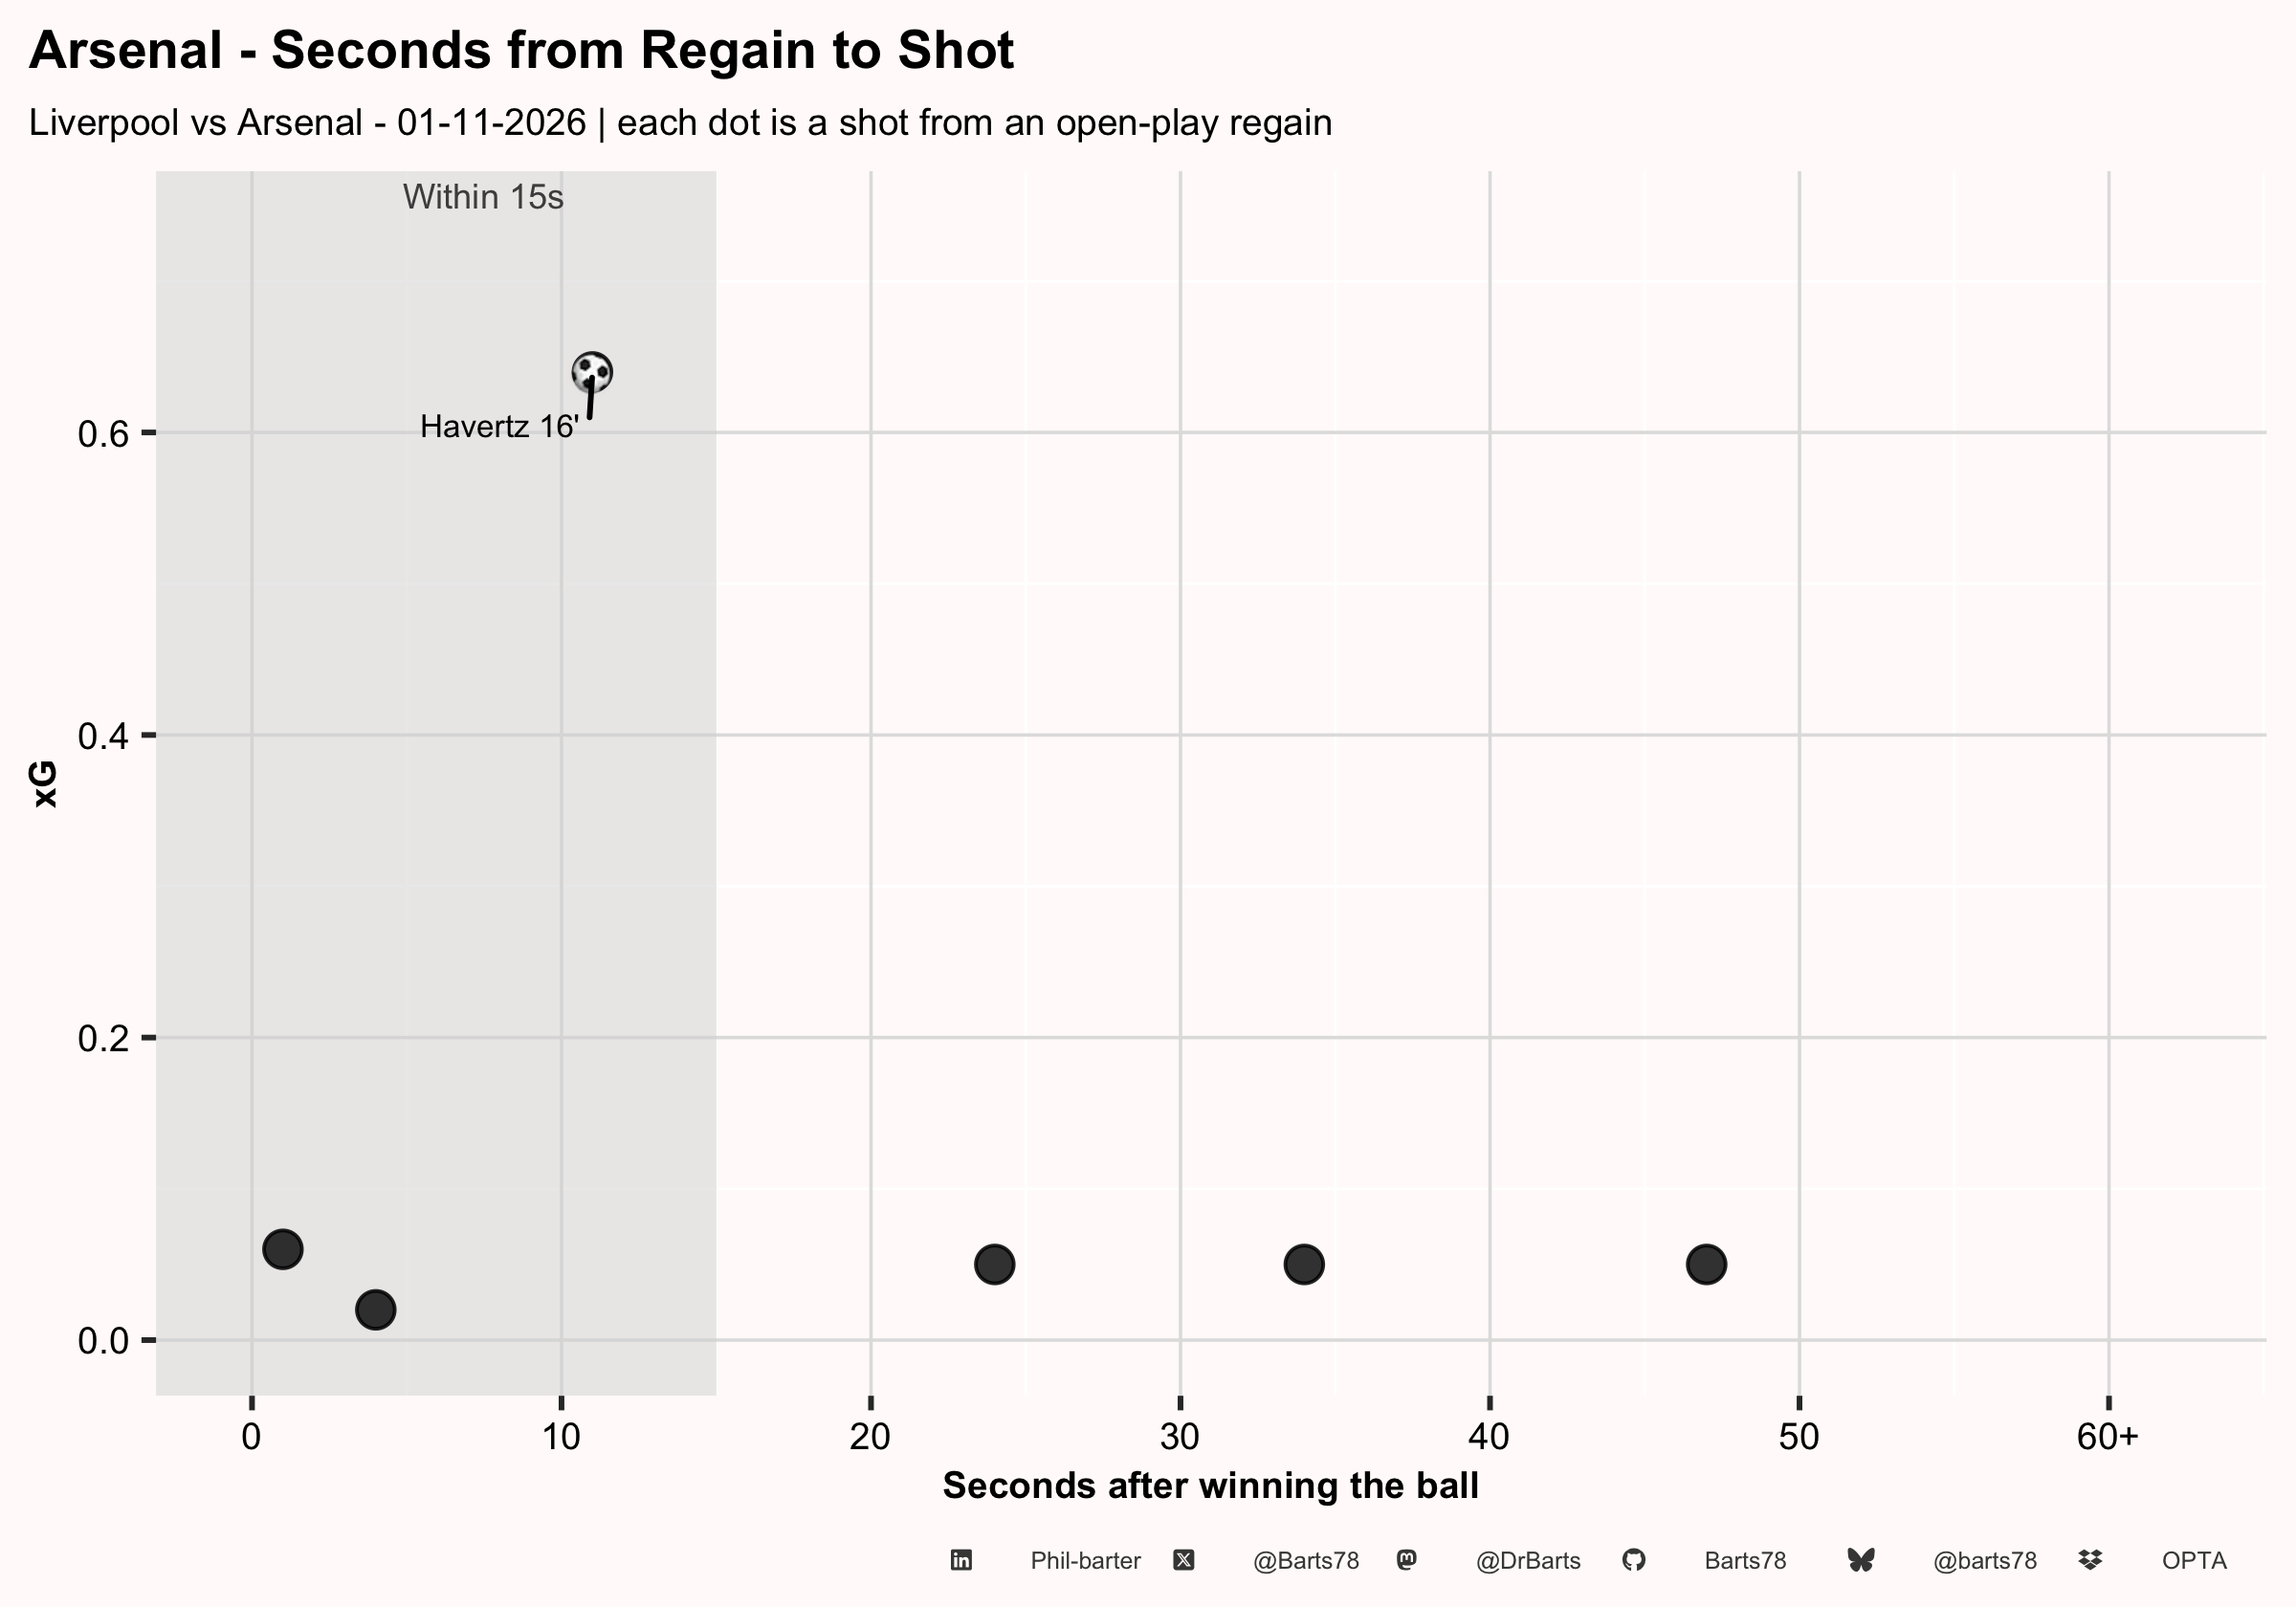
- Arsenal won the ball in open play 90 times (6 in the attacking third) and had 3 shots within 15 seconds of a regain, worth 0.72 xG including 1 goal (Havertz 16').
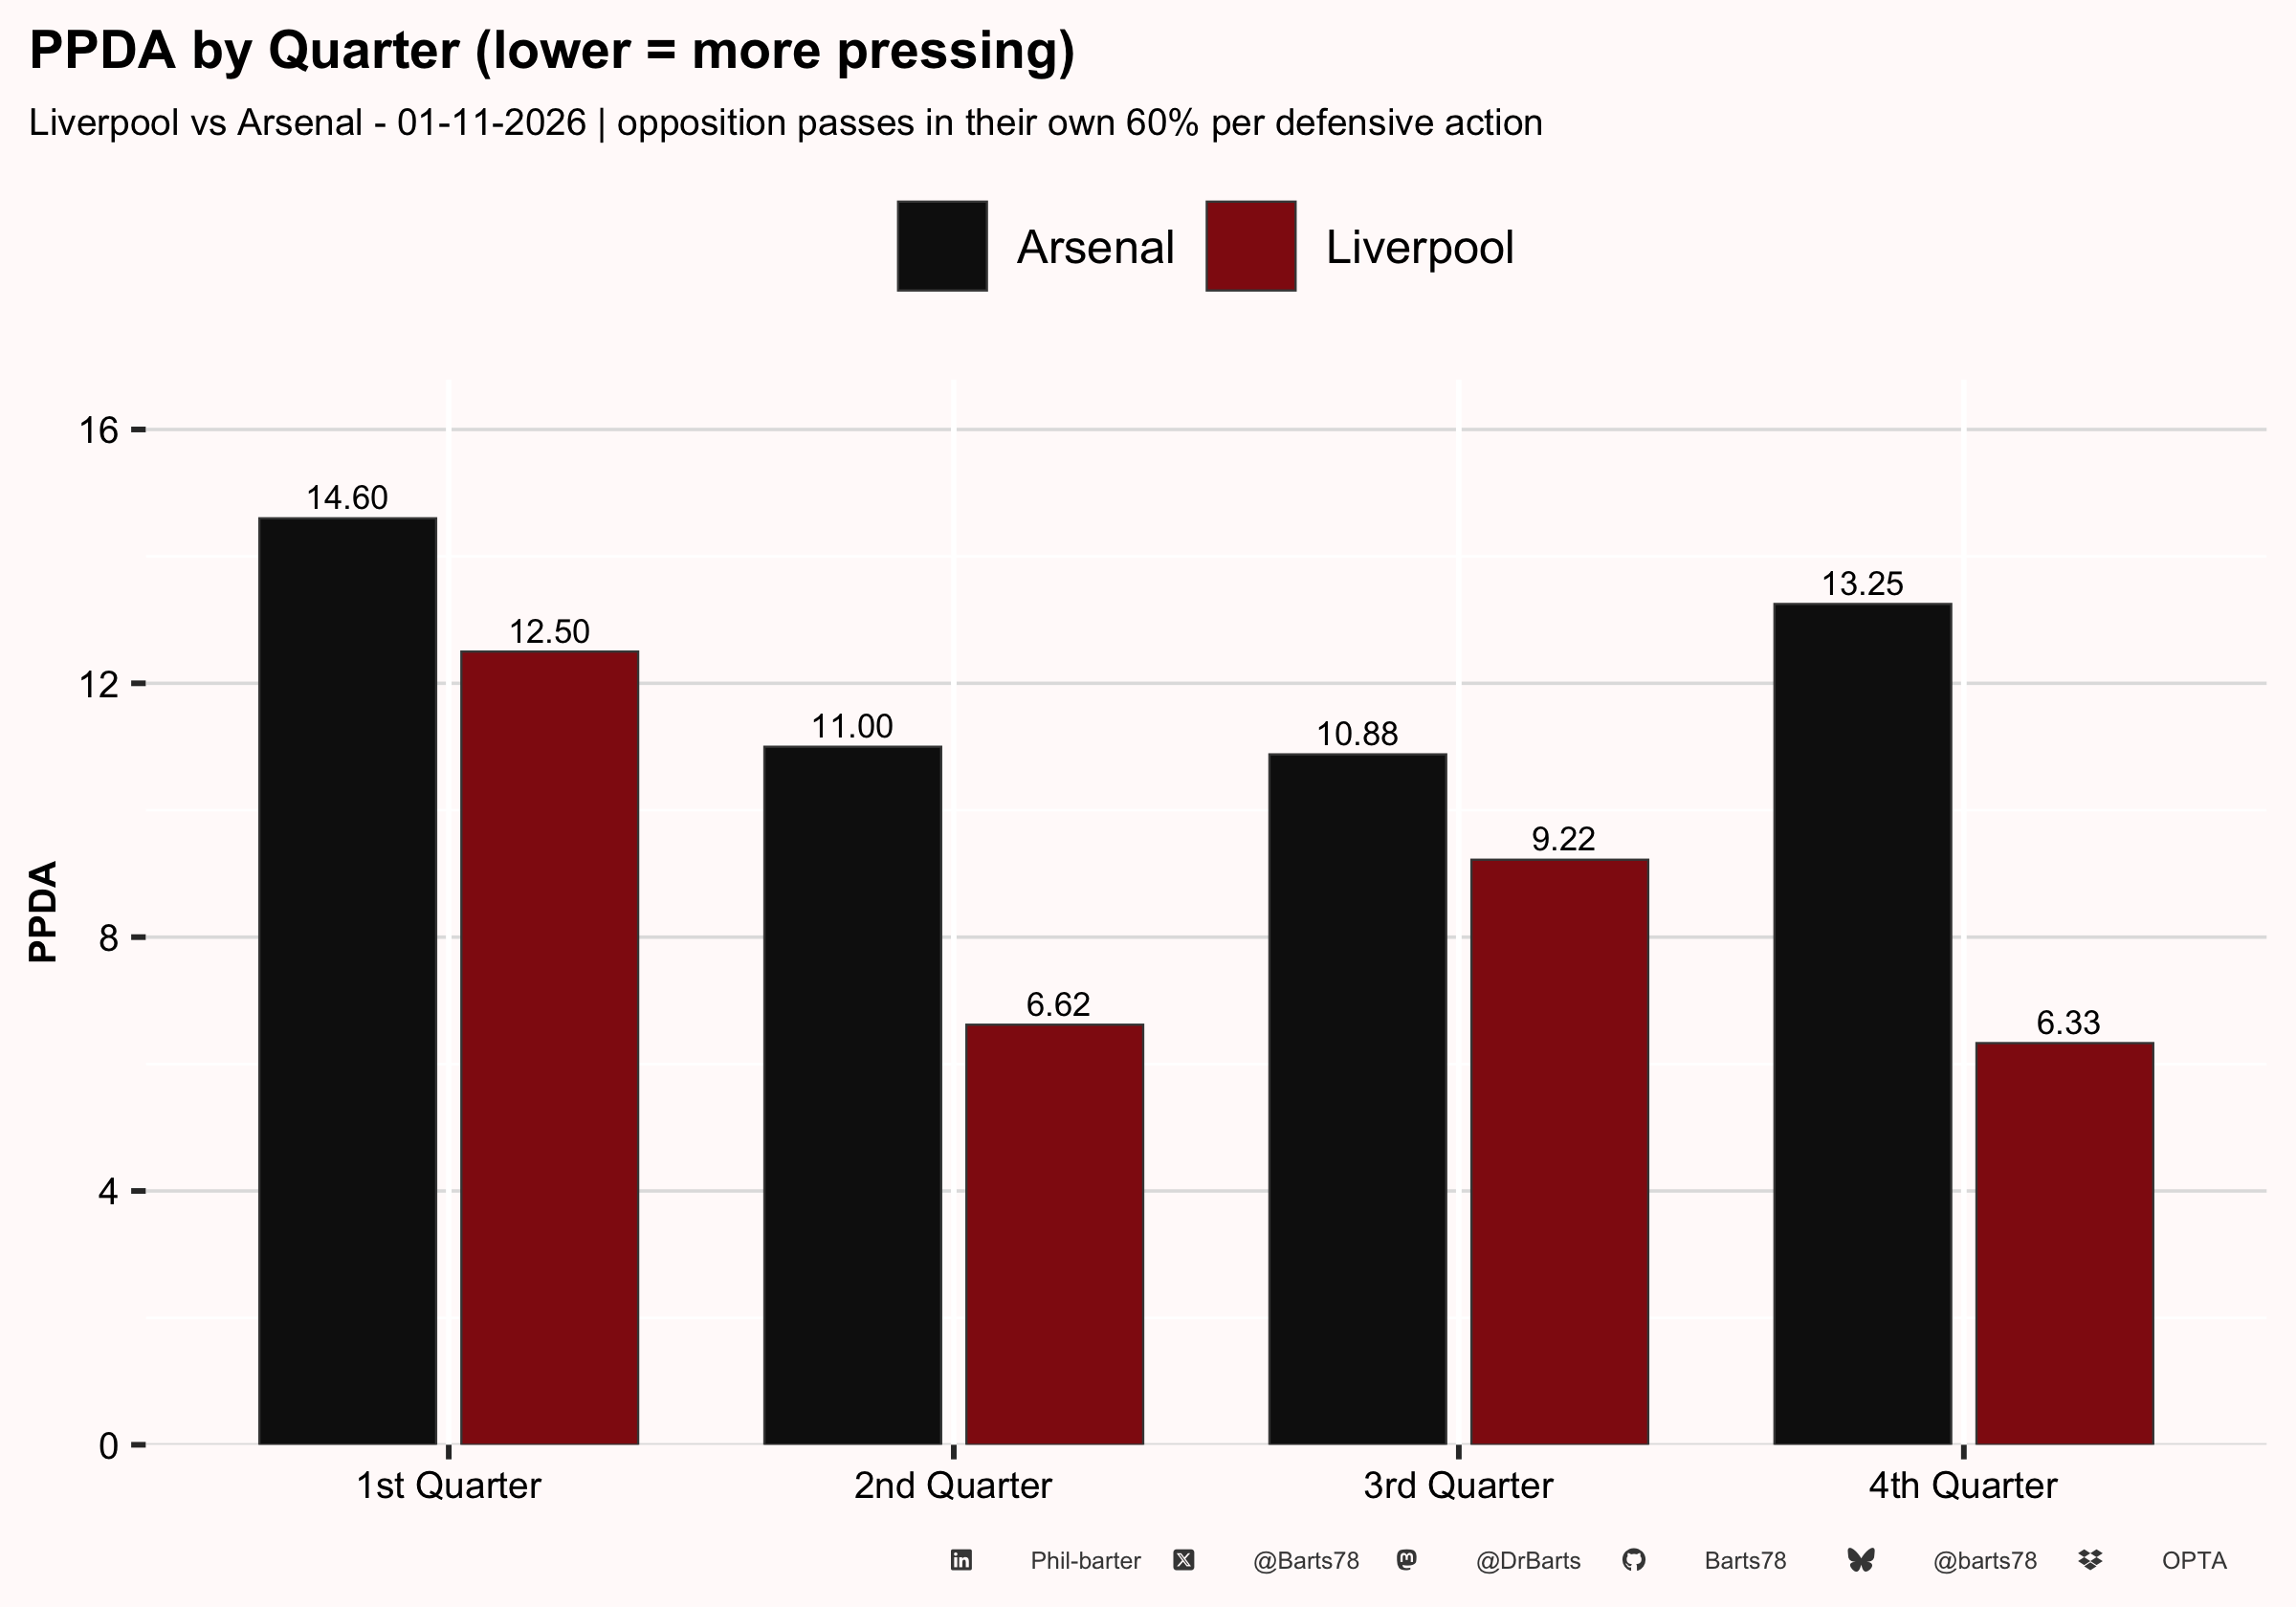
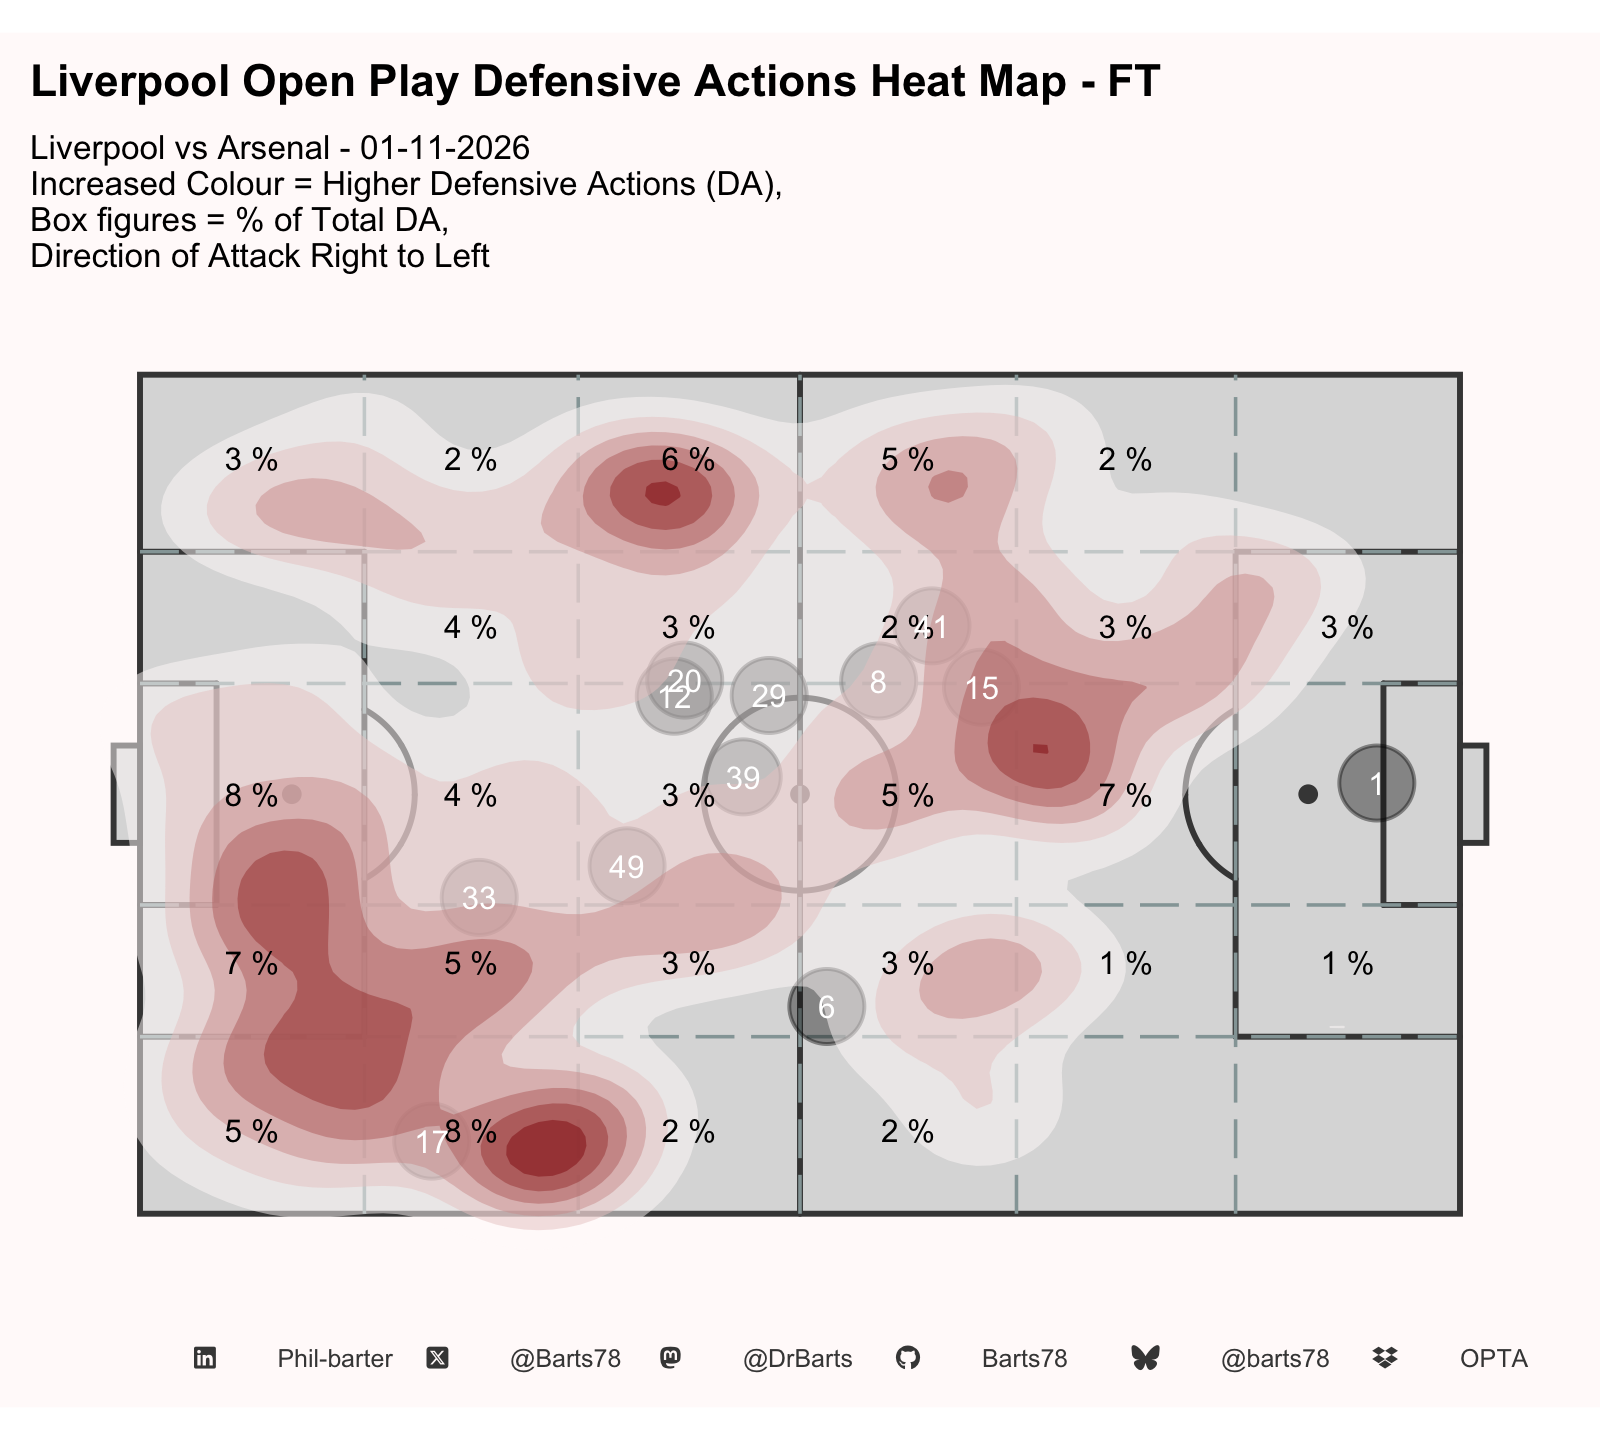
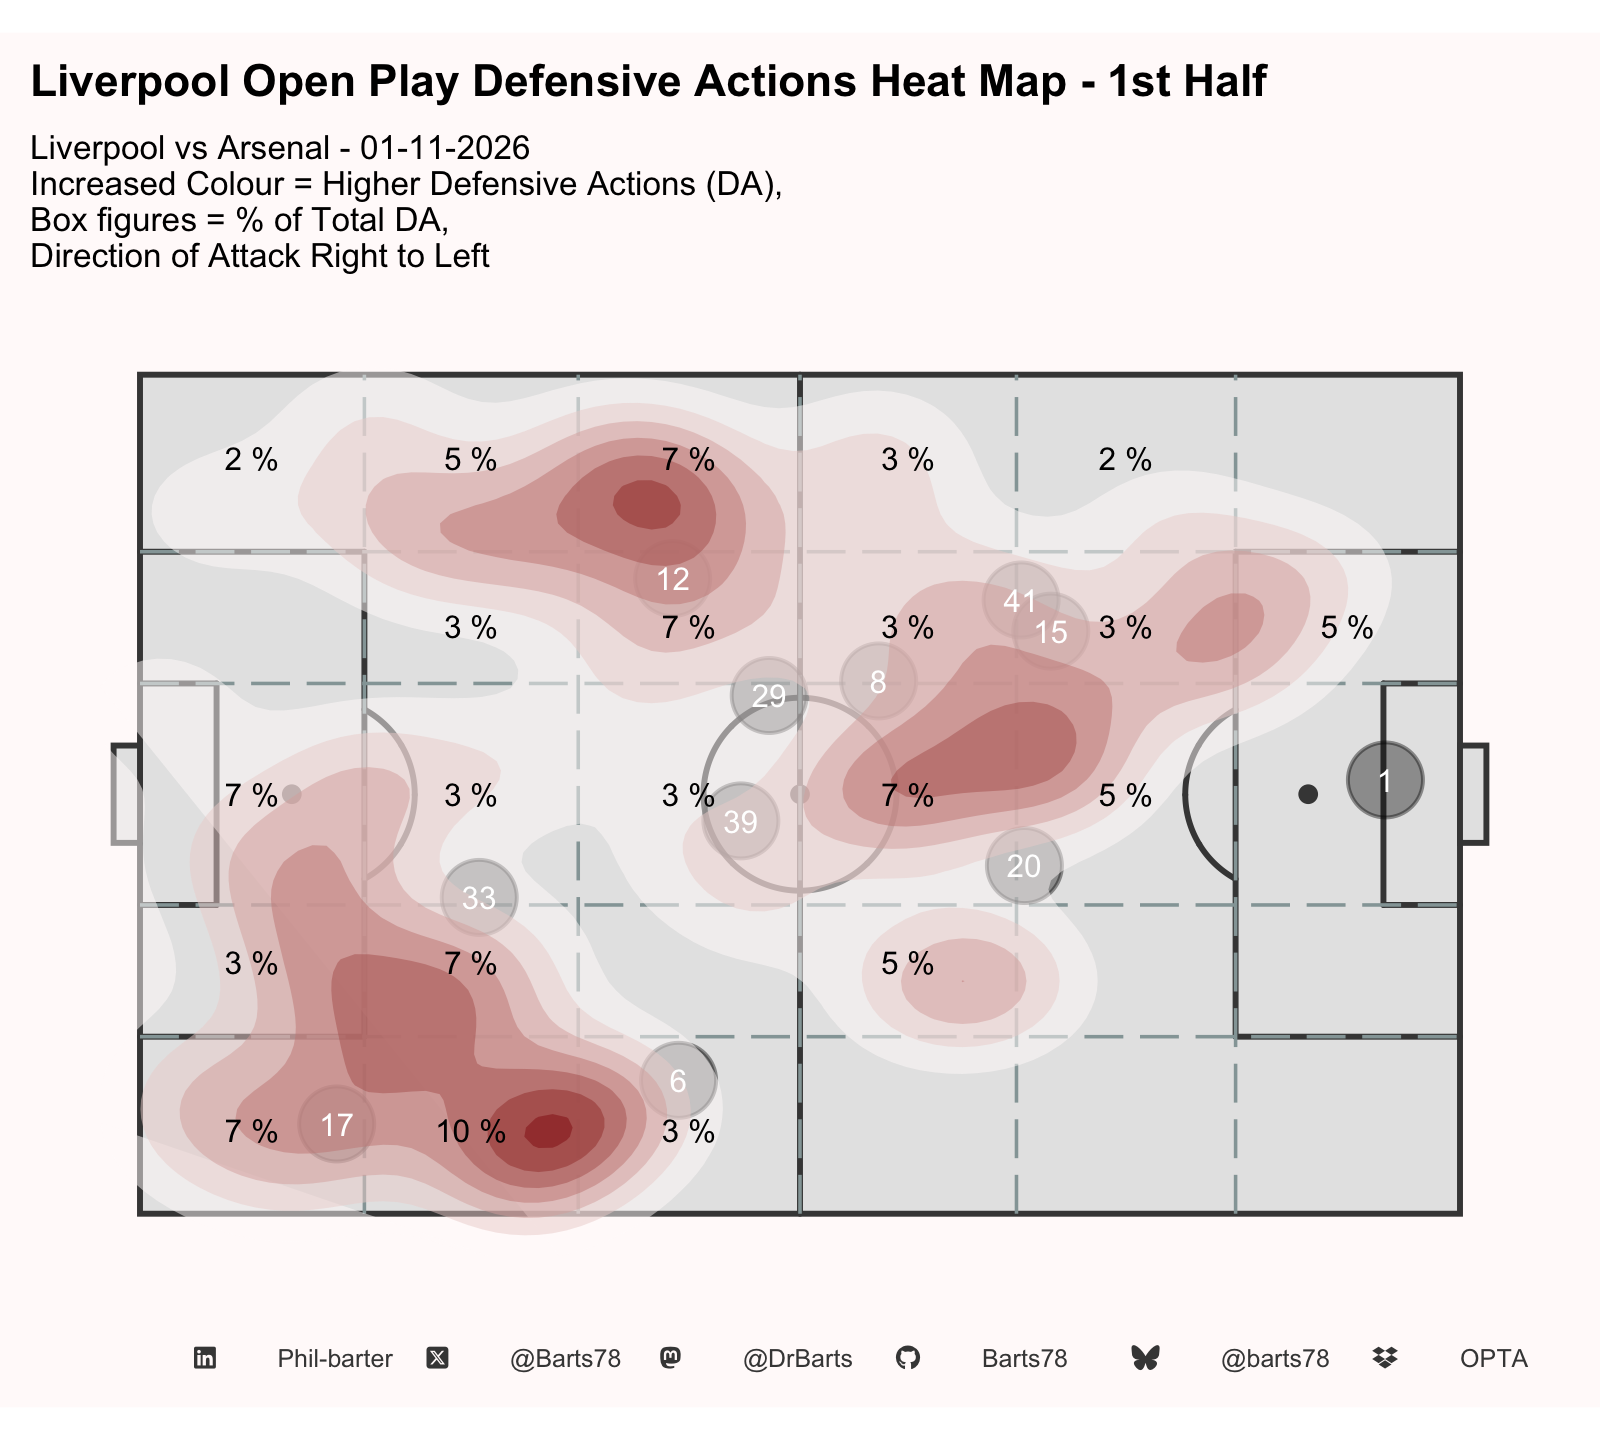
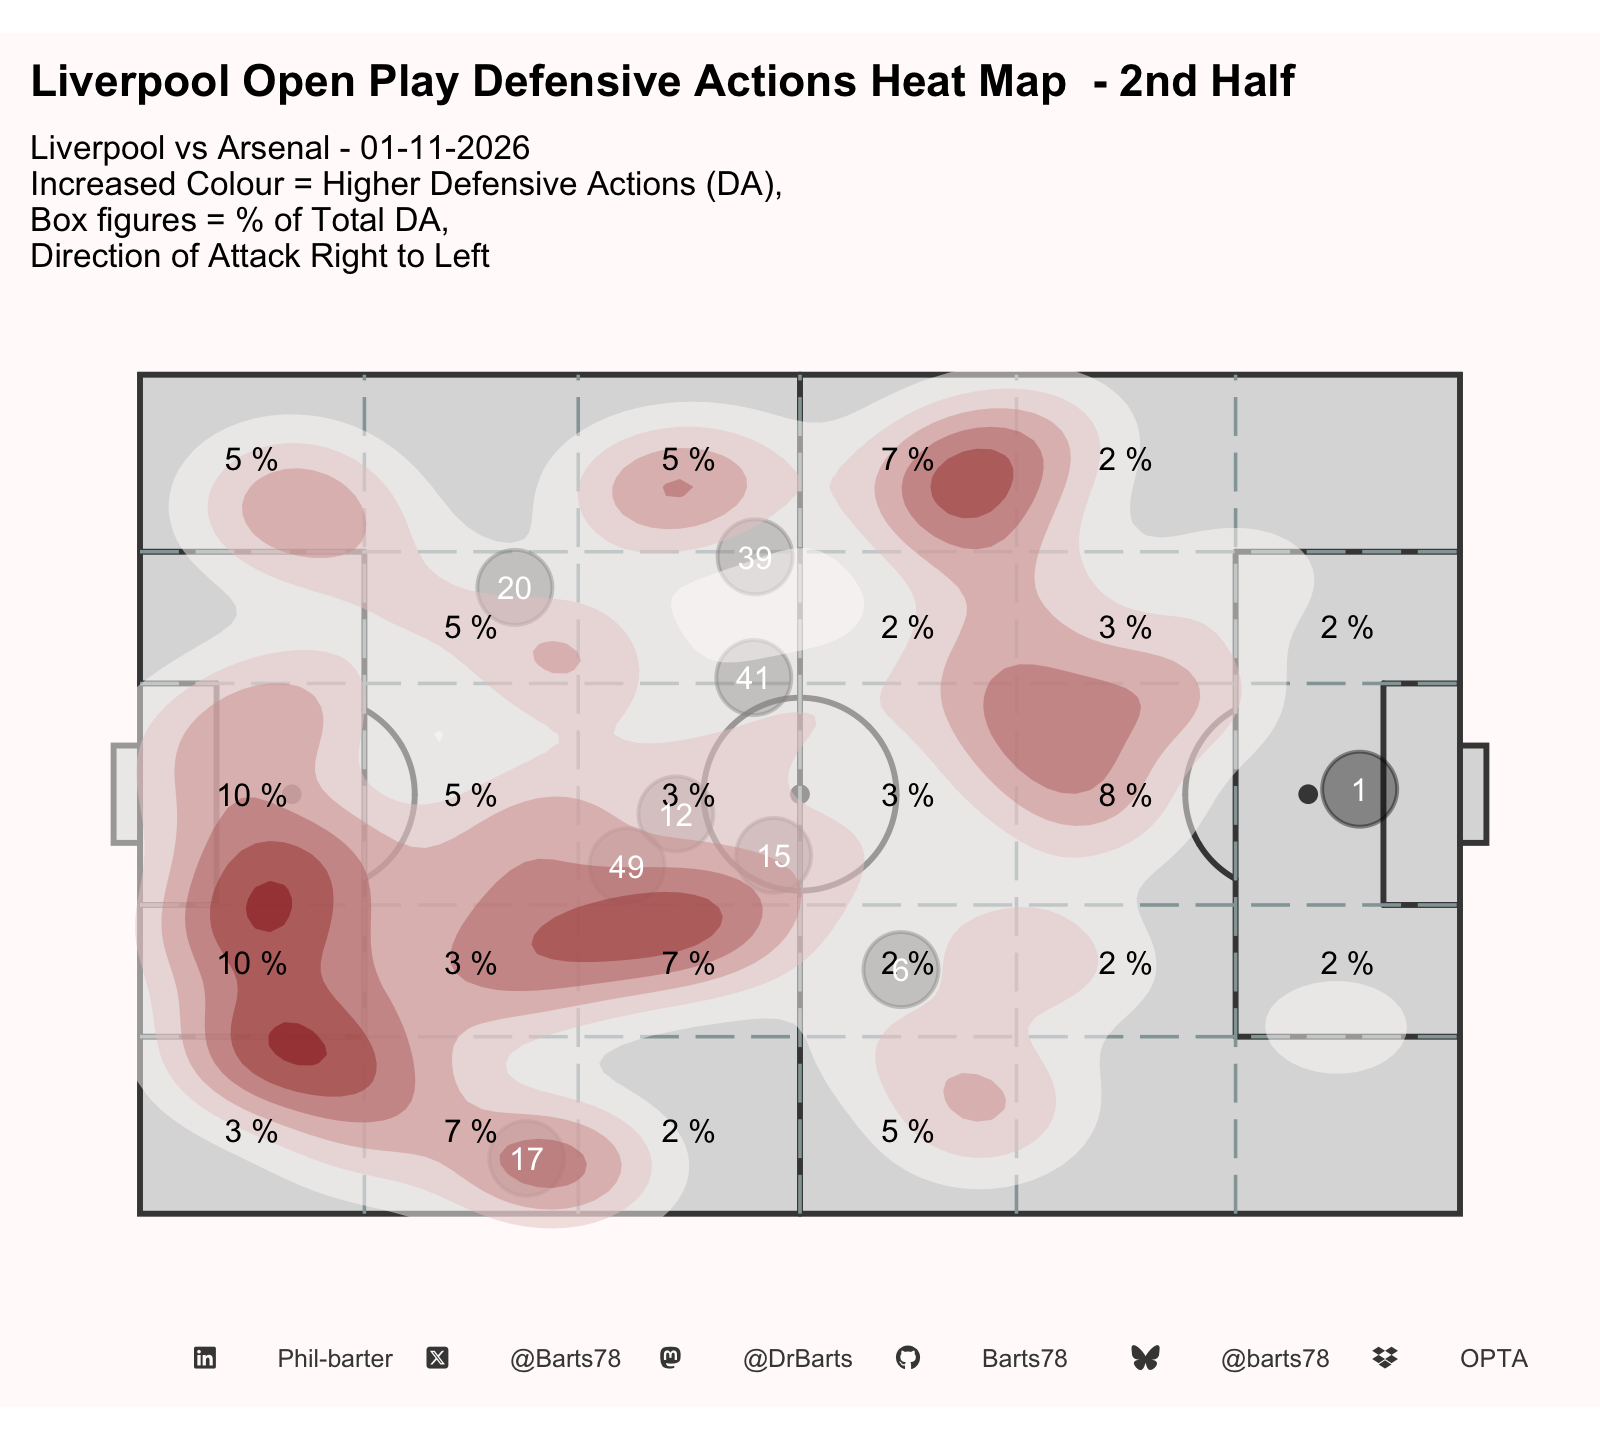
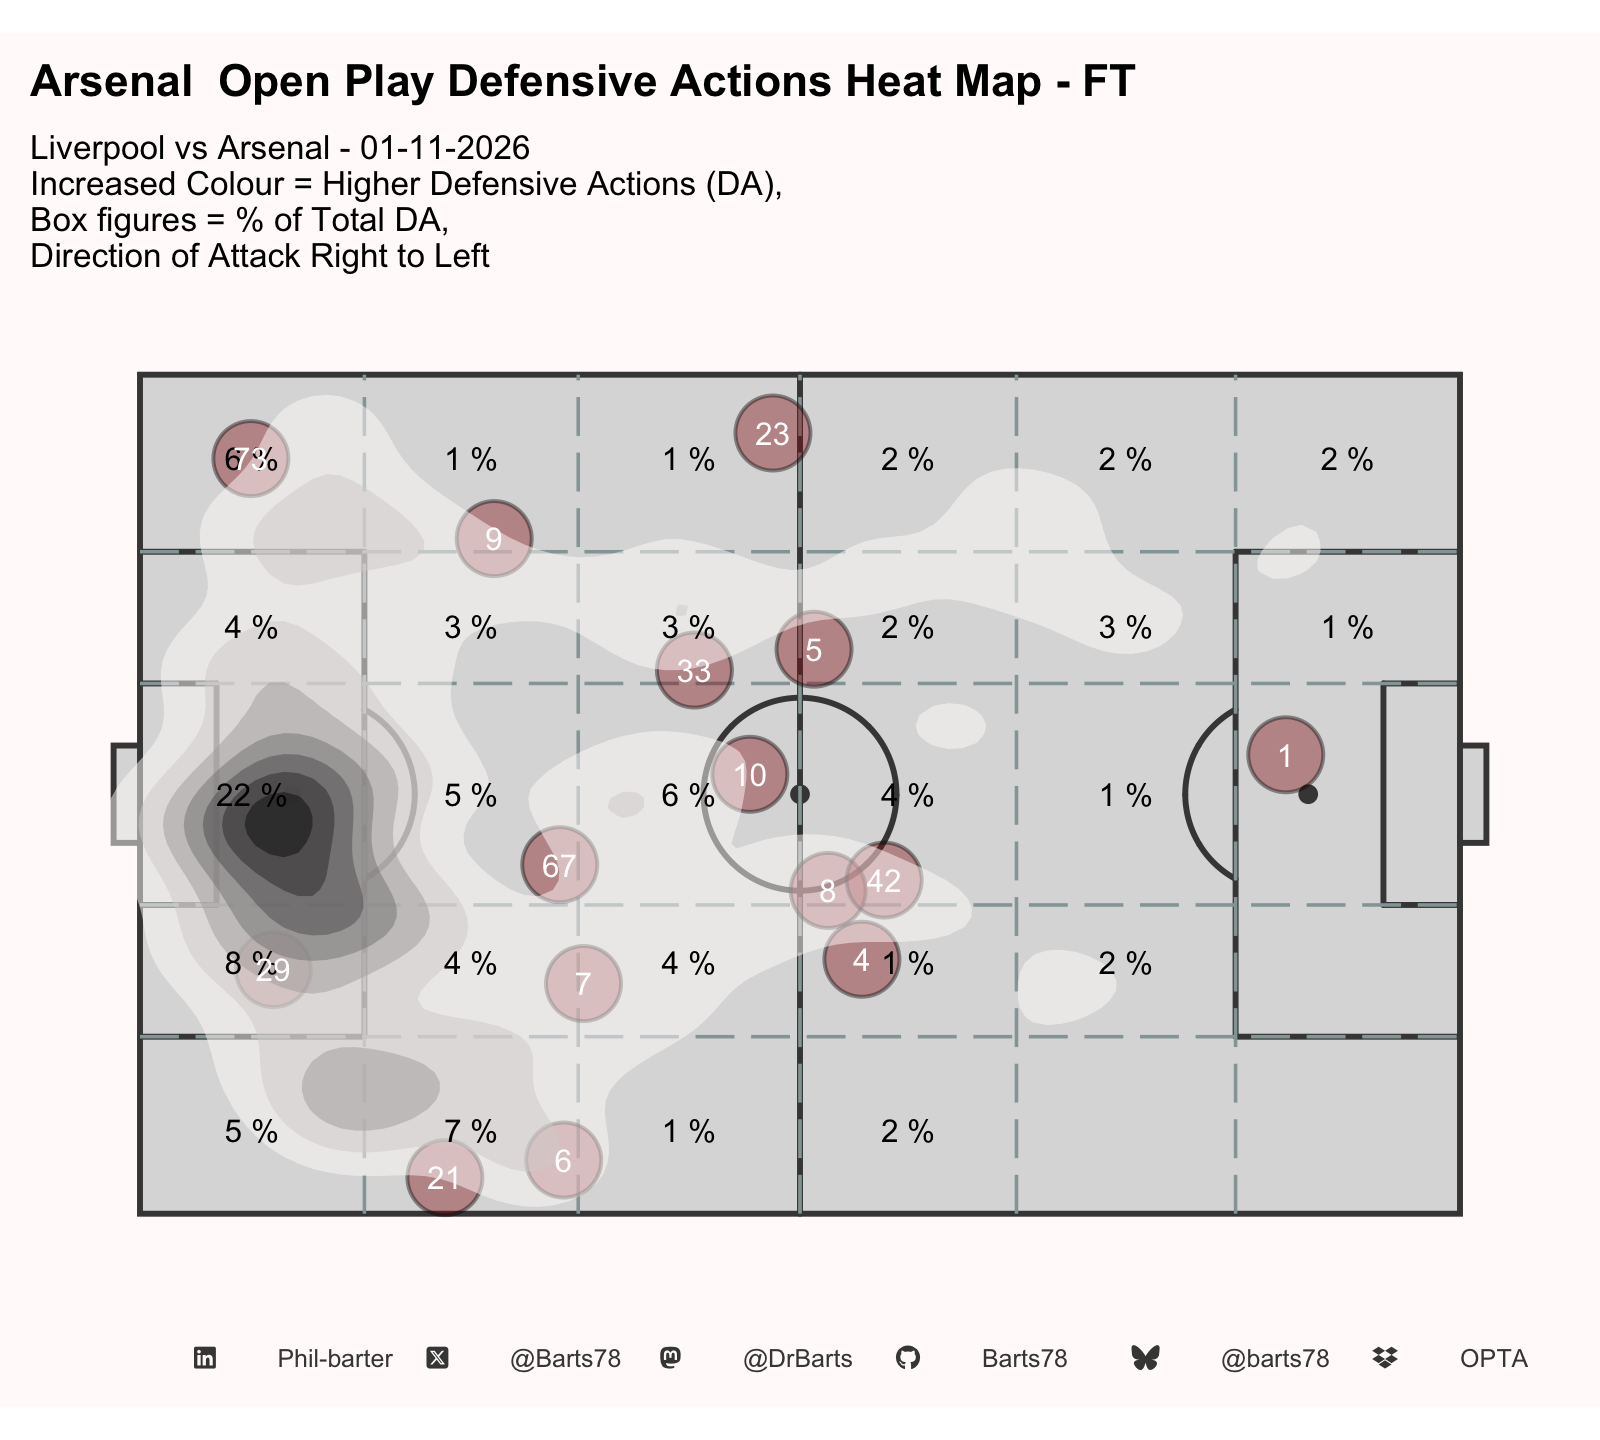
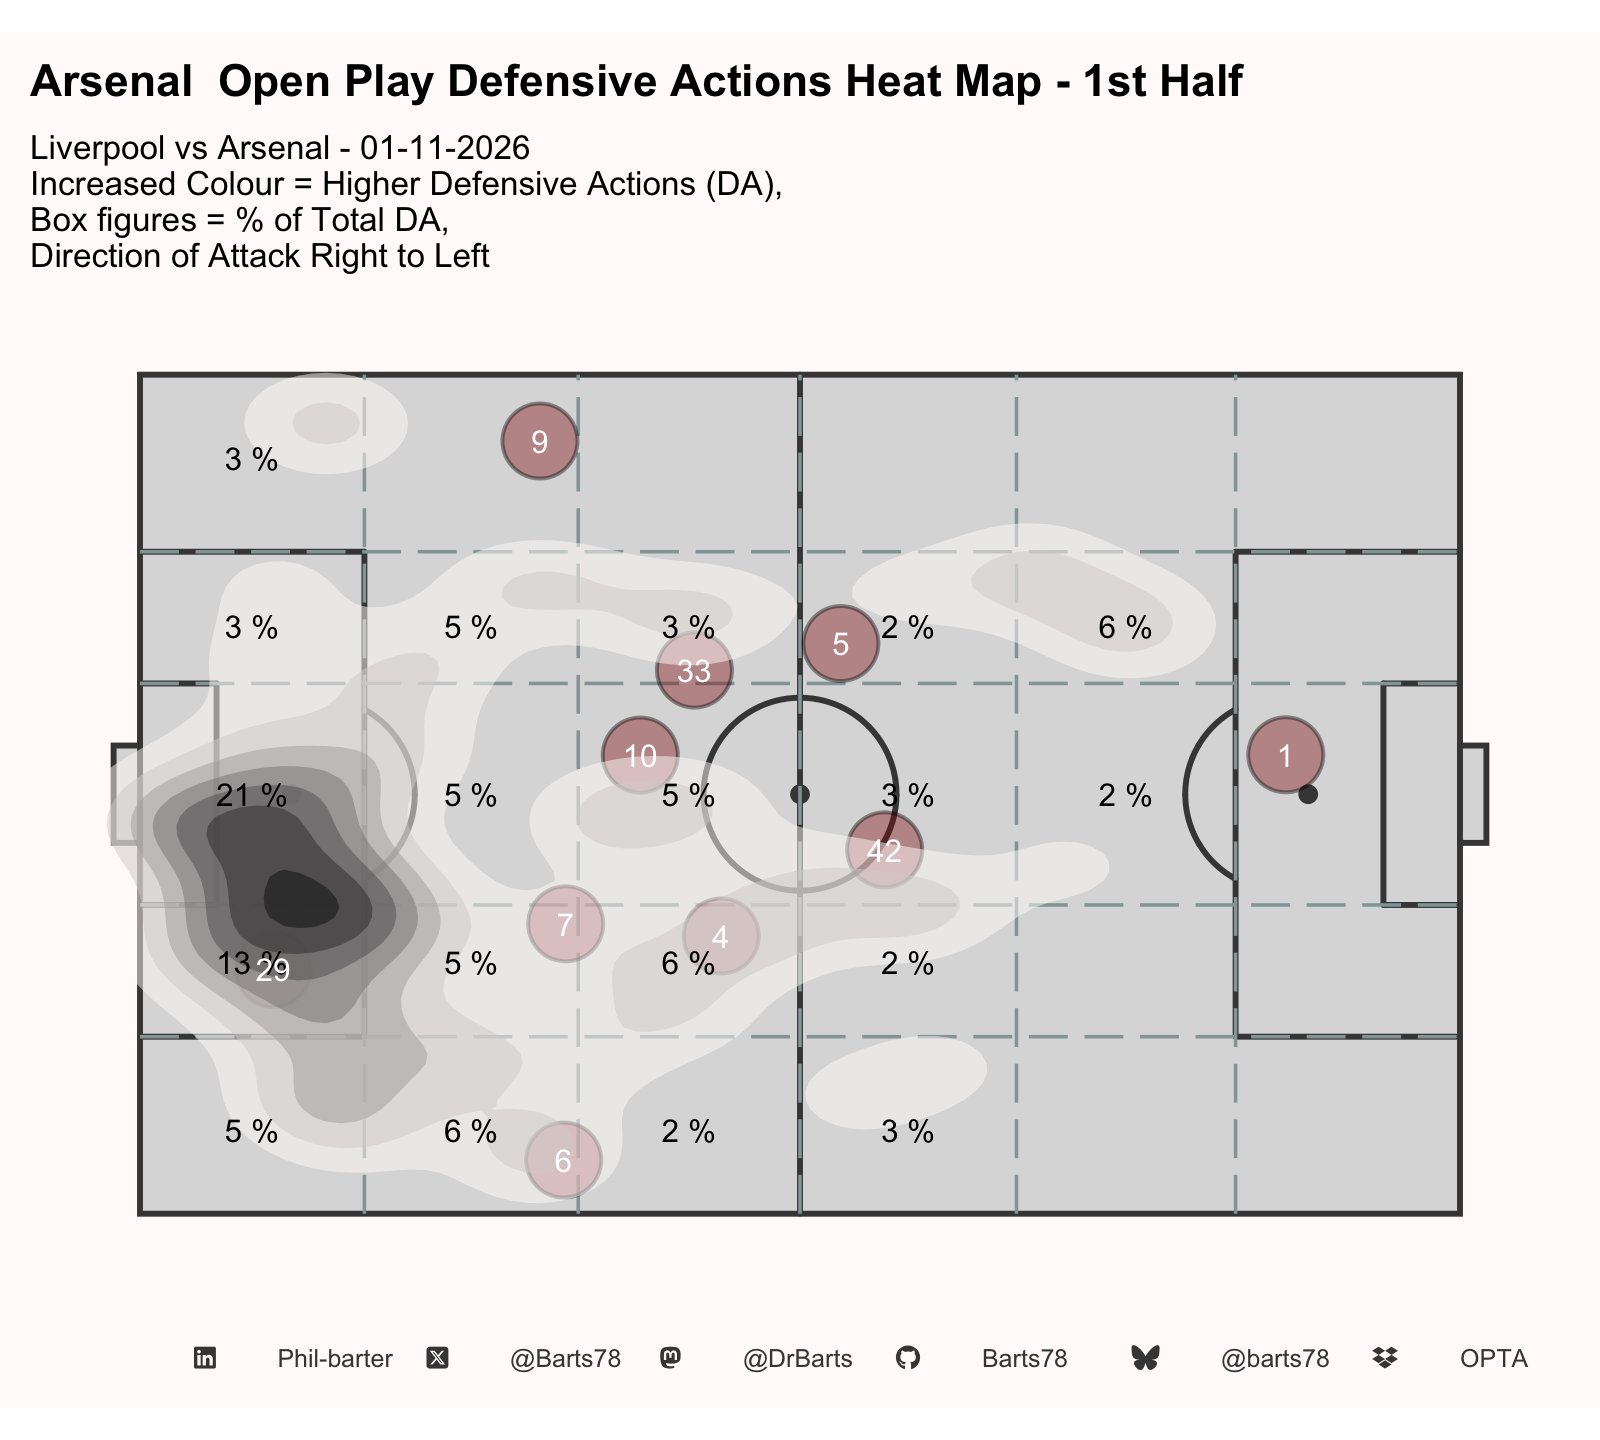
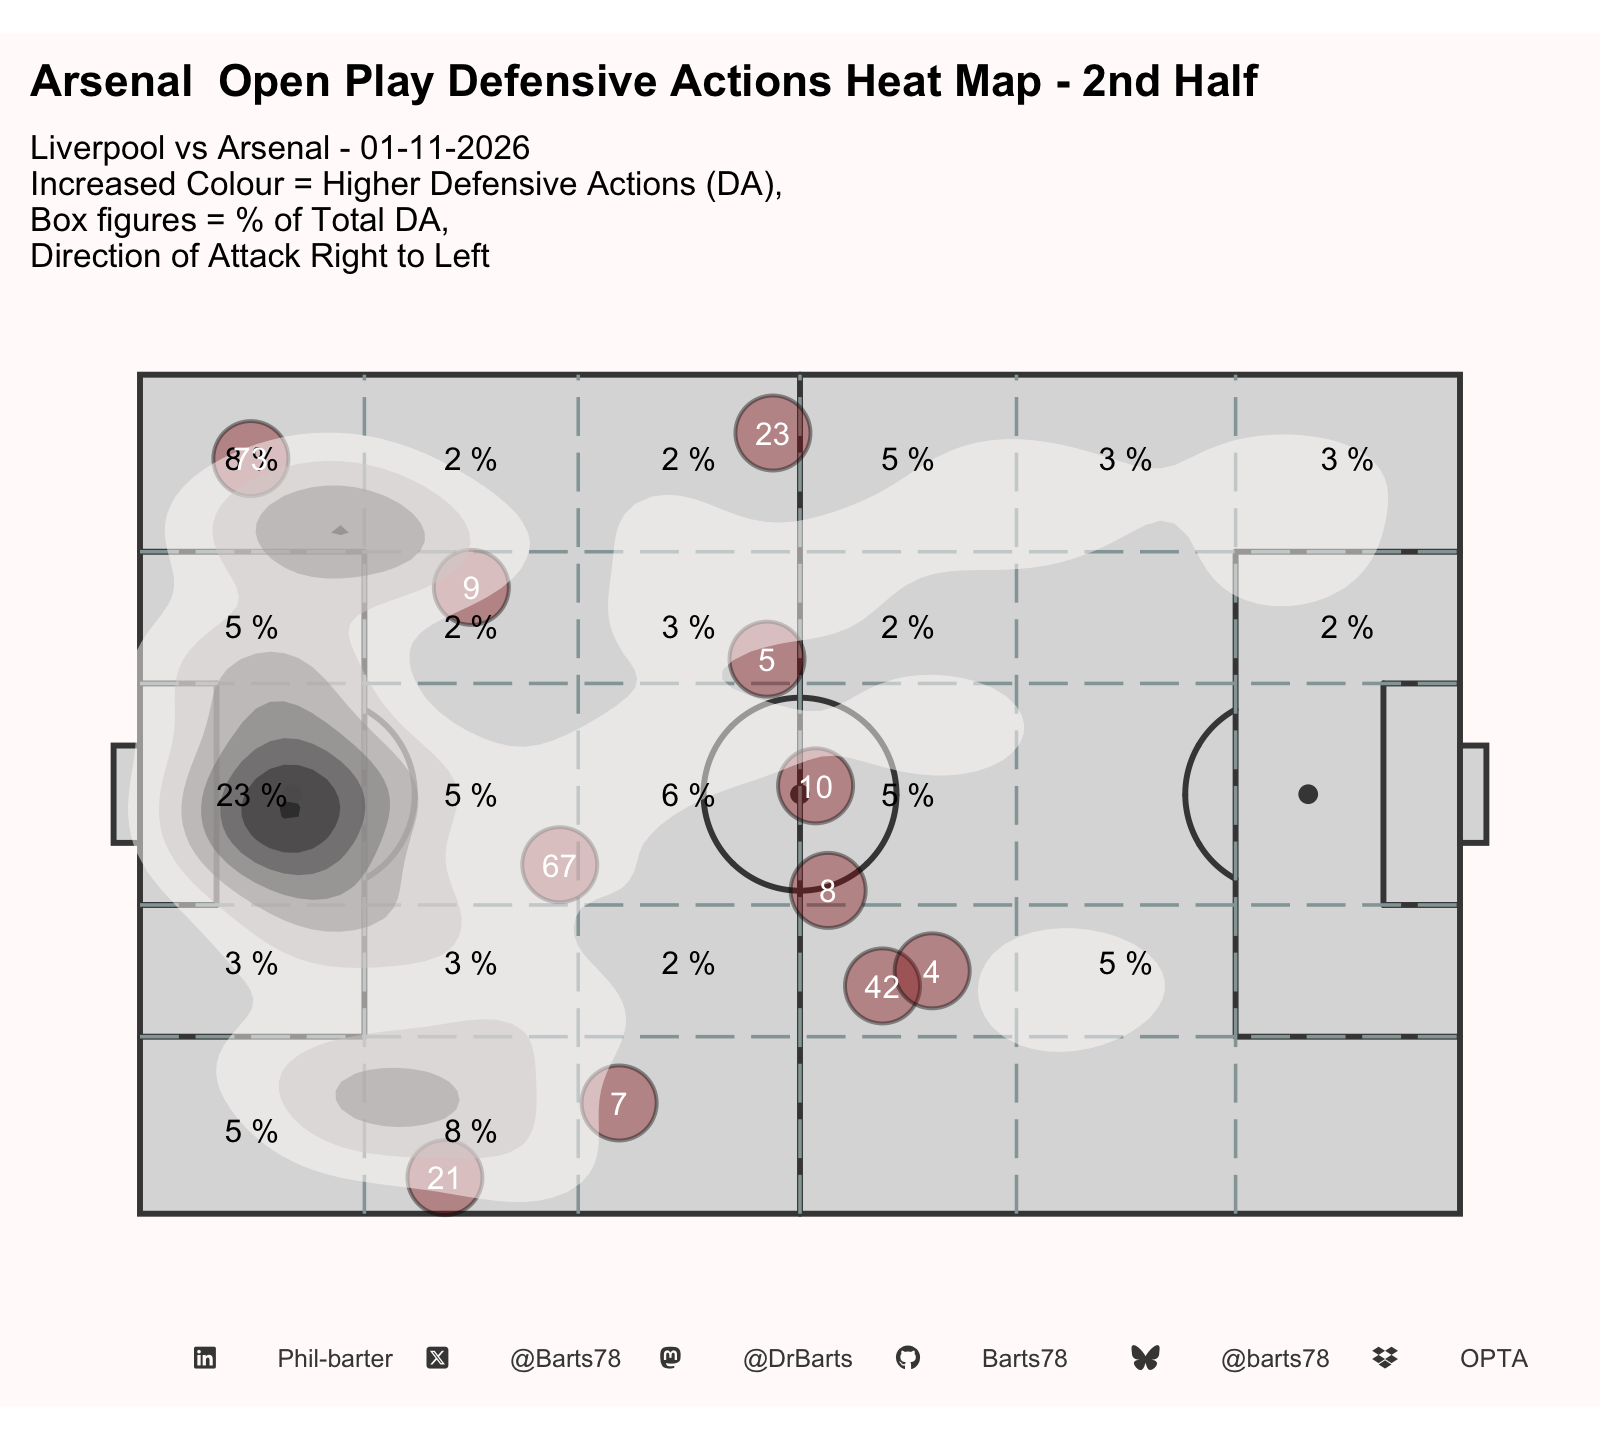
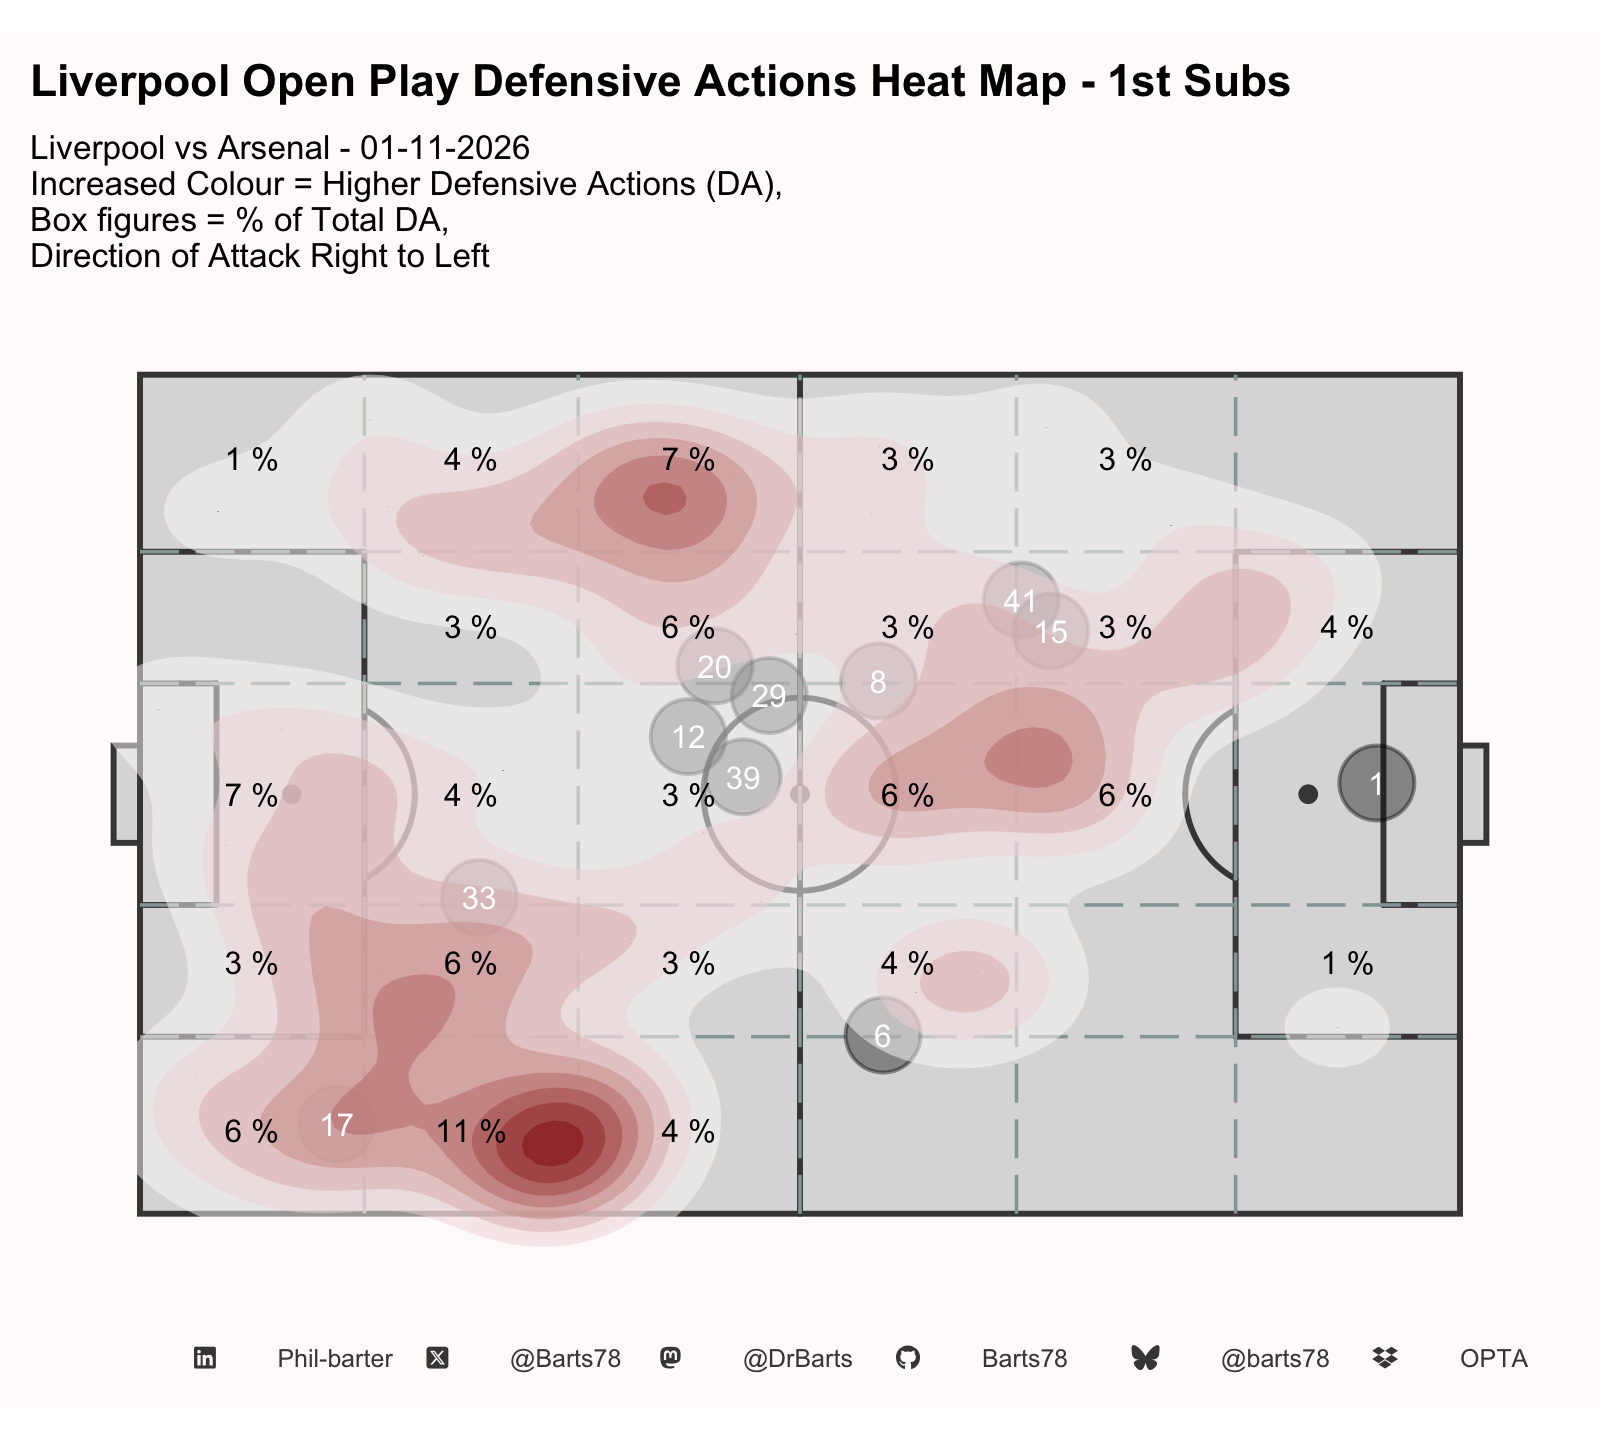
- Arsenal's defensive actions pushed up from an average of 23m to 41.7m from their own goal between the 2nd Quarter and the 3rd Quarter (score 0-1 at the start of the 3rd Quarter), while Liverpool went from 33.7m to 49.8m over the 1st Quarter to 2nd Quarter. Standard PPDA: Liverpool 8.38, Arsenal 12.24 (lower = more pressing).
- Liverpool strung together 8 moves of 10+ completed passes (33% of their completed passes came in those moves, 2 ended in a shot). Their longest move was 24 passes (31').
- Arsenal strung together 6 moves of 10+ completed passes (23% of their completed passes came in those moves, 2 ended in a shot). Their longest move was 14 passes (45') and ended in a shot.
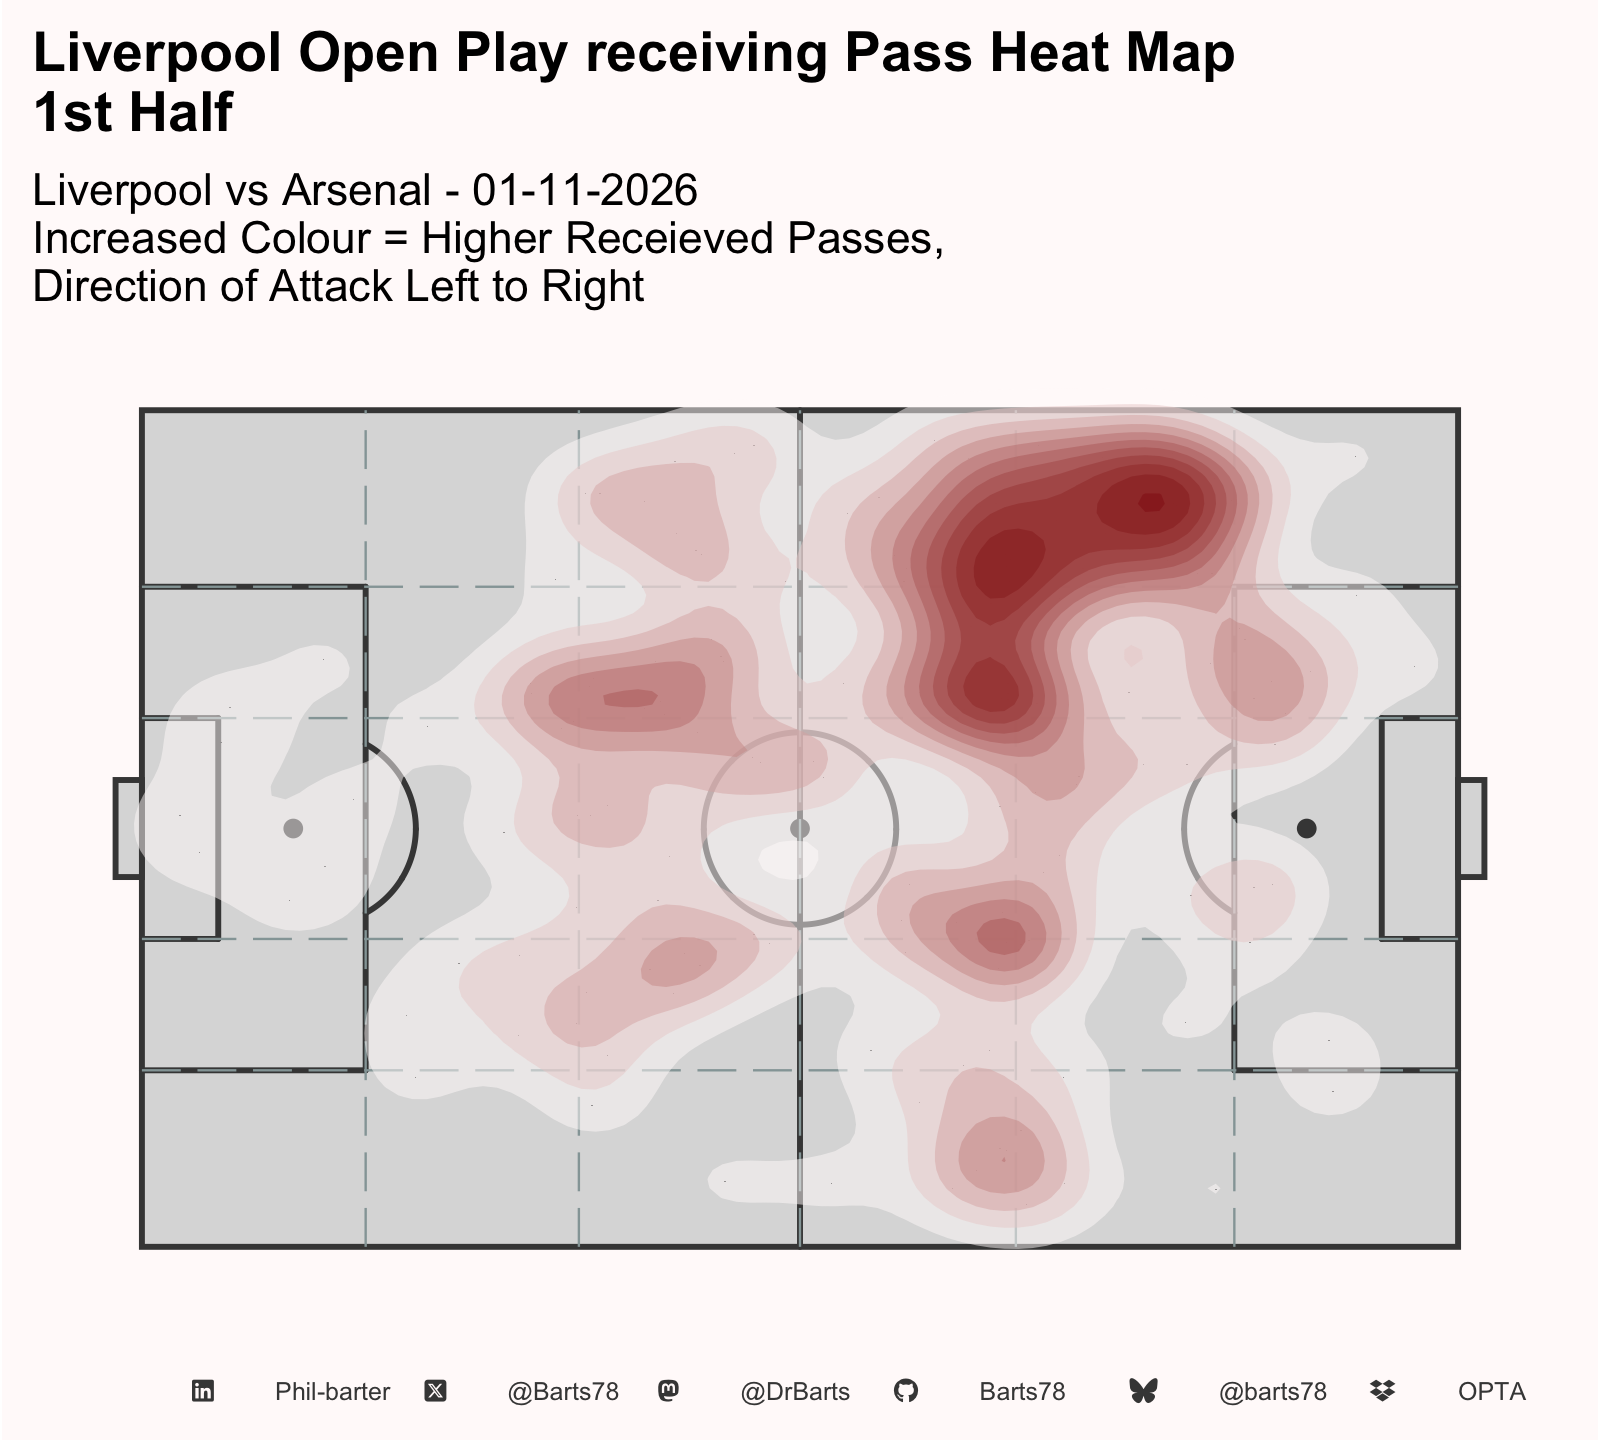
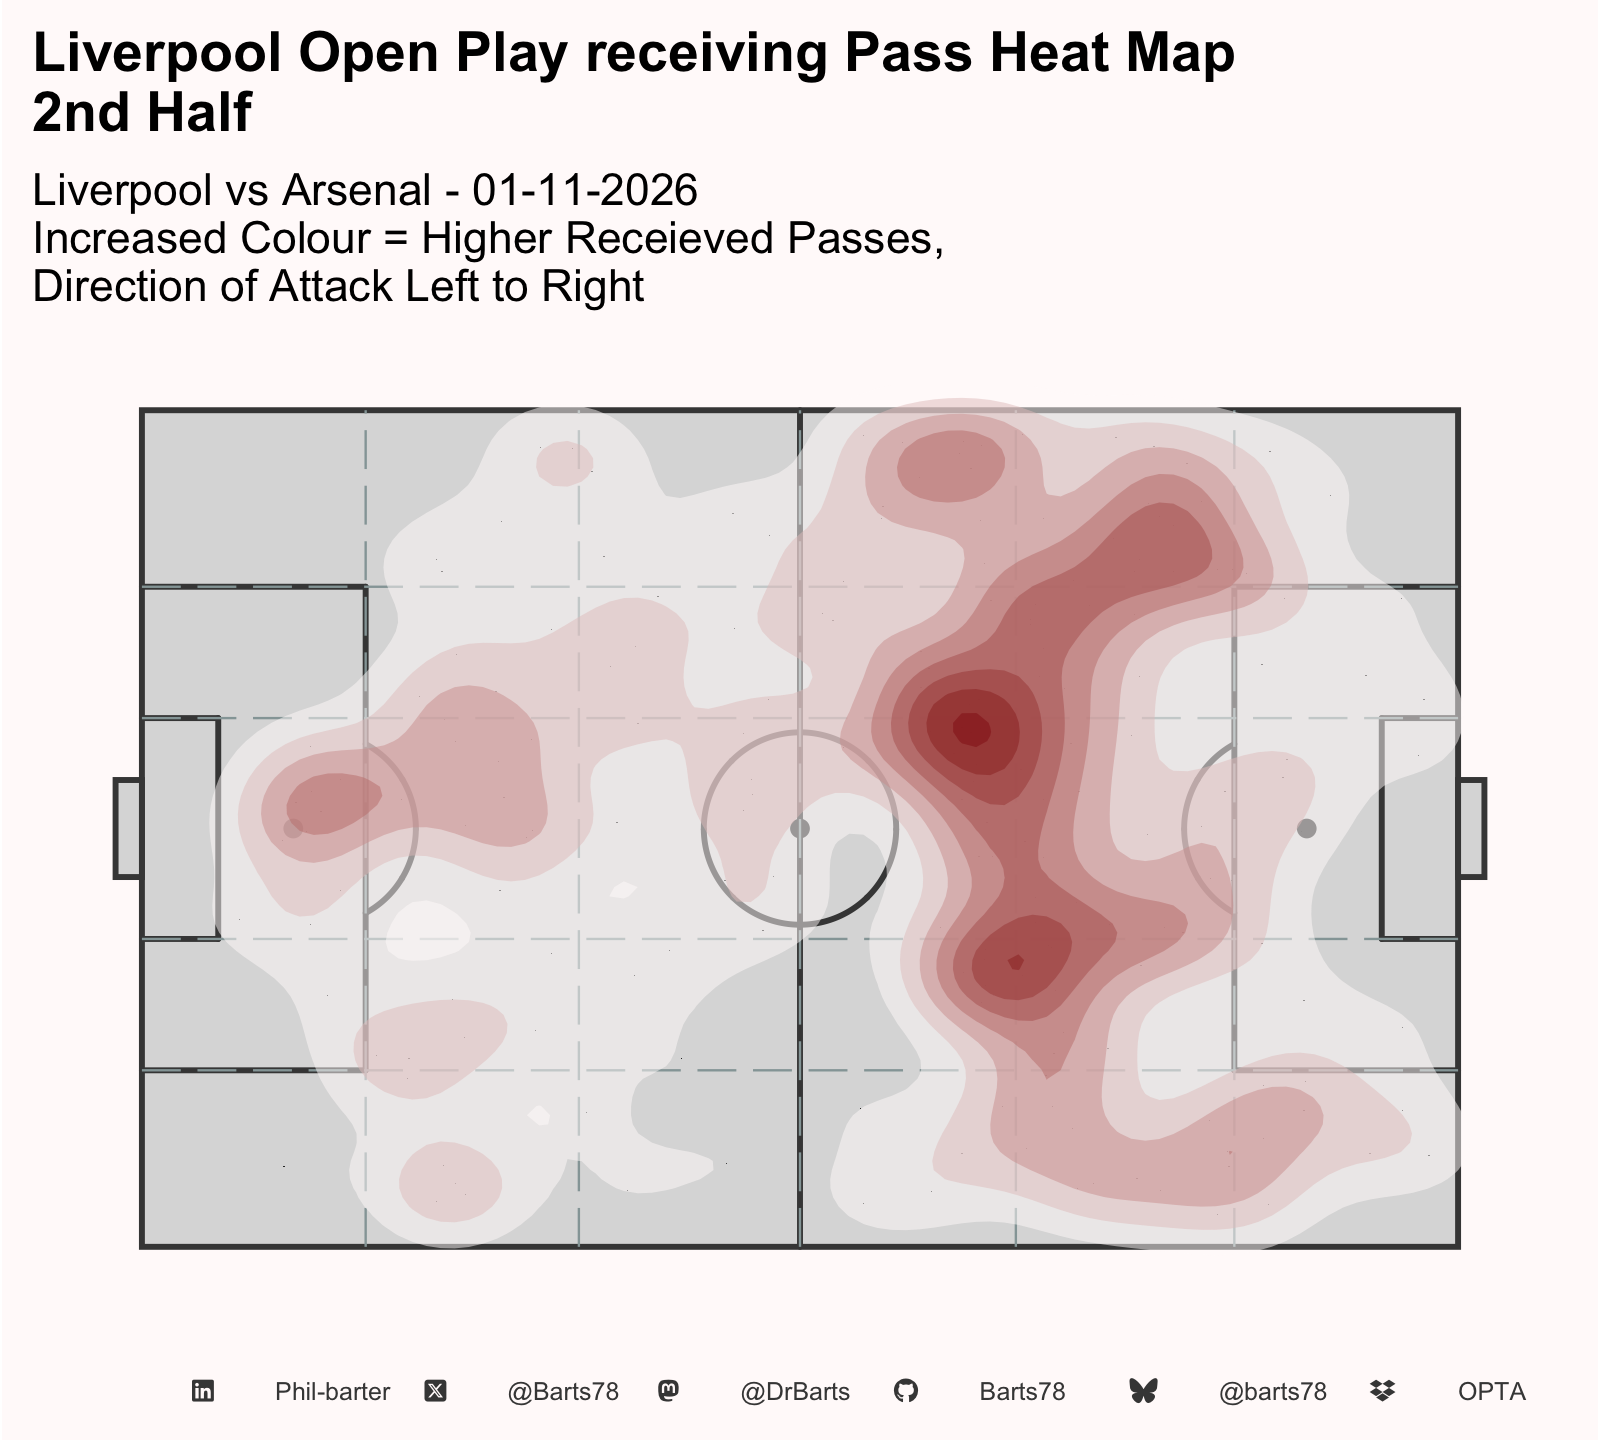
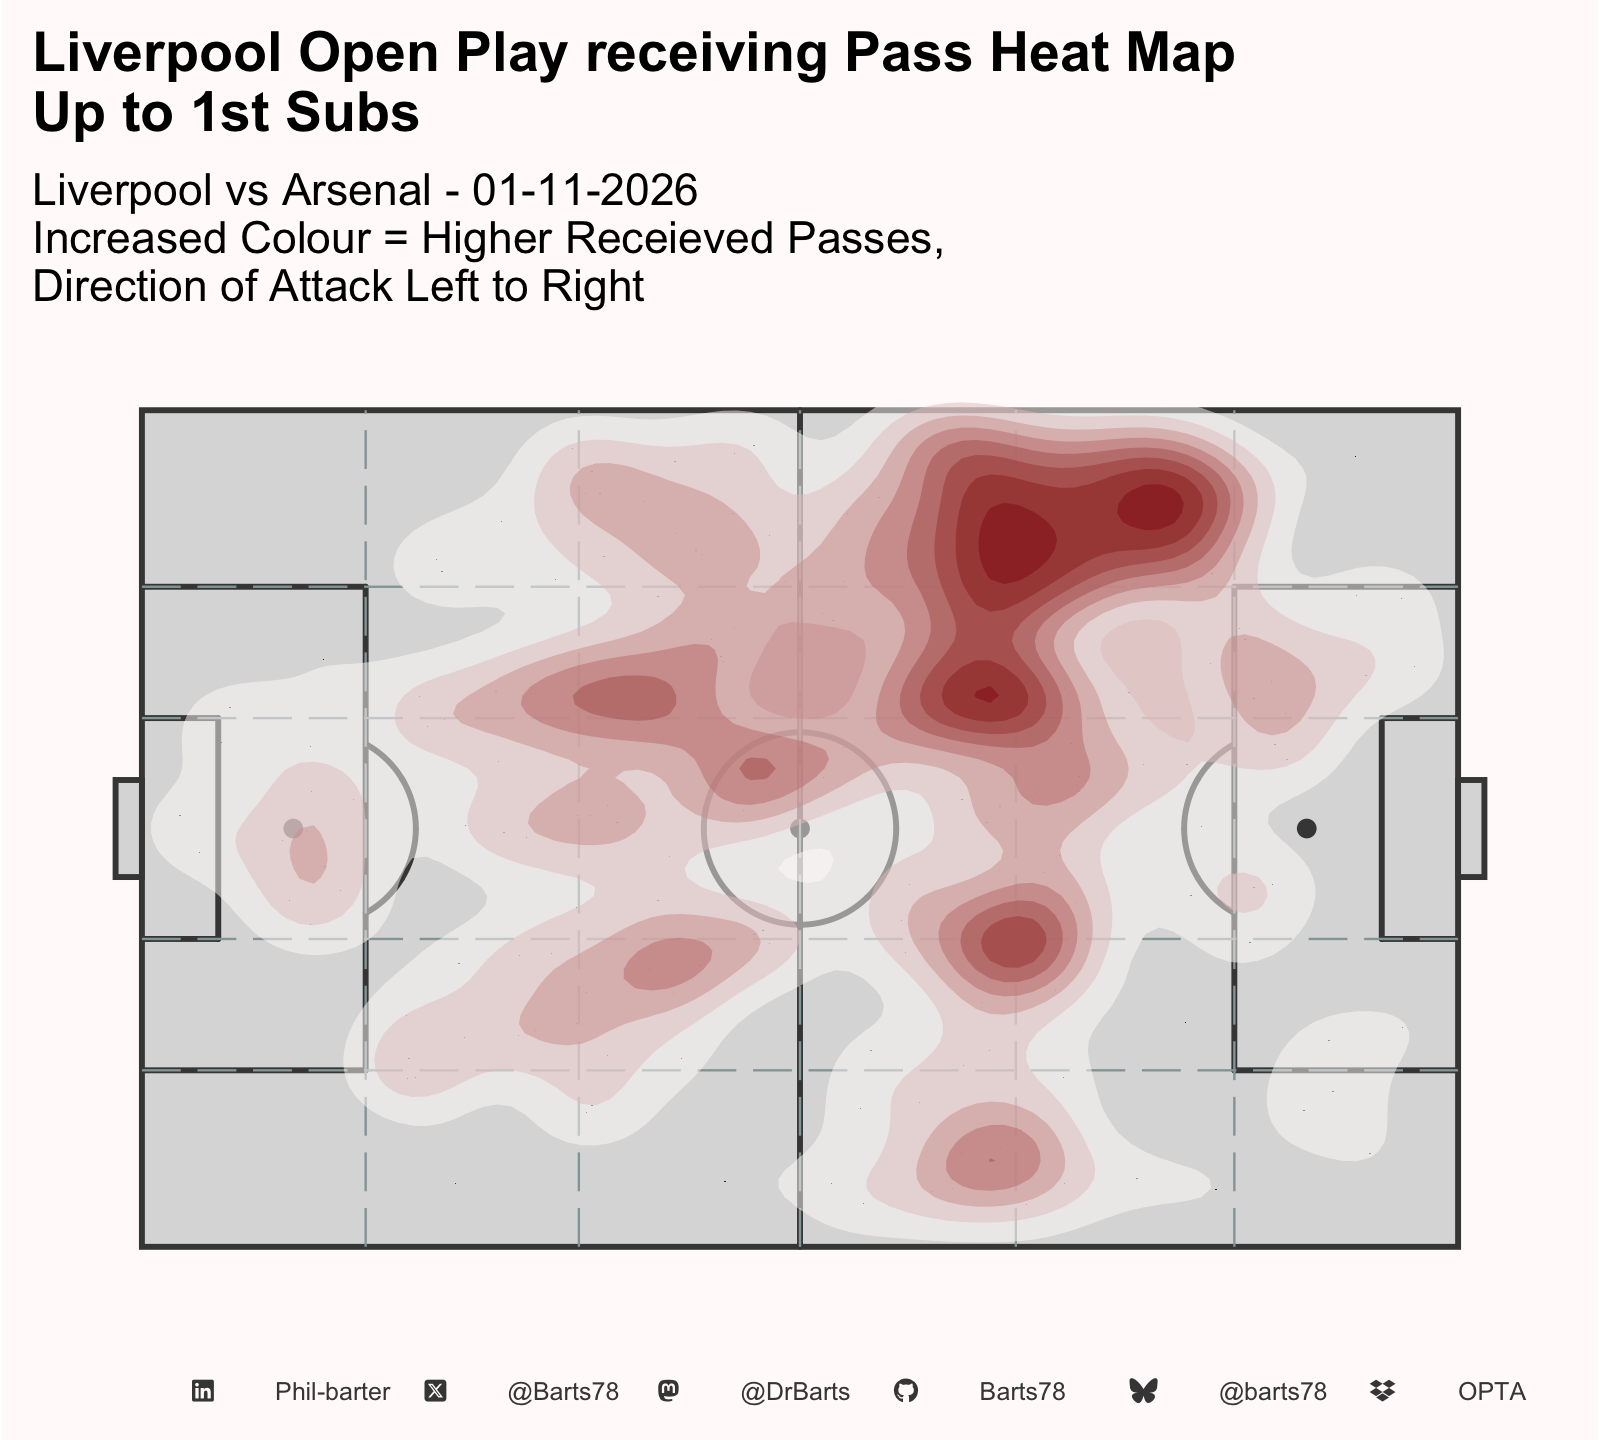
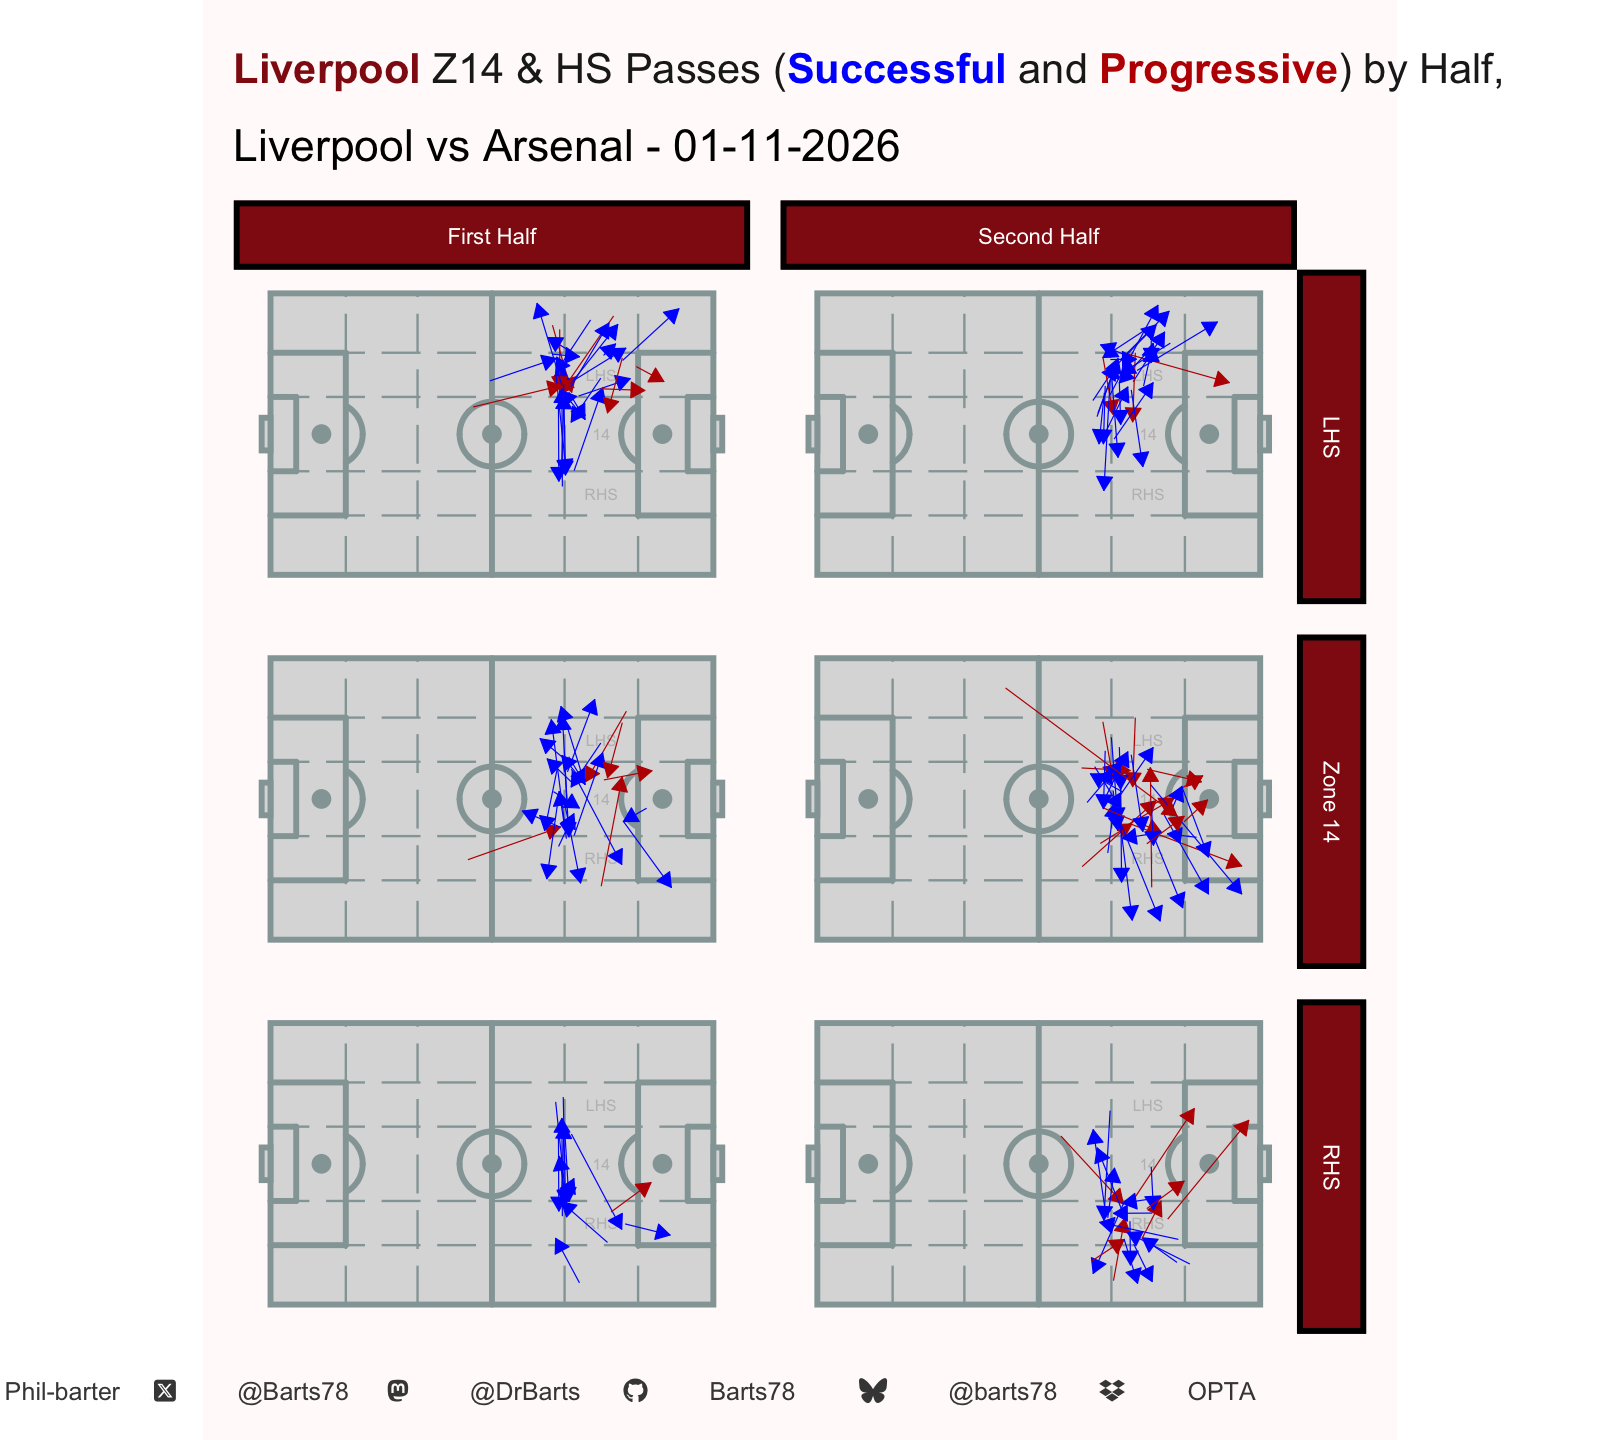
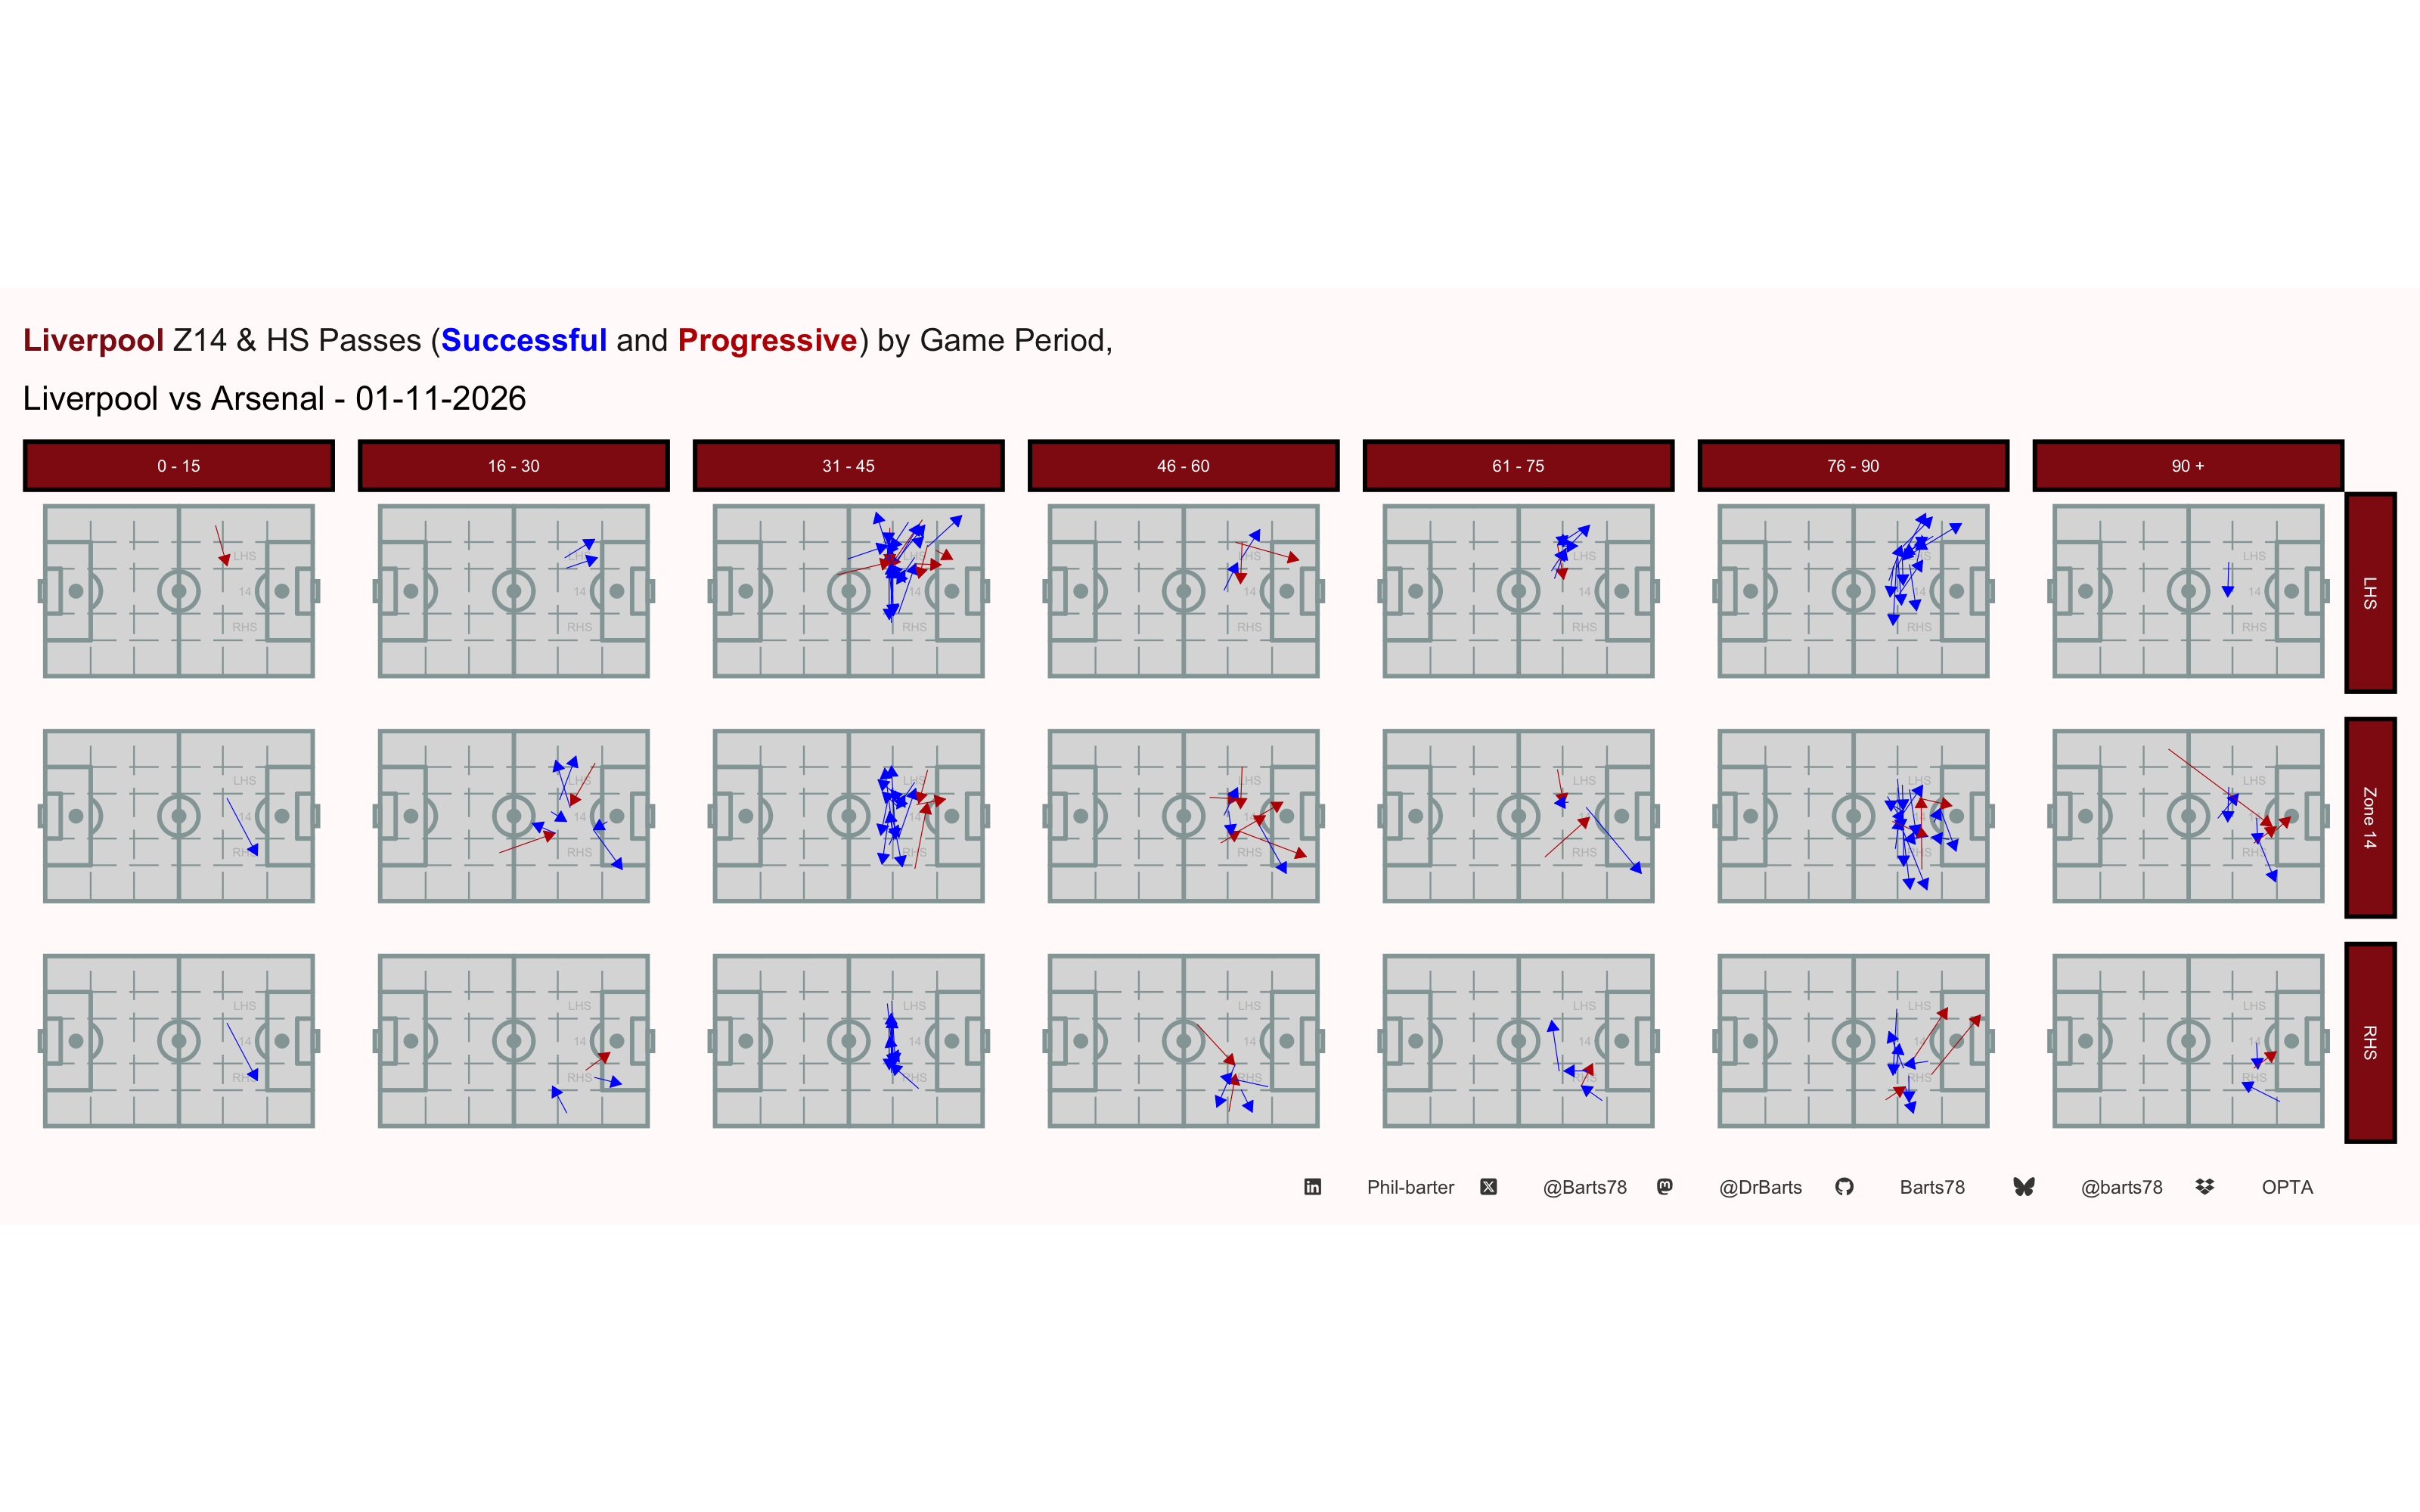
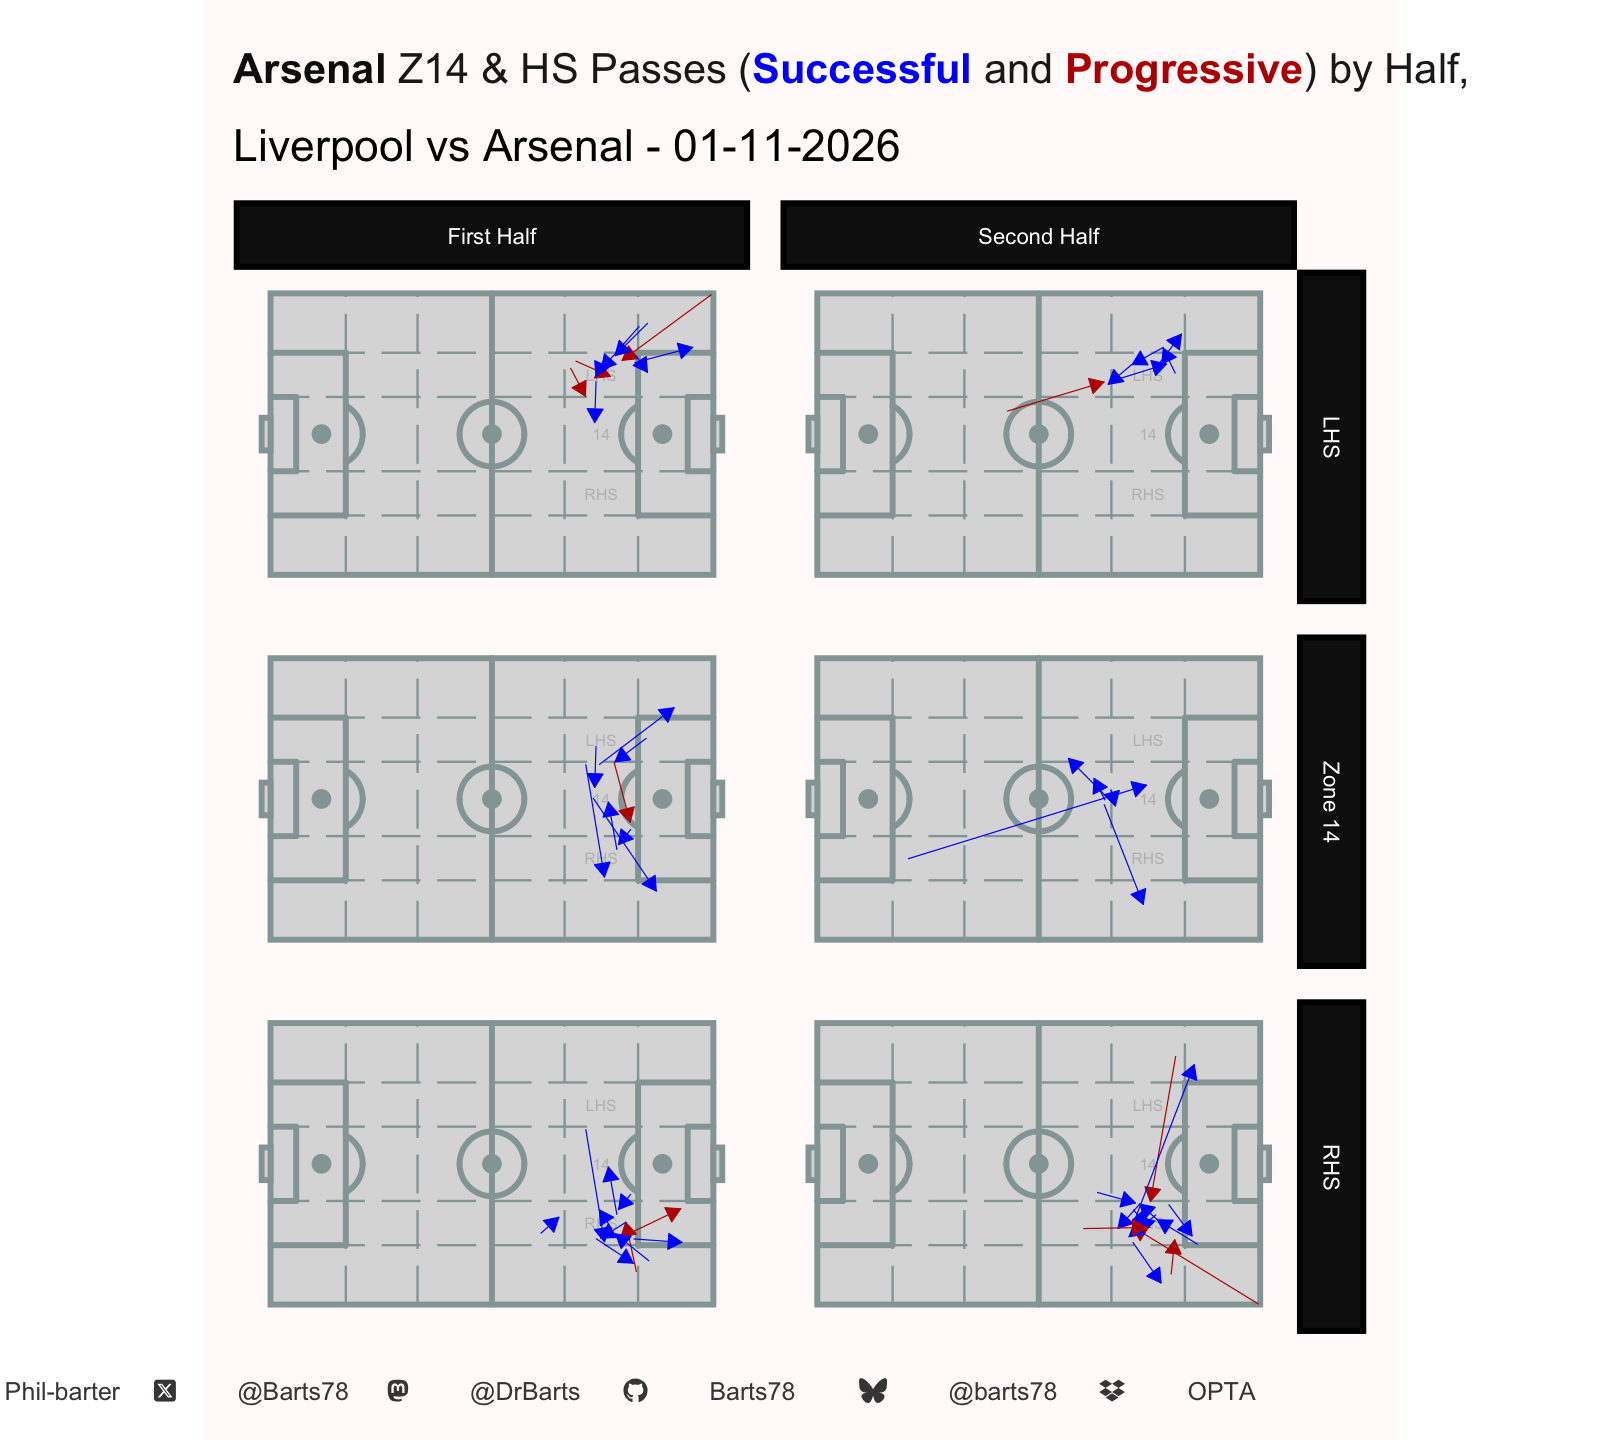
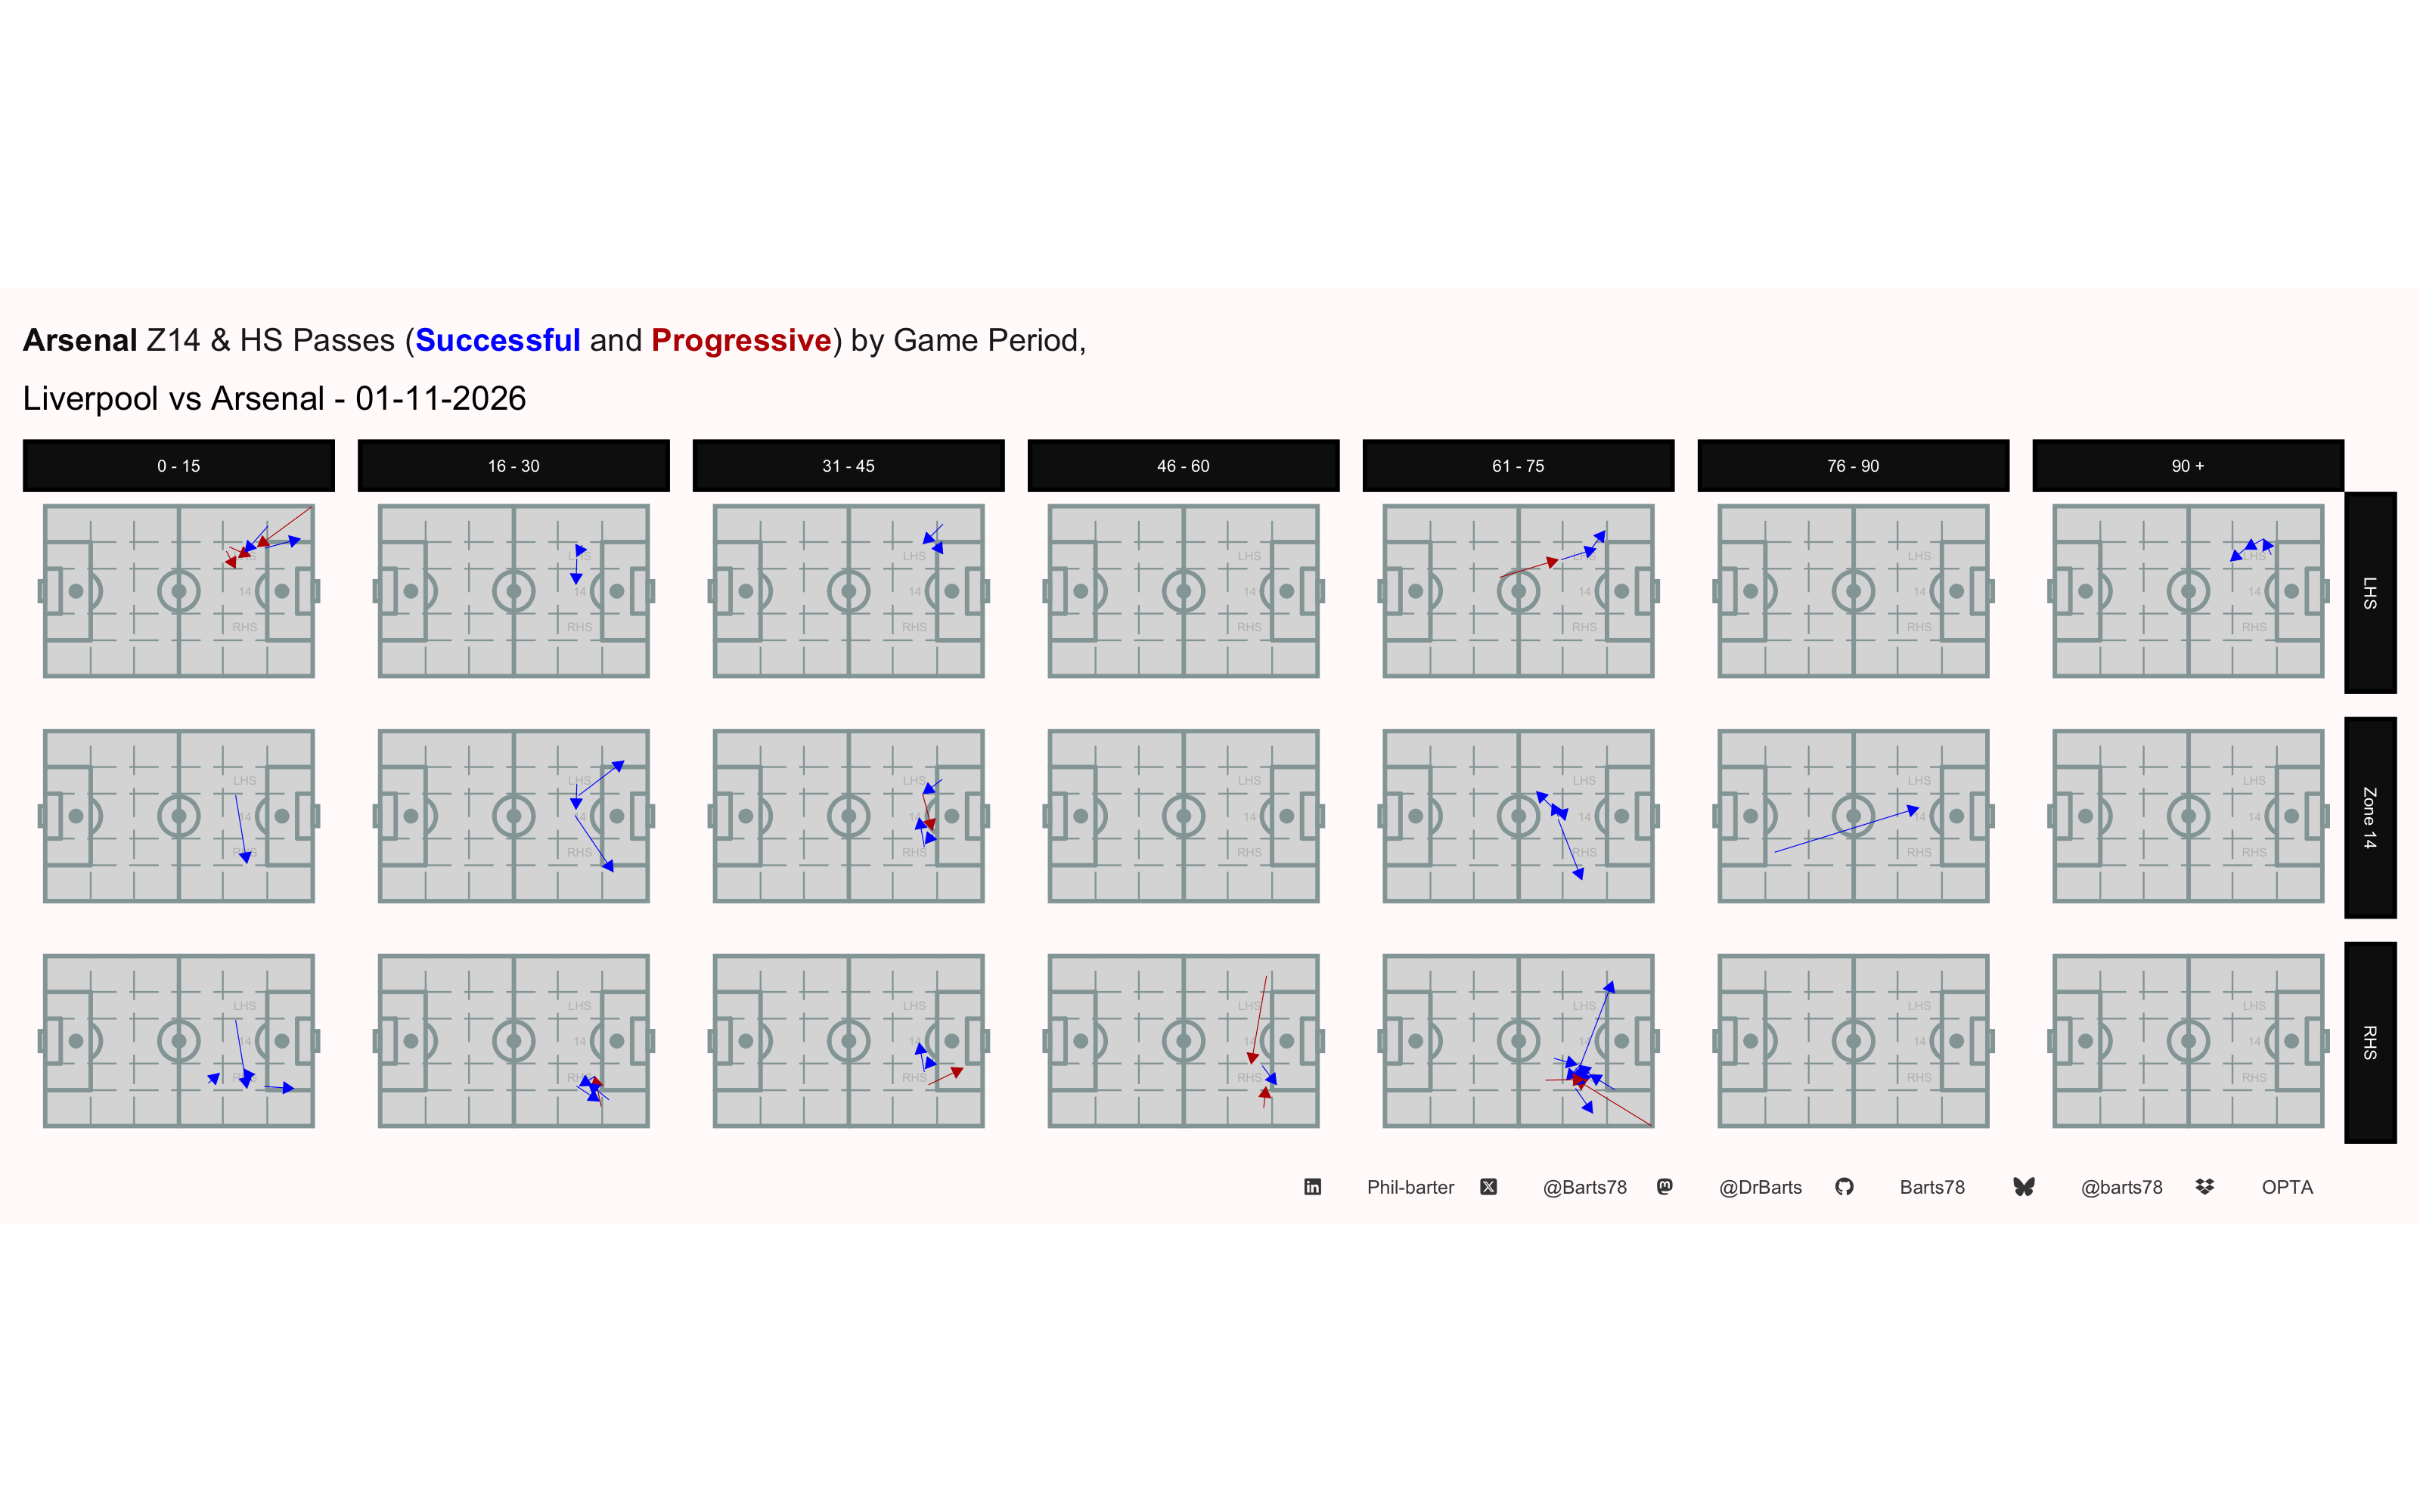
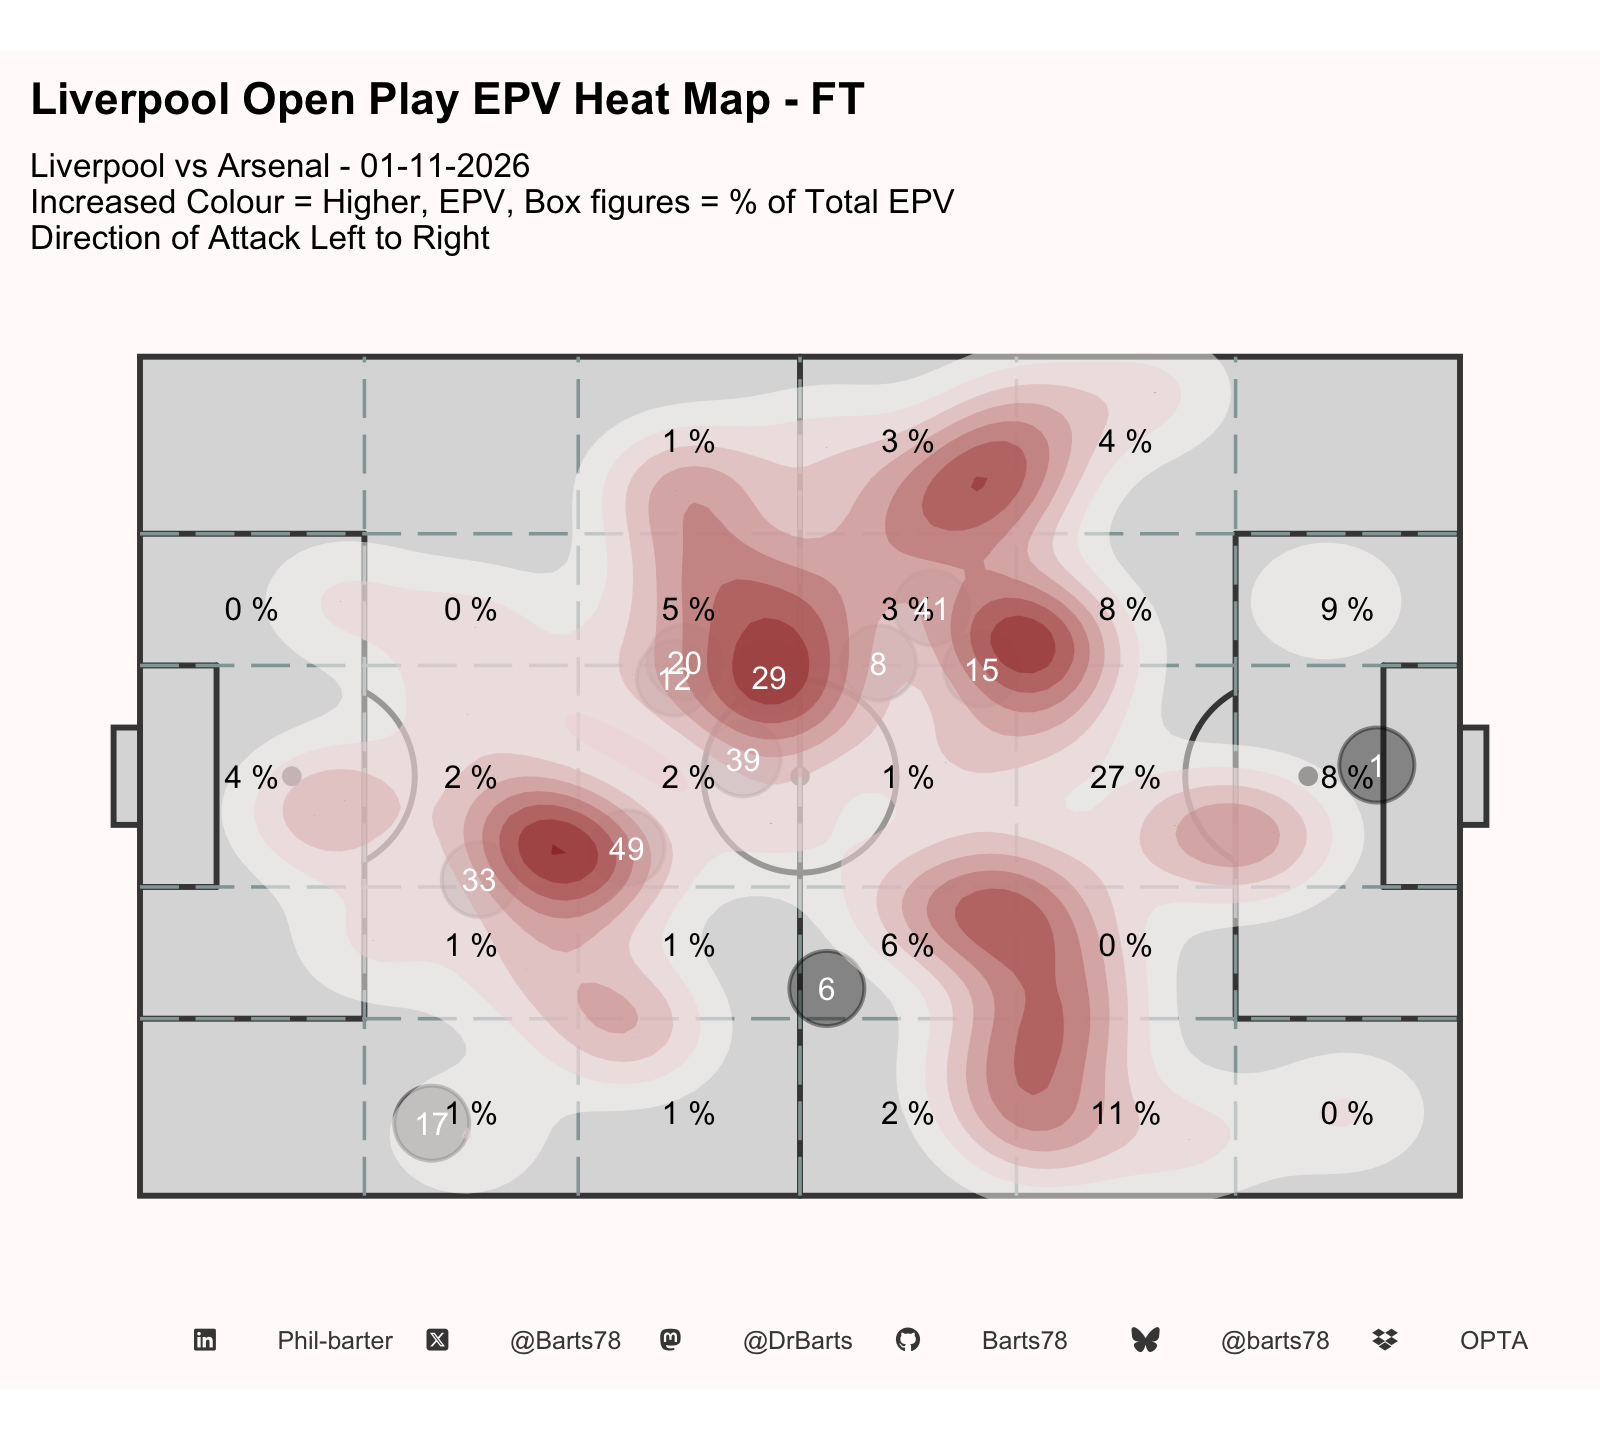
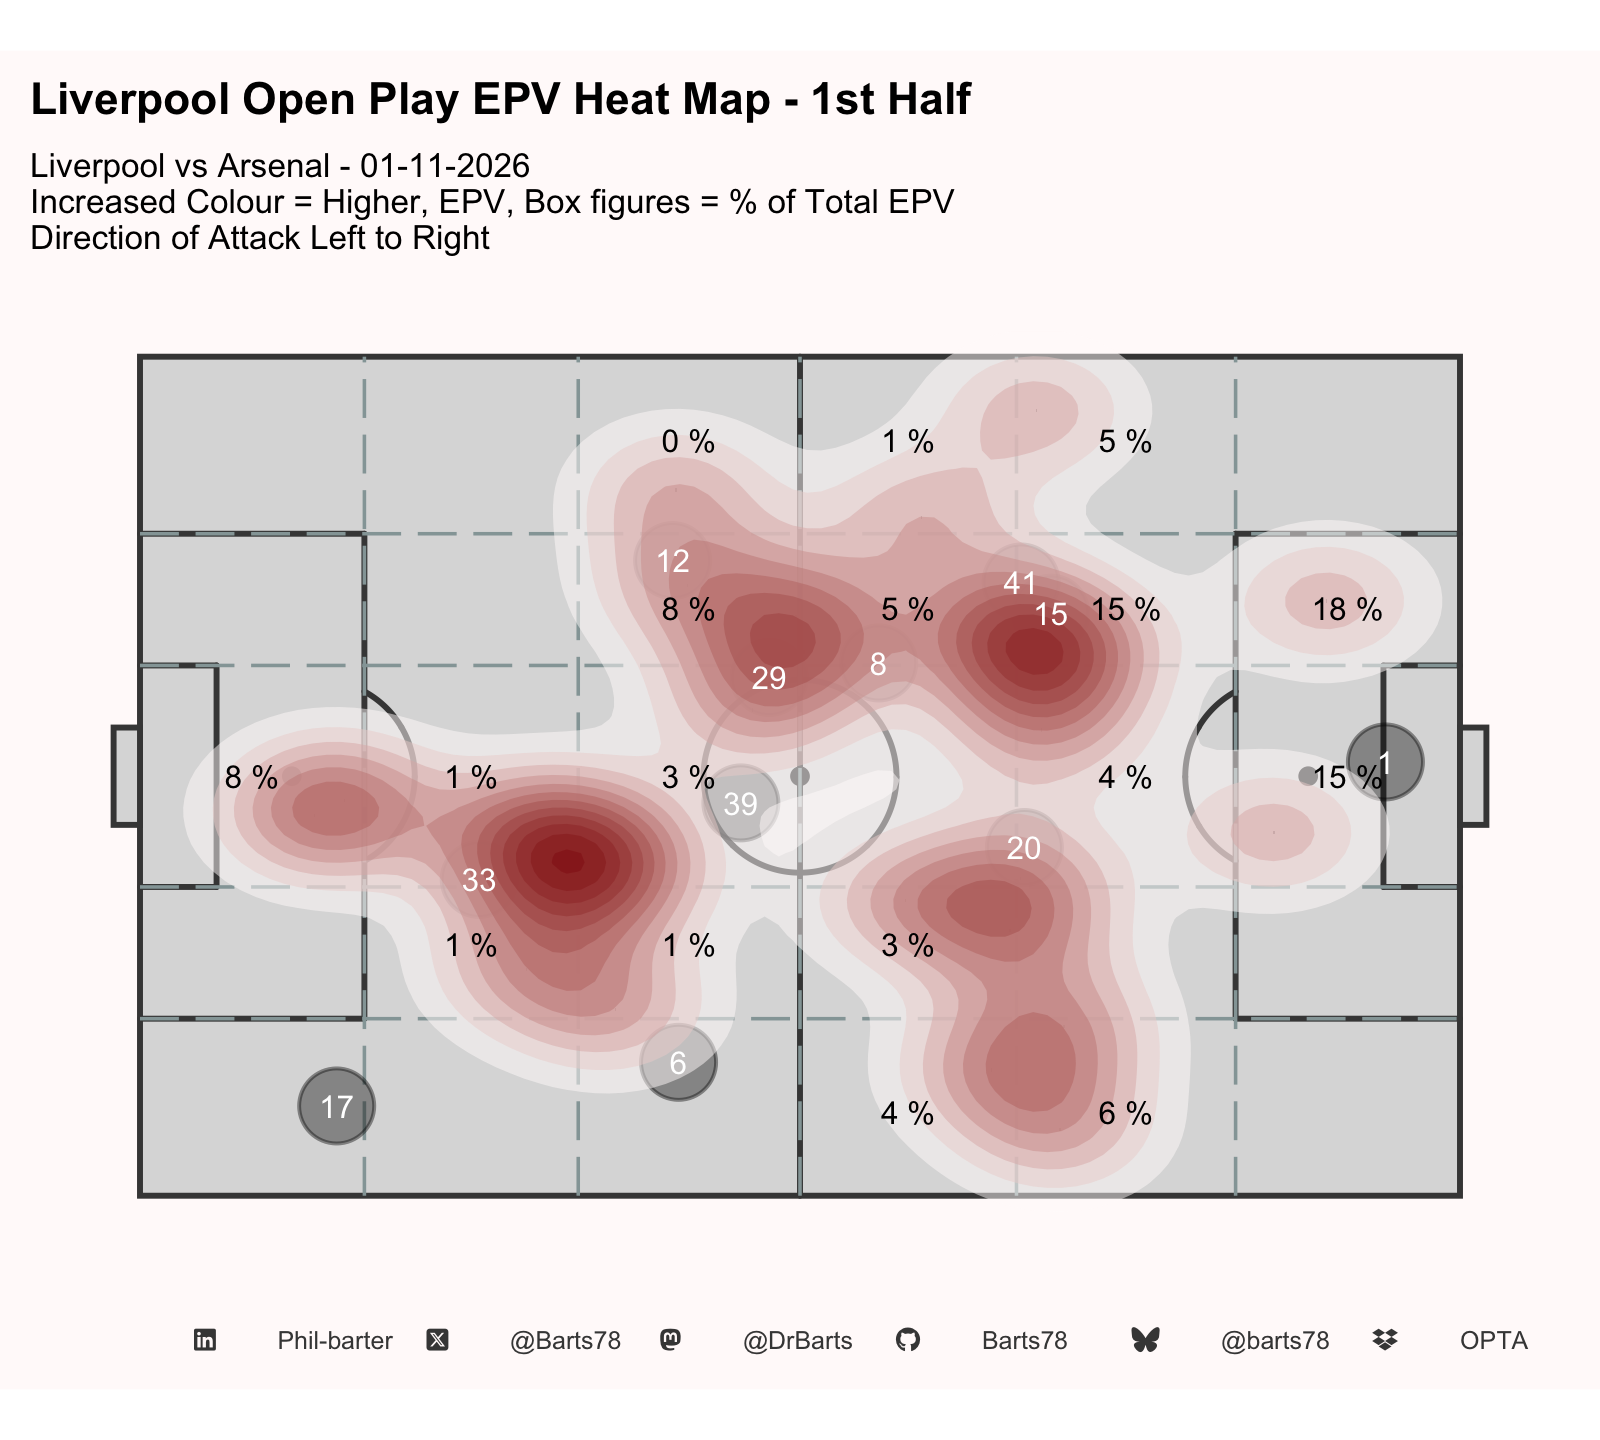
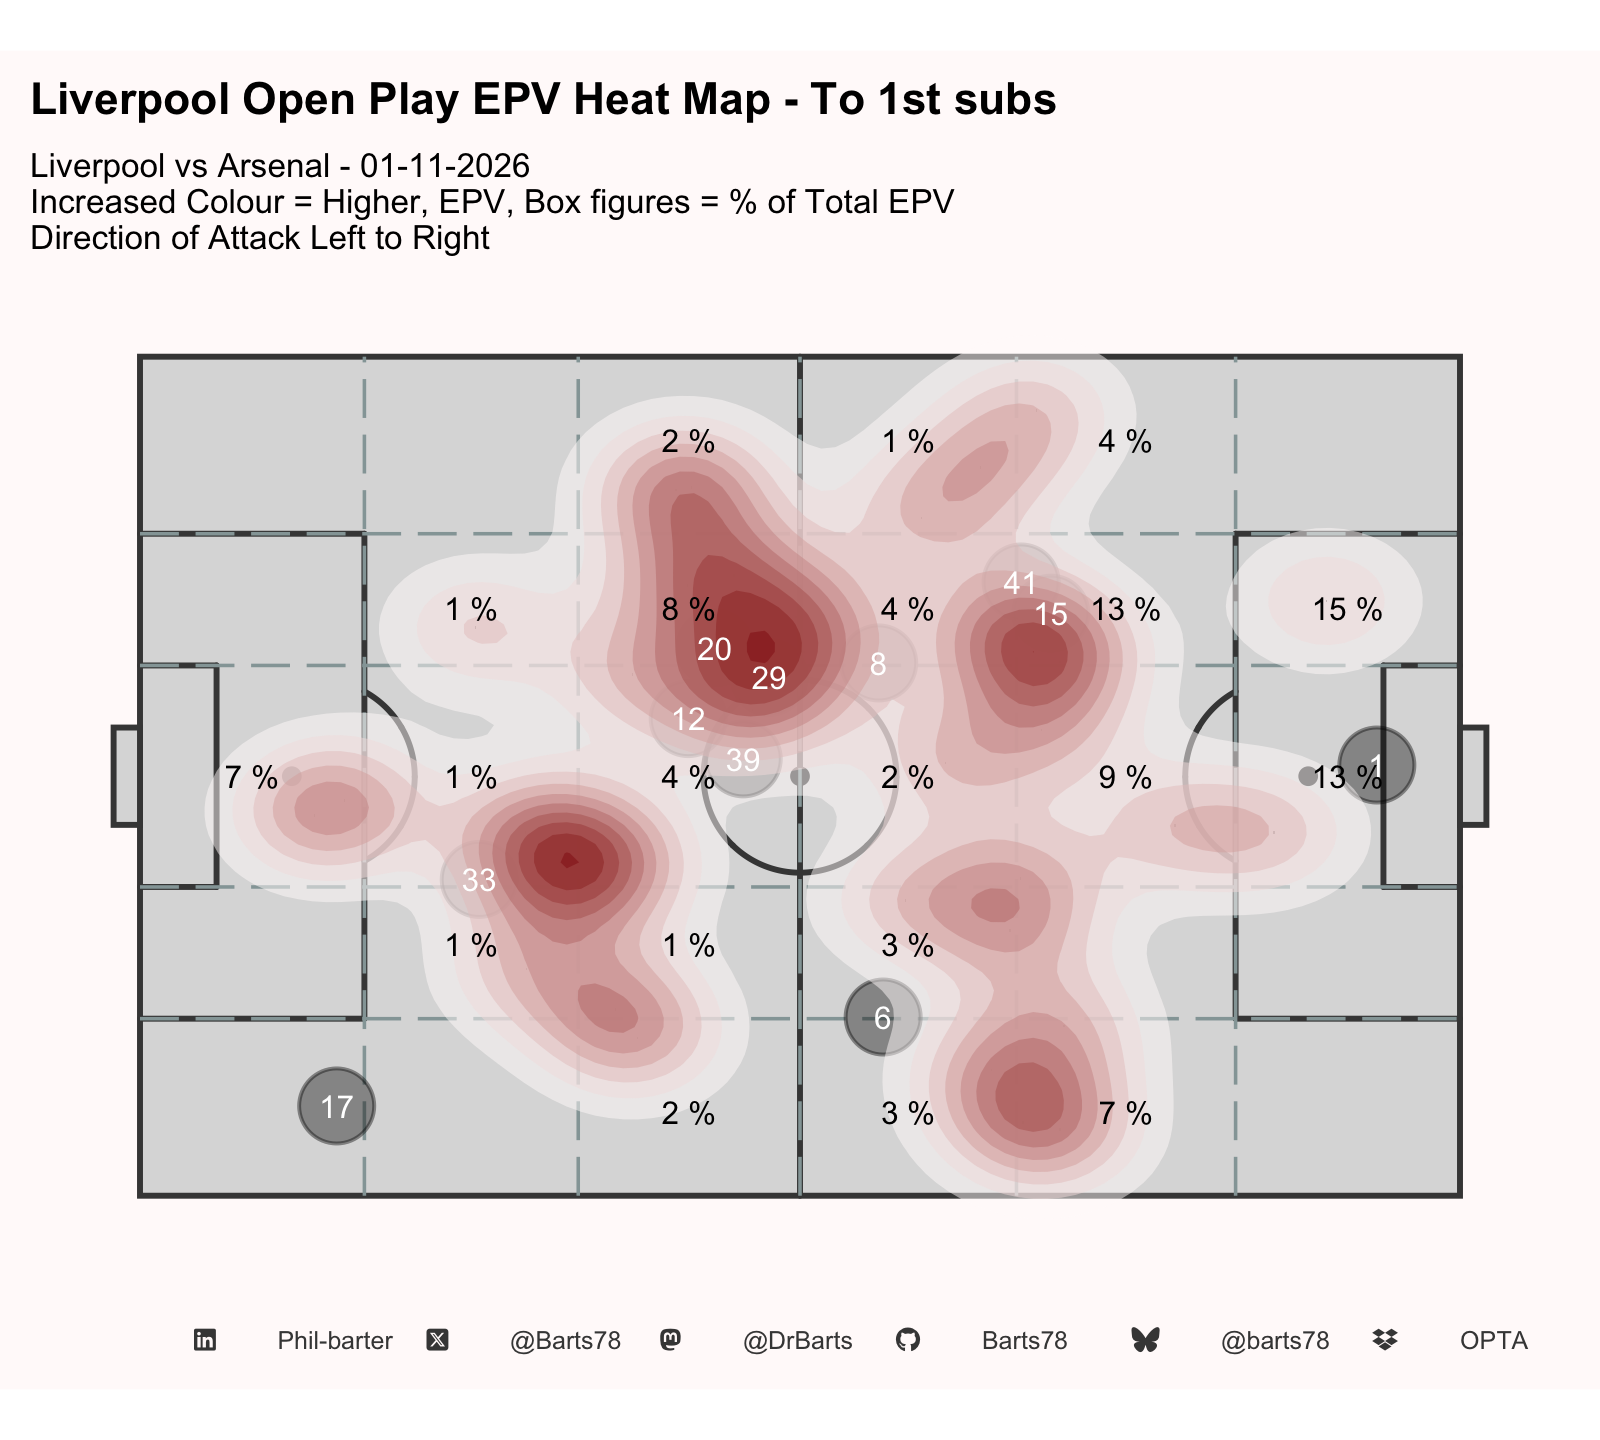
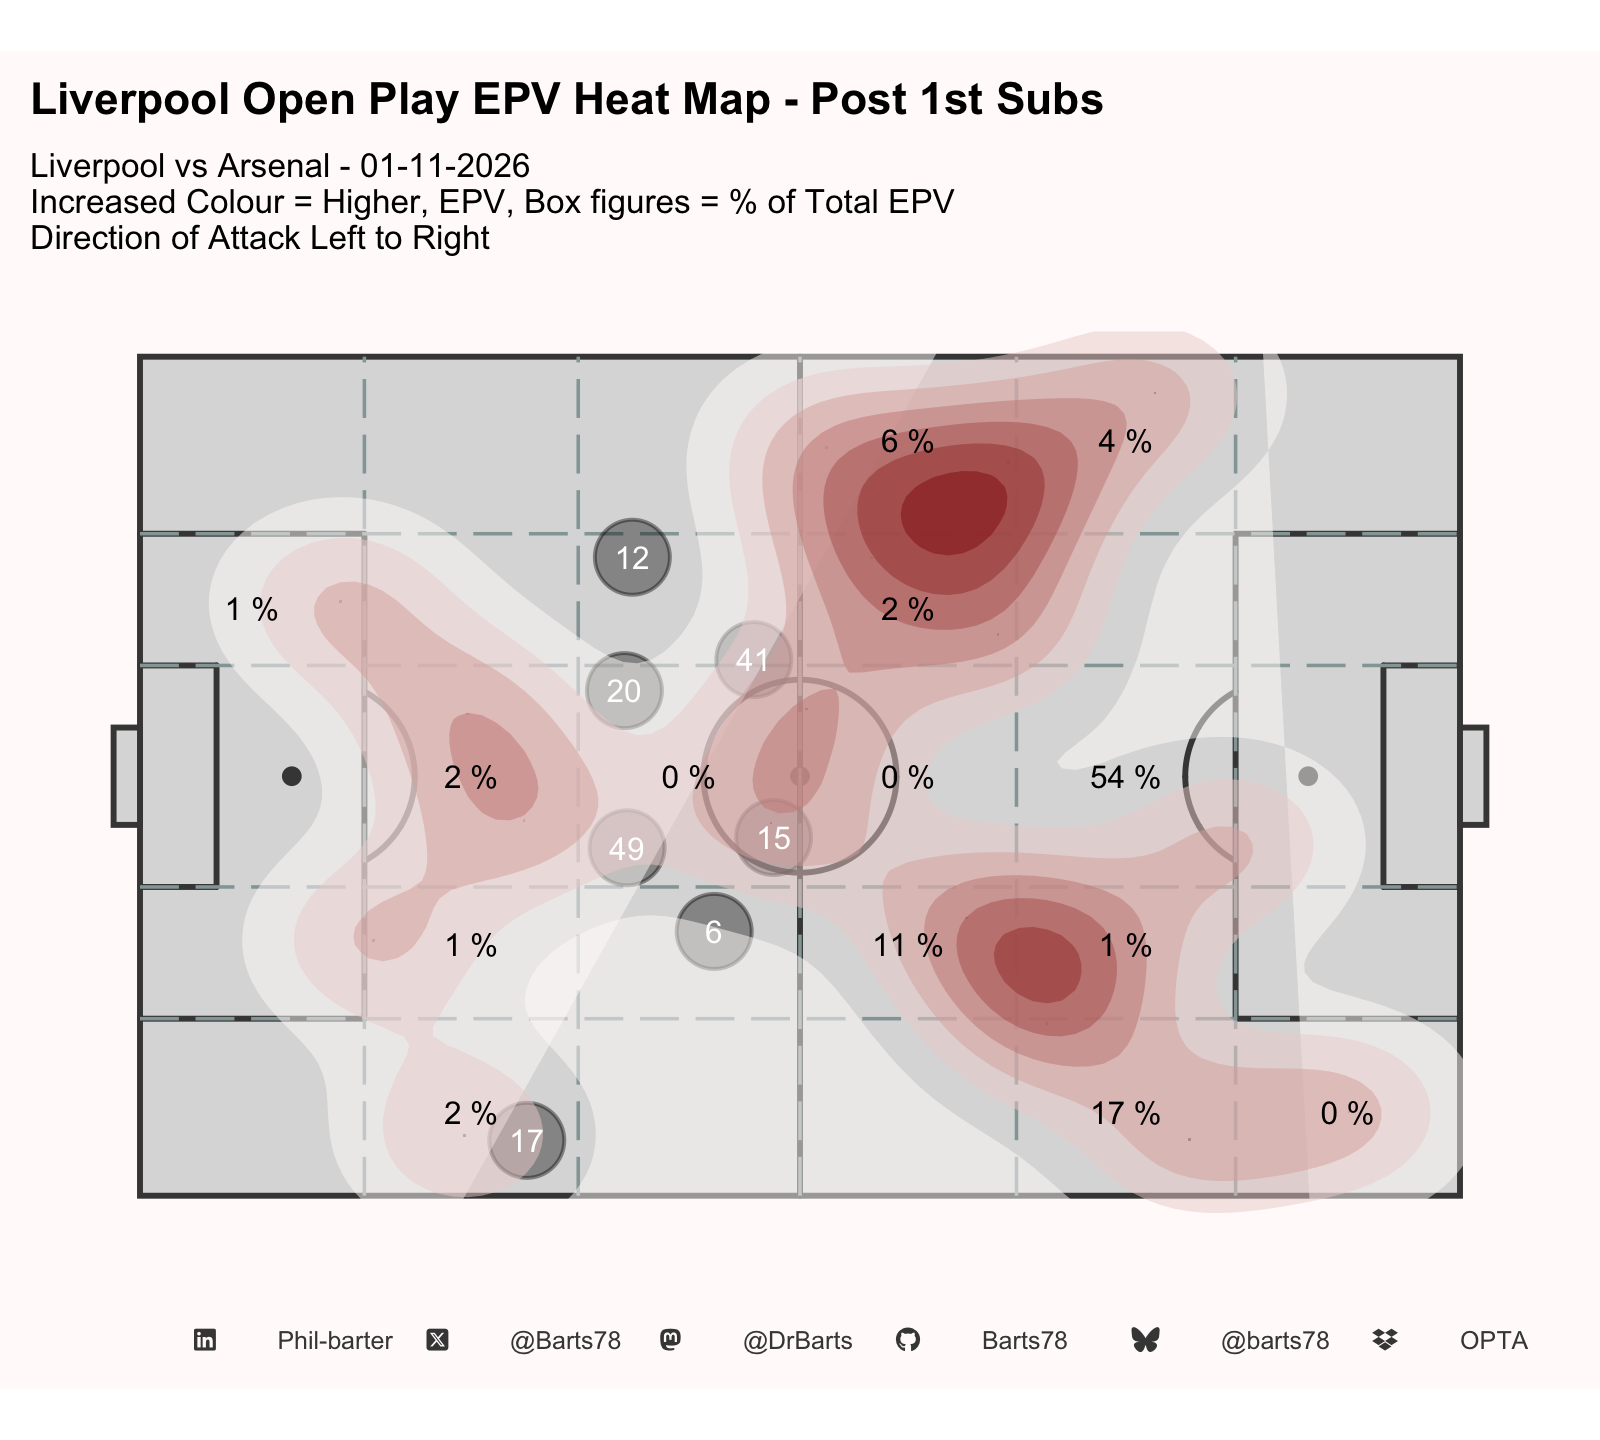
- Liverpool generated most threat from the final third, central (0.72 EPV, 23%), followed by the final third, left wing (0.59).
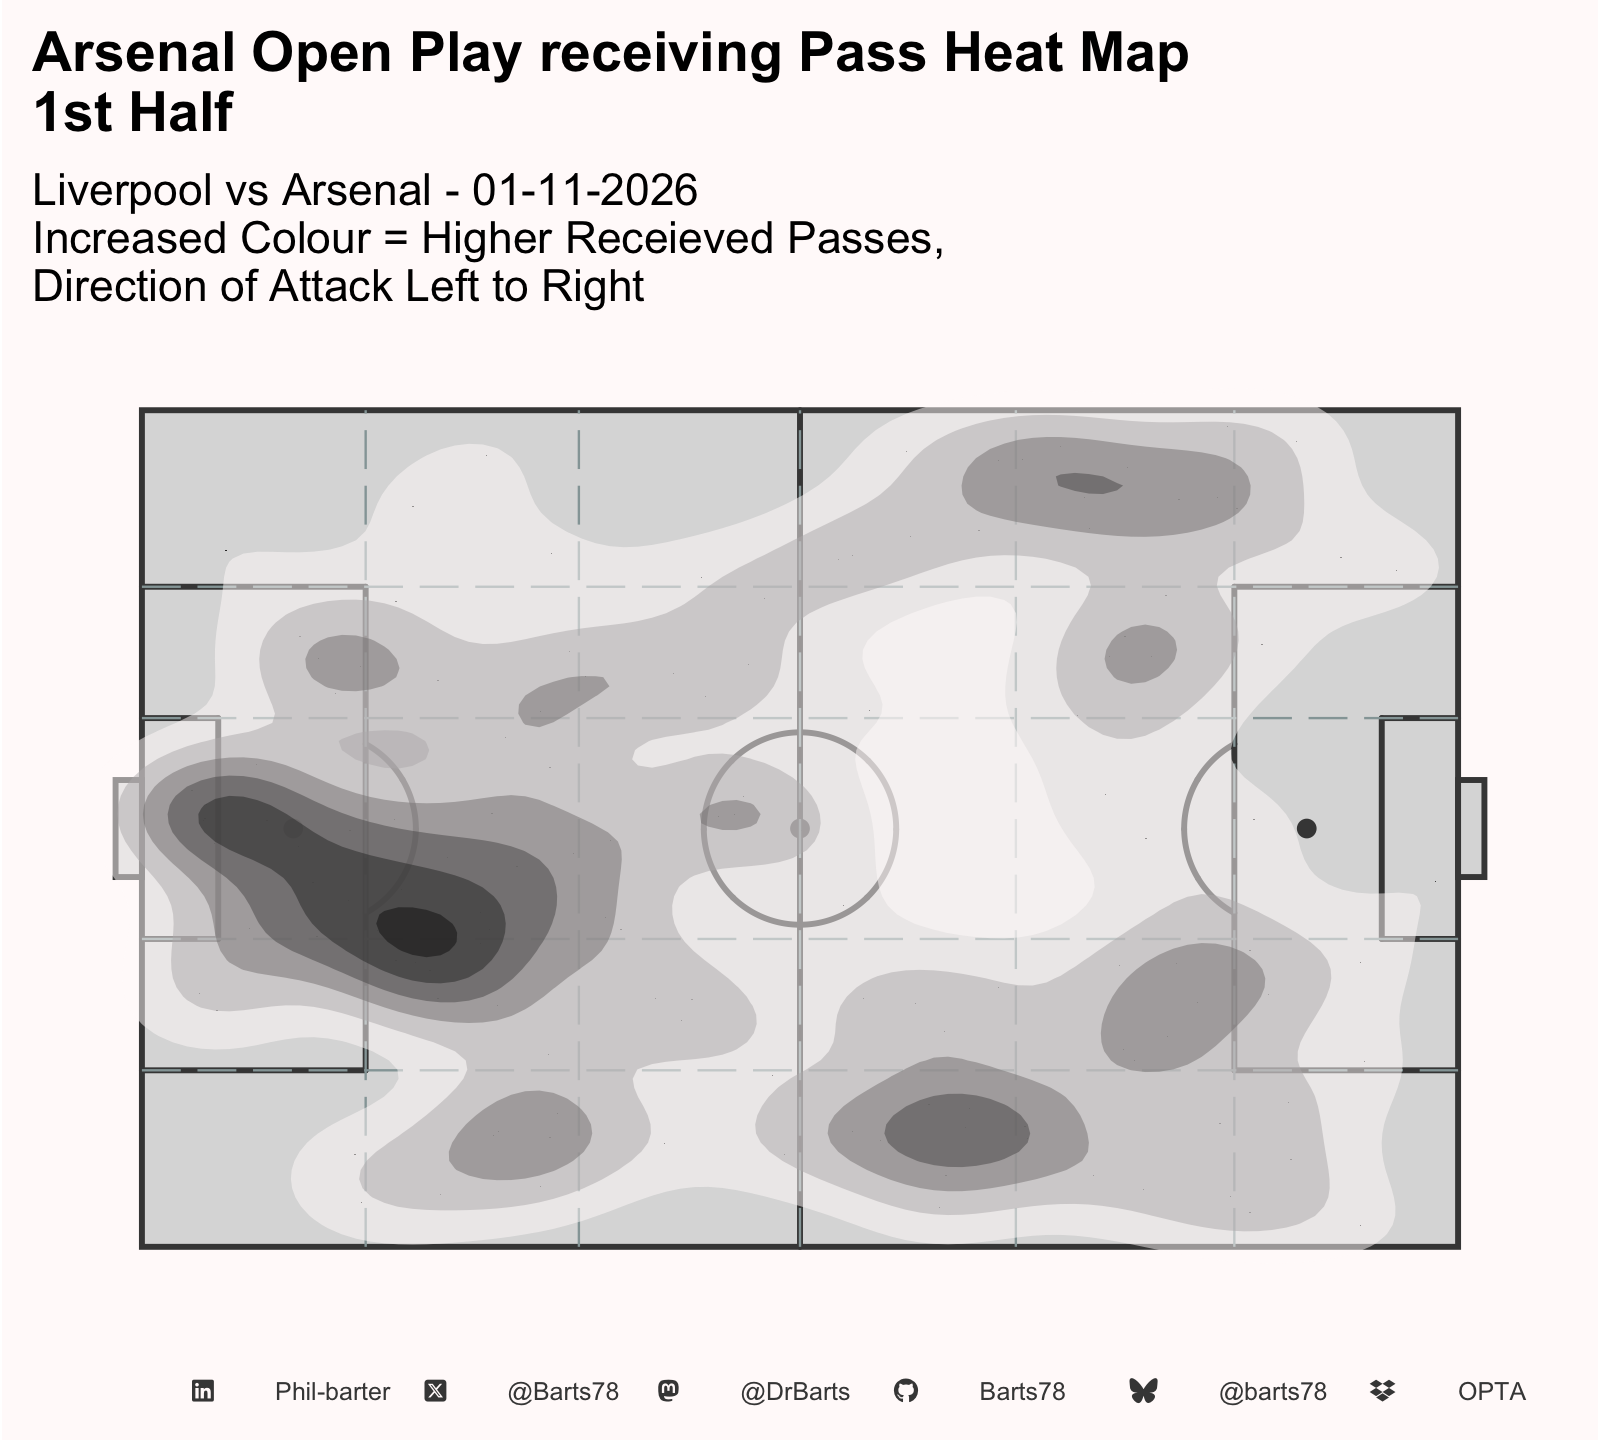
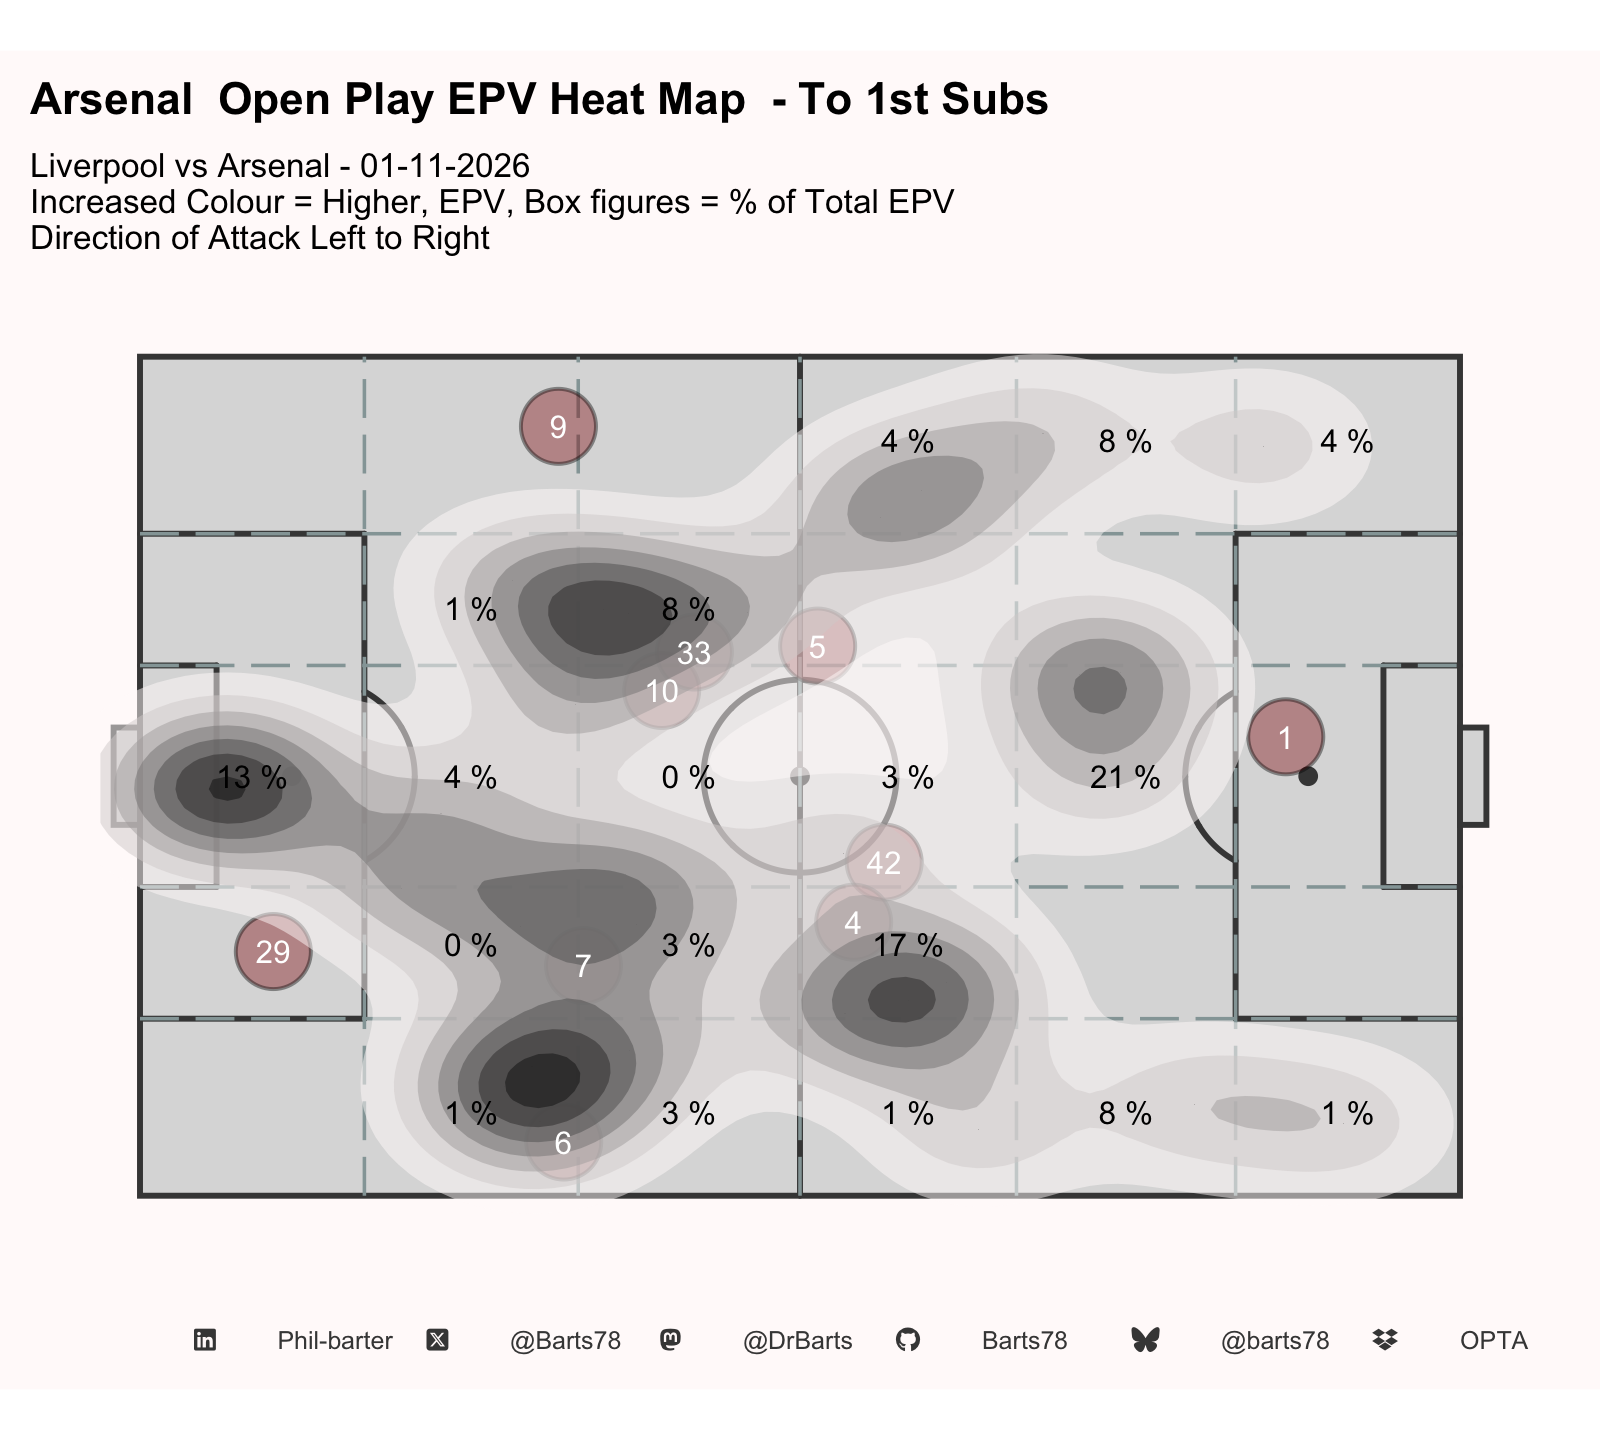
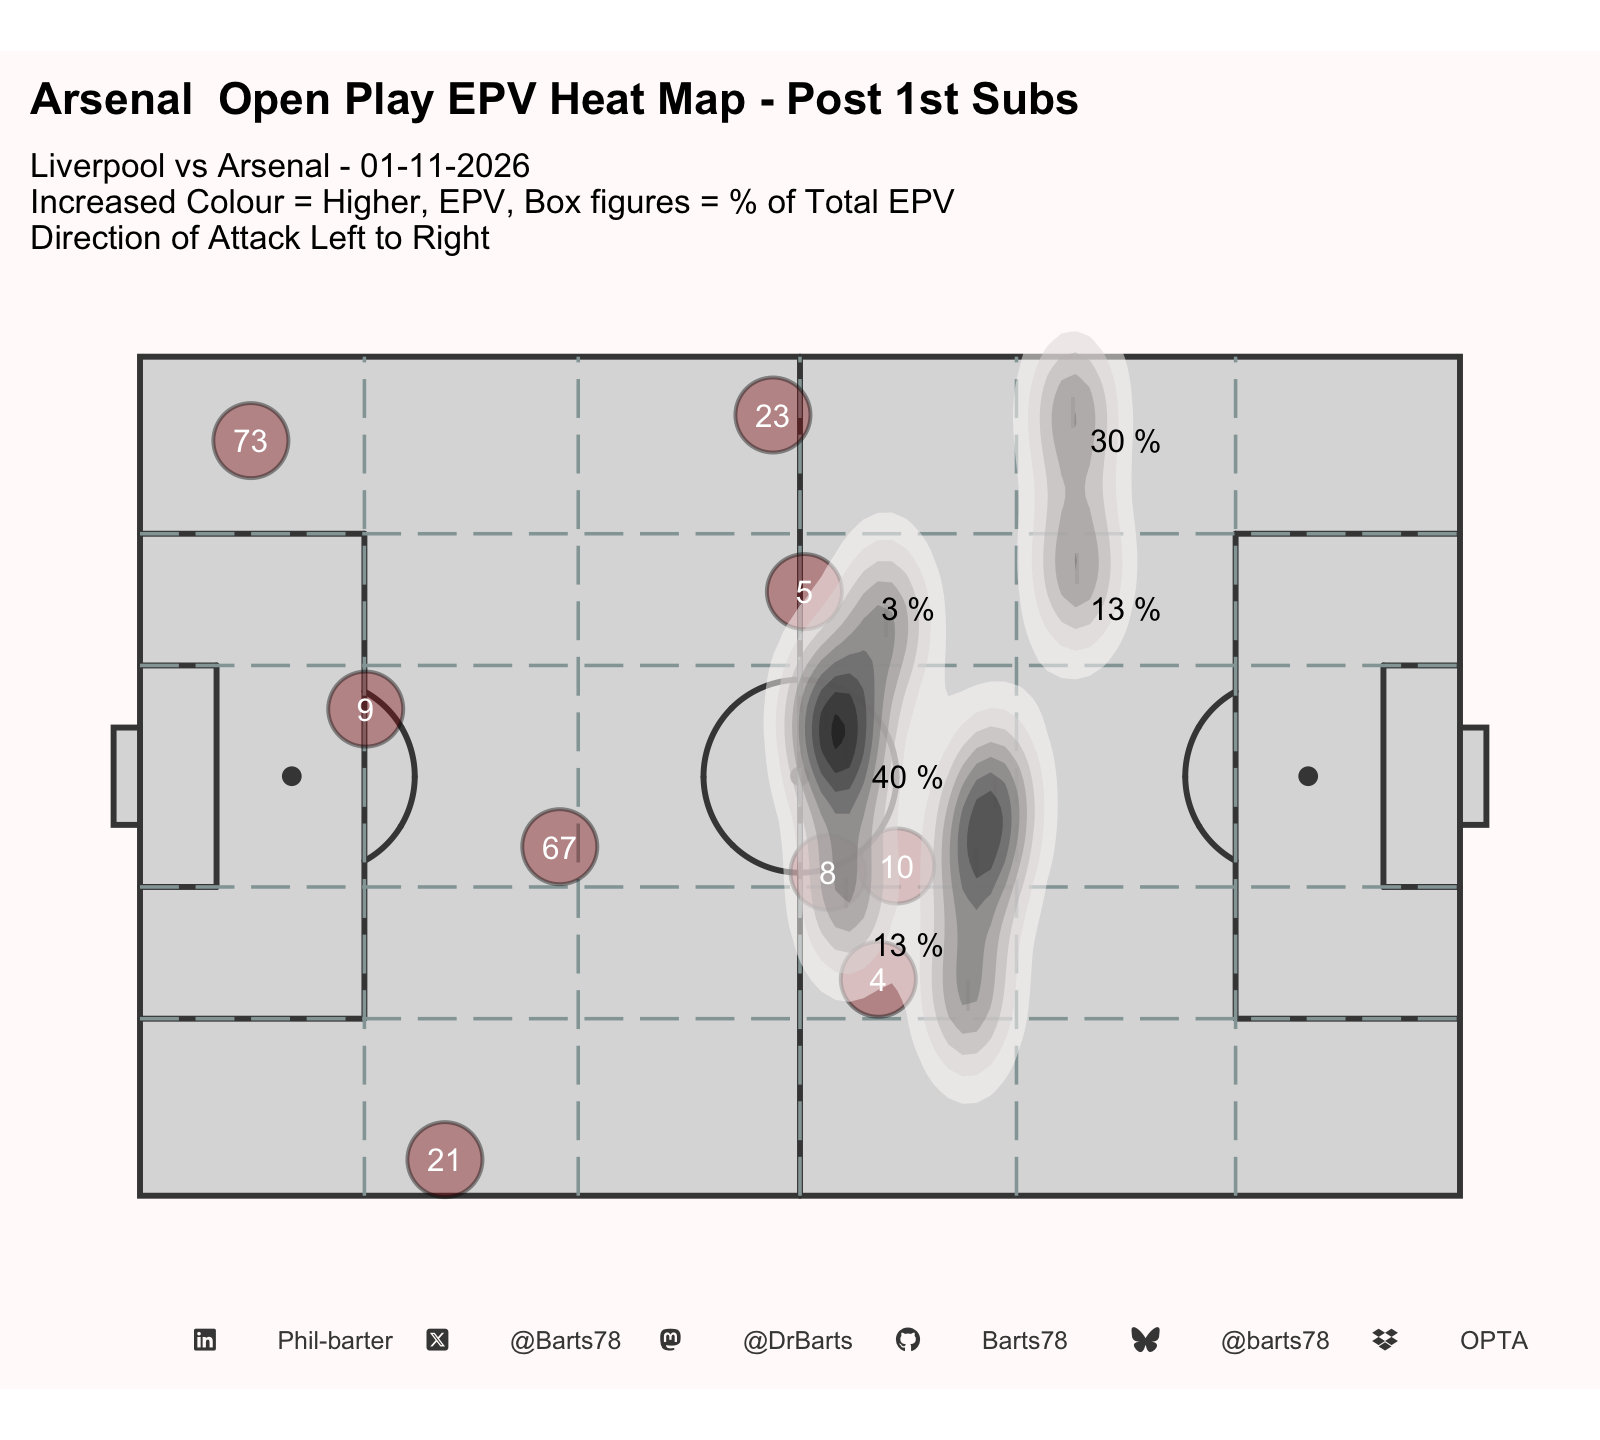
- Arsenal generated most threat from the final third, right half-space (0.54 EPV, 26%), followed by the final third, left half-space (0.29).
- Liverpool's most used combination was van Dijk to Nyoni (14 completed passes), and van Dijk was the hub of the pass map, involved in 108 completed passes.
- Arsenal's most used combination was Konsa to Raya (13 completed passes), and Rice was the hub of the pass map, involved in 80 completed passes.
| Liverpool Line up | ||
| Liverpool vs Arsenal - 01-11-2026 | ||
| Mins Played | Shirt Number | Player |
|---|---|---|
| Keeper | ||
| 99 | 1 | Alisson Becker |
| Defender | ||
| 99 | 5 | Jérémy Jacquet |
| 99 | 4 | Virgil van Dijk |
| 83 | 6 | Milos Kerkez |
| 83 | 33 | Ronald Araujo |
| 16 | 21 | Kostas Tsimikas |
| 16 | 23 | Víctor Muñoz |
| Midfielder | ||
| 99 | 10 | Alexis Mac Allister |
| 99 | 29 | Bradley Barcola |
| 83 | 7 | Florian Wirtz |
| 69 | 18 | Cody Gakpo |
| 60 | 42 | Trey Nyoni |
| 39 | 8 | Dominik Szoboszlai |
| 30 | 73 | Rio Ngumoha |
| 16 | 67 | Lewis Koumas |
| Forward | ||
| 99 | 9 | Alexander Isak |
| Substitute | ||
| 0 | 25 | Giorgi Mamardashvili |
| 0 | 2 | Joe Gomez |
| 0 | 3 | Wataru Endo |
| 0 | 38 | Ryan Gravenberch |
| X @Barts78 · Bluesky @barts78 · Mastodon @DrBarts · GitHub Barts78 · LinkedIn Phil-barter · Data: Opta | ||
| Arsenal Line up | ||
| Liverpool vs Arsenal - 01-11-2026 | ||
| Shirt Number | Mins Played | |
|---|---|---|
| Keeper | ||
| David Raya | 1 | 99 |
| Defender | ||
| Ezri Konsa | 15 | 99 |
| Gabriel Magalhães | 6 | 99 |
| Jurriën Timber | 12 | 99 |
| Riccardo Calafiori | 33 | 99 |
| Piero Hincapié | 5 | 13 |
| Midfielder | ||
| Declan Rice | 41 | 99 |
| Noni Madueke | 20 | 99 |
| Martin Ødegaard | 8 | 90 |
| Christos Tzolis | 17 | 86 |
| Bruno Guimarães | 39 | 64 |
| Myles Lewis-Skelly | 49 | 35 |
| Mikel Merino | 23 | 9 |
| Forward | ||
| Kai Havertz | 29 | 86 |
| Viktor Gyökeres | 14 | 13 |
| Substitute | ||
| Kepa Arrizabalaga | 13 | 0 |
| Cristhian Mosquera | 3 | 0 |
| Ben White | 4 | 0 |
| Eberechi Eze | 10 | 0 |
| Martín Zubimendi | 36 | 0 |
| X @Barts78 · Bluesky @barts78 · Mastodon @DrBarts · GitHub Barts78 · LinkedIn Phil-barter · Data: Opta | ||
| Match Summary - Full Time | |||||||||||||||||||||||||||||||
| Liverpool vs Arsenal - 01-11-2026 | |||||||||||||||||||||||||||||||
Possession
|
Shots
|
Threat
|
Passes
|
PPDO | Possession Control | Poss Control /100 Touches | |||||||||||||||||||||||||
|---|---|---|---|---|---|---|---|---|---|---|---|---|---|---|---|---|---|---|---|---|---|---|---|---|---|---|---|---|---|---|---|
| Possession % | On Ball Time | Touches | PKBox Touches | Field Tilt % | Total Shots | OFF Shots | SoT | 6yrd box Shots | PK Box Shots | Outside Box Shots | Blocked Shots | BCs | Goals | xG | NPxG | xGOT | EPV | EPV % xG Con. | EPV % NPxG Con. | Attempted Passes | Successful Passes | Pass Success % | Long Passes | Long Ball Rate | Crosses | Cross Success % | Corners | Short Corners | |||
| Arsenal | |||||||||||||||||||||||||||||||
| 46.5% | 39.80 | 602 | 24 | 38.5% | 10 | 4 | 3 | 2 | 6 | 4 | 3 | 1 | 1 | 0.99 | 0.99 | 1.45 | 2.08 | 47.5% | 47.5% | 372 | 269 | 72.3% | 65 | 17.5% | 10 | 40.0% | 4 | 2 | NaN | -104 | -17.3 |
| Liverpool | |||||||||||||||||||||||||||||||
| 53.5% | 39.00 | 692 | 55 | 61.5% | 17 | 8 | 0 | 1 | 14 | 3 | 9 | 1 | 0 | 1.05 | 1.05 | 0.00 | 3.14 | 33.5% | 33.5% | 464 | 380 | 81.9% | 44 | 9.5% | 33 | 15.2% | 7 | 1 | NaN | -94 | -13.6 |
| X @Barts78 · Bluesky @barts78 · Mastodon @DrBarts · GitHub Barts78 · LinkedIn Phil-barter · Data: Opta | |||||||||||||||||||||||||||||||
| Match Summary - By Half | |||||||||||||||||||||||||||||||
| Liverpool vs Arsenal - 01-11-2026 | |||||||||||||||||||||||||||||||
Possession
|
Shots
|
Threat
|
Passes
|
Possession Control | Poss Control /100 Touches | ||||||||||||||||||||||||||
|---|---|---|---|---|---|---|---|---|---|---|---|---|---|---|---|---|---|---|---|---|---|---|---|---|---|---|---|---|---|---|---|
| Possession % | On Ball Time | Touches | PKBox Touches | Field Tilt % | Total Shots | OFF Shots | SoT | 6yrd box Shots | PK Box Shots | Outside Box Shots | Blocked Shots | BCs | Goals | xG | NPxG | xGOT | EPV | EPV % xG Con. | EPV % NPxG Con. | Attempted Passes | Successful Passes | Pass Success % | Long Passes | Long Ball Rate | Crosses | Cross Success % | Corners | Short Corners | |||
| First Half | |||||||||||||||||||||||||||||||
| Arsenal | 47.4% | 17.50 | 292 | 15 | 42.2% | 5 | 2 | 2 | 1 | 3 | 2 | 1 | 1 | 1 | 0.82 | 0.82 | 1.09 | 1.35 | 60.7% | 60.7% | 179 | 137 | 76.5% | 24 | 13.4% | 4 | 50.0% | 1 | 1 | -49 | -16.8 |
| Liverpool | 52.6% | 21.40 | 324 | 31 | 57.8% | 8 | 6 | 0 | 0 | 6 | 2 | 2 | 1 | 0 | 0.41 | 0.41 | 0.00 | 1.42 | 28.9% | 28.9% | 214 | 178 | 83.2% | 19 | 8.9% | 18 | 22.2% | 6 | 1 | -31 | -9.6 |
| Second Half | |||||||||||||||||||||||||||||||
| Arsenal | 45.7% | 22.30 | 310 | 9 | 34.8% | 5 | 2 | 1 | 1 | 3 | 2 | 2 | 0 | 0 | 0.17 | 0.17 | 0.36 | 0.73 | 23.2% | 23.2% | 193 | 132 | 68.4% | 41 | 21.2% | 6 | 33.3% | 3 | 1 | -55 | -17.7 |
| Liverpool | 54.3% | 17.60 | 368 | 24 | 65.2% | 9 | 2 | 0 | 1 | 8 | 1 | 7 | 0 | 0 | 0.64 | 0.64 | 0.00 | 1.72 | 37.2% | 37.2% | 250 | 202 | 80.8% | 25 | 10.0% | 15 | 6.7% | 1 | 0 | -63 | -17.1 |
| X @Barts78 · Bluesky @barts78 · Mastodon @DrBarts · GitHub Barts78 · LinkedIn Phil-barter · Data: Opta | |||||||||||||||||||||||||||||||
| Match Summary - By Game Period | |||||||||||||||||||||||||||||||
| Liverpool vs Arsenal - 01-11-2026 | |||||||||||||||||||||||||||||||
Possession
|
Shots
|
Threat
|
Passes
|
Possession Control | Poss Control /100 Touches | ||||||||||||||||||||||||||
|---|---|---|---|---|---|---|---|---|---|---|---|---|---|---|---|---|---|---|---|---|---|---|---|---|---|---|---|---|---|---|---|
| Possession % | On Ball Time | Touches | PKBox Touches | Field Tilt % | Total Shots | OFF Shots | ONT Shots | 6yrd box Shots | PK Box Shots | Outside Box Shots | Blocked Shots | BCs | Goals | xG | NPxG | xGOT | EPV | EPV % xG Con. | EPV % NPxG Con. | Attempted Passes | Successful Passes | Pass Success % | Long Passes | Long Ball Rate | Crosses | Cross Success % | Corners | Short Corners | |||
| 0 - 15 | |||||||||||||||||||||||||||||||
| Arsenal | 63.5% | 8.90 | 120 | 3 | 88.6% | 2 | 1 | 1 | 1 | 1 | 1 | 0 | 1 | 1 | 0.66 | 0.66 | 0.99 | 0.65 | 102.0% | 102.0% | 84 | 69 | 82.1% | 9 | 10.7% | 3 | 33.3% | 1 | 1 | -15 | -12.5 |
| Liverpool | 36.5% | 4.60 | 69 | 2 | 11.4% | 0 | 0 | 0 | 0 | 0 | 0 | 0 | 0 | 0 | 0.00 | 0.00 | 0.00 | 0.06 | 0.0% | 0.0% | 38 | 24 | 63.2% | 8 | 21.1% | 1 | 0.0% | 0 | 0 | -8 | -11.6 |
| 16 - 30 | |||||||||||||||||||||||||||||||
| Arsenal | 39.5% | 3.10 | 70 | 8 | 32.8% | 2 | 1 | 1 | 0 | 2 | 0 | 0 | 0 | 0 | 0.11 | 0.11 | 0.10 | 0.46 | 24.0% | 24.0% | 31 | 25 | 80.6% | 5 | 16.1% | 1 | 100.0% | 0 | 0 | -17 | -24.3 |
| Liverpool | 60.5% | 8.40 | 107 | 15 | 67.2% | 4 | 2 | 0 | 0 | 4 | 0 | 2 | 0 | 0 | 0.20 | 0.20 | 0.00 | 0.57 | 35.1% | 35.1% | 70 | 62 | 88.6% | 6 | 8.6% | 12 | 16.7% | 5 | 1 | -10 | -9.3 |
| 31 - 45 | |||||||||||||||||||||||||||||||
| Arsenal | 40.8% | 5.50 | 102 | 4 | 27.4% | 1 | 0 | 0 | 0 | 0 | 1 | 1 | 0 | 0 | 0.05 | 0.05 | 0.00 | 0.24 | 20.5% | 20.5% | 64 | 43 | 67.2% | 10 | 15.6% | 0 | 0.0% | 0 | 0 | -17 | -16.7 |
| Liverpool | 59.2% | 8.40 | 148 | 14 | 72.6% | 4 | 4 | 0 | 0 | 2 | 2 | 0 | 1 | 0 | 0.21 | 0.21 | 0.00 | 0.79 | 26.7% | 26.7% | 106 | 92 | 86.8% | 5 | 4.7% | 5 | 40.0% | 1 | 0 | -13 | -8.8 |
| 46 - 60 | |||||||||||||||||||||||||||||||
| Arsenal | 41.6% | 5.90 | 94 | 1 | 23.8% | 1 | 1 | 0 | 0 | 1 | 0 | 0 | 0 | 0 | 0.05 | 0.05 | 0.00 | 0.15 | 32.9% | 32.9% | 56 | 39 | 69.6% | 15 | 26.8% | 0 | 0.0% | 0 | 0 | -19 | -20.2 |
| Liverpool | 58.4% | 6.80 | 132 | 6 | 76.2% | 2 | 1 | 0 | 0 | 2 | 0 | 1 | 0 | 0 | 0.09 | 0.09 | 0.00 | 0.51 | 17.7% | 17.7% | 99 | 81 | 81.8% | 7 | 7.1% | 5 | 0.0% | 0 | 0 | -23 | -17.4 |
| 61 - 75 | |||||||||||||||||||||||||||||||
| Arsenal | 57.6% | 7.80 | 117 | 8 | 68.8% | 4 | 1 | 1 | 1 | 2 | 2 | 2 | 0 | 0 | 0.12 | 0.12 | 0.36 | 0.43 | 27.9% | 27.9% | 79 | 63 | 79.7% | 12 | 15.2% | 6 | 33.3% | 3 | 1 | -21 | -17.9 |
| Liverpool | 42.4% | 3.60 | 86 | 3 | 31.2% | 2 | 0 | 0 | 0 | 1 | 1 | 2 | 0 | 0 | 0.20 | 0.20 | 0.00 | 0.16 | 122.0% | 122.0% | 49 | 38 | 77.6% | 9 | 18.4% | 1 | 0.0% | 0 | 0 | -6 | -7.0 |
| 76 - 90 | |||||||||||||||||||||||||||||||
| Arsenal | 36.7% | 6.00 | 65 | 0 | 4.2% | 0 | 0 | 0 | 0 | 0 | 0 | 0 | 0 | 0 | 0.00 | 0.00 | 0.00 | 0.10 | 0.0% | 0.0% | 38 | 19 | 50.0% | 9 | 23.7% | 0 | 0.0% | 0 | 0 | -7 | -10.8 |
| Liverpool | 63.3% | 5.30 | 112 | 14 | 95.8% | 4 | 0 | 0 | 1 | 4 | 0 | 4 | 0 | 0 | 0.28 | 0.28 | 0.00 | 0.81 | 34.4% | 34.4% | 77 | 65 | 84.4% | 5 | 6.5% | 7 | 14.3% | 1 | 0 | -23 | -20.5 |
| 90 + | |||||||||||||||||||||||||||||||
| Arsenal | 47.2% | 2.70 | 34 | 0 | 53.8% | 0 | 0 | 0 | 0 | 0 | 0 | 0 | 0 | 0 | 0.00 | 0.00 | 0.00 | 0.05 | 0.0% | 0.0% | 20 | 11 | 55.0% | 5 | 25.0% | 0 | 0.0% | 0 | 0 | -8 | -23.5 |
| Liverpool | 52.8% | 1.90 | 38 | 1 | 46.2% | 1 | 1 | 0 | 0 | 1 | 0 | 0 | 0 | 0 | 0.07 | 0.07 | 0.00 | 0.23 | 30.0% | 30.0% | 25 | 18 | 72.0% | 4 | 16.0% | 2 | 0.0% | 0 | 0 | -11 | -28.9 |
| X @Barts78 · Bluesky @barts78 · Mastodon @DrBarts · GitHub Barts78 · LinkedIn Phil-barter · Data: Opta | |||||||||||||||||||||||||||||||
| Match Summary - By Game Quarter | |||||||||||||||||||||||||||||||
| Liverpool vs Arsenal - 01-11-2026 | |||||||||||||||||||||||||||||||
Possession
|
Shots
|
Threat
|
Passes
|
Possession Control | Poss Control /100 Touches | ||||||||||||||||||||||||||
|---|---|---|---|---|---|---|---|---|---|---|---|---|---|---|---|---|---|---|---|---|---|---|---|---|---|---|---|---|---|---|---|
| Possession % | On Ball Time | Touches | PKBox Touches | Field Tilt % | Total Shots | OFF Shots | ONT Shots | 6yrd box Shots | PK Box Shots | Outside Box Shots | Blocked Shots | BCs | Goals | xG | NPxG | xGOT | EPV | EPV % xG Con. | EPV % NPxG Con. | Attempted Passes | Successful Passes | Pass Success % | Long Passes | Long Ball Rate | Crosses | Cross Success % | Corners | Short Corners | |||
| 1st Quarter | |||||||||||||||||||||||||||||||
| Arsenal | 56.1% | 11.60 | 176 | 11 | 72.6% | 4 | 2 | 2 | 1 | 3 | 1 | 0 | 1 | 1 | 0.77 | 0.77 | 1.09 | 1.09 | 70.3% | 70.3% | 112 | 93 | 83.0% | 12 | 10.7% | 4 | 50.0% | 1 | 1 | -25 | -14.2 |
| Liverpool | 43.9% | 9.90 | 138 | 7 | 27.4% | 0 | 0 | 0 | 0 | 0 | 0 | 0 | 0 | 0 | 0.00 | 0.00 | 0.00 | 0.21 | 0.0% | 0.0% | 85 | 65 | 76.5% | 12 | 14.1% | 6 | 0.0% | 2 | 0 | -13 | -9.4 |
| 2nd Quarter | |||||||||||||||||||||||||||||||
| Arsenal | 38.4% | 5.90 | 116 | 4 | 21.3% | 1 | 0 | 0 | 0 | 0 | 1 | 1 | 0 | 0 | 0.05 | 0.05 | 0.00 | 0.26 | 19.6% | 19.6% | 67 | 44 | 65.7% | 12 | 17.9% | 0 | 0.0% | 0 | 0 | -24 | -20.7 |
| Liverpool | 61.6% | 11.40 | 186 | 24 | 78.7% | 8 | 6 | 0 | 0 | 6 | 2 | 2 | 1 | 0 | 0.41 | 0.41 | 0.00 | 1.21 | 34.0% | 34.0% | 129 | 113 | 87.6% | 7 | 5.4% | 12 | 33.3% | 4 | 1 | -18 | -9.7 |
| 3rd Quarter | |||||||||||||||||||||||||||||||
| Arsenal | 51.7% | 11.80 | 183 | 4 | 55.4% | 3 | 1 | 0 | 0 | 1 | 2 | 2 | 0 | 0 | 0.10 | 0.10 | 0.00 | 0.37 | 27.0% | 27.0% | 120 | 89 | 74.2% | 25 | 20.8% | 3 | 0.0% | 2 | 1 | -35 | -19.1 |
| Liverpool | 48.3% | 8.30 | 171 | 9 | 44.6% | 3 | 1 | 0 | 0 | 3 | 0 | 2 | 0 | 0 | 0.27 | 0.27 | 0.00 | 0.55 | 48.8% | 48.8% | 114 | 87 | 76.3% | 13 | 11.4% | 5 | 0.0% | 0 | 0 | -28 | -16.4 |
| 4th Quarter | |||||||||||||||||||||||||||||||
| Arsenal | 39.2% | 10.50 | 127 | 5 | 20.7% | 2 | 1 | 1 | 1 | 2 | 0 | 0 | 0 | 0 | 0.07 | 0.07 | 0.36 | 0.36 | 19.2% | 19.2% | 73 | 43 | 58.9% | 16 | 21.9% | 3 | 66.7% | 1 | 0 | -20 | -15.7 |
| Liverpool | 60.8% | 9.30 | 197 | 15 | 79.3% | 6 | 1 | 0 | 1 | 5 | 1 | 5 | 0 | 0 | 0.37 | 0.37 | 0.00 | 1.17 | 31.7% | 31.7% | 136 | 115 | 84.6% | 12 | 8.8% | 10 | 10.0% | 1 | 0 | -35 | -17.8 |
| X @Barts78 · Bluesky @barts78 · Mastodon @DrBarts · GitHub Barts78 · LinkedIn Phil-barter · Data: Opta | |||||||||||||||||||||||||||||||
| Match Summary - By Game State | |||||||||||||||||||||||||||||||
| Liverpool vs Arsenal - 01-11-2026 | |||||||||||||||||||||||||||||||
Possession
|
Shots
|
Threat
|
Passes
|
Possession Control | Poss Control /100 Touches | ||||||||||||||||||||||||||
|---|---|---|---|---|---|---|---|---|---|---|---|---|---|---|---|---|---|---|---|---|---|---|---|---|---|---|---|---|---|---|---|
| Possession % | On Ball Time | Touches | PKBox Touches | Field Tilt % | Total Shots | OFF Shots | SoT | 6yrd box Shots | PK Box Shots | Outside Box Shots | Blocked Shots | BCs | Goals | xG | NPxG | xGOT | EPV | EPV % xG Con. | EPV % NPxG Con. | Attempted Passes | Successful Passes | Pass Success % | Long Passes | Long Ball Rate | Crosses | Cross Success % | Corners | Short Corners | |||
| Away Lead | |||||||||||||||||||||||||||||||
| Arsenal | 43.6% | 30.80 | 482 | 21 | 32.5% | 8 | 3 | 2 | 1 | 5 | 3 | 3 | 0 | 0 | 0.33 | 0.33 | 0.46 | 1.44 | 23.0% | 23.0% | 288 | 200 | 69.4% | 56 | 19.4% | 7 | 42.9% | 3 | 1 | -89 | -18.5 |
| Liverpool | 56.4% | 34.50 | 623 | 53 | 67.5% | 17 | 8 | 0 | 1 | 14 | 3 | 9 | 1 | 0 | 1.05 | 1.05 | 0.00 | 3.07 | 34.1% | 34.1% | 426 | 356 | 83.6% | 36 | 8.4% | 32 | 15.6% | 7 | 1 | -86 | -13.8 |
| Draw | |||||||||||||||||||||||||||||||
| Arsenal | 63.5% | 8.90 | 120 | 3 | 88.6% | 2 | 1 | 1 | 1 | 1 | 1 | 0 | 1 | 1 | 0.66 | 0.66 | 0.99 | 0.65 | 102.0% | 102.0% | 84 | 69 | 82.1% | 9 | 10.7% | 3 | 33.3% | 1 | 1 | -15 | -12.5 |
| Liverpool | 36.5% | 4.60 | 69 | 2 | 11.4% | 0 | 0 | 0 | 0 | 0 | 0 | 0 | 0 | 0 | 0.00 | 0.00 | 0.00 | 0.06 | 0.0% | 0.0% | 38 | 24 | 63.2% | 8 | 21.1% | 1 | 0.0% | 0 | 0 | -8 | -11.6 |
| X @Barts78 · Bluesky @barts78 · Mastodon @DrBarts · GitHub Barts78 · LinkedIn Phil-barter · Data: Opta | |||||||||||||||||||||||||||||||
| Season Summary - Full Games | ||||||||||||||||||||||||||||
| Up to Liverpool vs Arsenal - 01-11-2026 | ||||||||||||||||||||||||||||
| Possession % | Touches | PKBox Touches | Field Tilt % | Total Shots | OFF Shots | SoT | 6yrd box Shots | PK Box Shots | Outside Box Shots | BCs | Goals | xG | NPxG | xGOT | EPV | EPV % xG Con. | Attempted Passes | Successful Passes | Pass Success % | Long Passes | Long Ball Rate | Crosses | Cross Success % | Corners | Short Corners | Possession Control | Poss Control /100 Touches | EPV % NPxG Con. |
|---|---|---|---|---|---|---|---|---|---|---|---|---|---|---|---|---|---|---|---|---|---|---|---|---|---|---|---|---|
| All Oppo | ||||||||||||||||||||||||||||
| 47.6% | 5,556 | 226 | 42.8% | 110 | 45 | 27 | 13 | 67 | 43 | 15 | 9 | 10.46 | 9.67 | 9.63 | 18.01 | 58.1% | 3615 | 2859 | 79.1% | 520 | 14.4% | 134 | 21.6% | 37 | 9 | -834 | -15.0 | 53.7% |
| Liverpool | ||||||||||||||||||||||||||||
| 52.4% | 6,125 | 260 | 57.2% | 140 | 48 | 39 | 11 | 85 | 55 | 12 | 11 | 12.50 | 11.71 | 11.93 | 21.15 | 59.1% | 4156 | 3456 | 83.2% | 445 | 10.7% | 172 | 18.6% | 45 | 9 | -754 | -12.3 | 55.4% |
| X @Barts78 · Bluesky @barts78 · Mastodon @DrBarts · GitHub Barts78 · LinkedIn Phil-barter · Data: Opta | ||||||||||||||||||||||||||||
| Season Summary - By Half | |||||||||||||||||||||||||||||
| Up to Liverpool vs Arsenal - 01-11-2026 | |||||||||||||||||||||||||||||
Possession
|
Shots
|
Threat
|
Passes
|
Possession Control | Poss Control /100 Touches | ||||||||||||||||||||||||
|---|---|---|---|---|---|---|---|---|---|---|---|---|---|---|---|---|---|---|---|---|---|---|---|---|---|---|---|---|---|
| Possession % | Touches | PKBox Touches | Field Tilt % | Total Shots | OFF Shots | SoT | 6yrd box Shots | PK Box Shots | Outside Box Shots | BCs | Goals | xG | NPxG | xGOT | EPV | EPV % xG Con. | EPV % NPxG Con. | Attempted Passes | Successful Passes | Pass Success % | Long Passes | Long Ball Rate | Crosses | Cross Success % | Corners | Short Corners | |||
| First Half | |||||||||||||||||||||||||||||
| All Oppo | 47.6% | 2,777 | 117 | 41.7% | 52 | 19 | 12 | 8 | 36 | 16 | 8 | 4 | 4.81 | 4.81 | 4.05 | 9.41 | 51.1% | 51.1% | 1818 | 1434 | 78.9% | 256 | 14.1% | 61 | 19.7% | 20 | 6 | -443 | -16.0 |
| Liverpool | 52.4% | 3,051 | 127 | 58.3% | 62 | 26 | 17 | 4 | 34 | 28 | 5 | 4 | 4.33 | 4.33 | 4.04 | 10.26 | 42.2% | 42.2% | 2109 | 1731 | 82.1% | 223 | 10.6% | 81 | 19.8% | 26 | 5 | -359 | -11.8 |
| Second Half | |||||||||||||||||||||||||||||
| All Oppo | 47.5% | 2,779 | 109 | 43.9% | 58 | 26 | 15 | 5 | 31 | 27 | 7 | 5 | 5.65 | 4.86 | 5.58 | 8.60 | 65.7% | 56.5% | 1797 | 1425 | 79.3% | 264 | 14.7% | 73 | 23.3% | 17 | 3 | -391 | -14.1 |
| Liverpool | 52.5% | 3,074 | 133 | 56.1% | 78 | 22 | 22 | 7 | 51 | 27 | 7 | 7 | 8.17 | 7.38 | 7.89 | 10.90 | 75.0% | 67.7% | 2047 | 1725 | 84.3% | 222 | 10.8% | 91 | 17.6% | 19 | 4 | -395 | -12.8 |
| X @Barts78 · Bluesky @barts78 · Mastodon @DrBarts · GitHub Barts78 · LinkedIn Phil-barter · Data: Opta | |||||||||||||||||||||||||||||
| Season Summary - By Game Period | |||||||||||||||||||||||||||||
| Up to Liverpool vs Arsenal - 01-11-2026 | |||||||||||||||||||||||||||||
Possession
|
Shots
|
Threat
|
Passes
|
Possession Control | Poss Control /100 Touches | ||||||||||||||||||||||||
|---|---|---|---|---|---|---|---|---|---|---|---|---|---|---|---|---|---|---|---|---|---|---|---|---|---|---|---|---|---|
| Possession % | Touches | PKBox Touches | Field Tilt % | Total Shots | OFF Shots | ONT Shots | 6yrd box Shots | PK Box Shots | Outside Box Shots | BCs | Goals | xG | NPxG | xGOT | EPV | EPV % xG Con. | EPV % NPxG Con. | Attempted Passes | Successful Passes | Pass Success % | Long Passes | Long Ball Rate | Crosses | Cross Success % | Corners | Short Corners | |||
| 0 - 15 | |||||||||||||||||||||||||||||
| All Oppo | 48.4% | 991 | 31 | 46.6% | 12 | 5 | 2 | 2 | 7 | 5 | 5 | 2 | 1.97 | 1.97 | 1.19 | 3.11 | 63.4% | 63.4% | 671 | 513 | 76.5% | 105 | 15.7% | 17 | 11.8% | 5 | 3 | -172 | -17.4 |
| Liverpool | 51.6% | 1,058 | 29 | 53.4% | 11 | 4 | 3 | 0 | 8 | 3 | 0 | 2 | 0.83 | 0.83 | 0.45 | 2.81 | 29.5% | 29.5% | 751 | 576 | 76.7% | 95 | 12.7% | 16 | 12.5% | 5 | 2 | -146 | -13.8 |
| 16 - 30 | |||||||||||||||||||||||||||||
| All Oppo | 45.9% | 830 | 41 | 38.7% | 18 | 4 | 4 | 4 | 15 | 3 | 2 | 1 | 1.40 | 1.40 | 1.68 | 2.87 | 48.8% | 48.8% | 507 | 408 | 80.5% | 62 | 12.2% | 23 | 30.4% | 8 | 2 | -137 | -16.5 |
| Liverpool | 54.1% | 979 | 50 | 61.3% | 27 | 11 | 8 | 3 | 14 | 13 | 3 | 2 | 2.11 | 2.11 | 3.08 | 3.59 | 58.8% | 58.8% | 669 | 573 | 85.7% | 60 | 9.0% | 33 | 18.2% | 10 | 1 | -89 | -9.1 |
| 31 - 45 | |||||||||||||||||||||||||||||
| All Oppo | 48.5% | 956 | 45 | 41.0% | 22 | 10 | 6 | 2 | 14 | 8 | 1 | 1 | 1.44 | 1.44 | 1.18 | 3.43 | 41.9% | 41.9% | 640 | 513 | 80.2% | 89 | 13.9% | 21 | 14.3% | 7 | 1 | -134 | -14.0 |
| Liverpool | 51.5% | 1,014 | 48 | 59.0% | 24 | 11 | 6 | 1 | 12 | 12 | 2 | 0 | 1.39 | 1.39 | 0.51 | 3.85 | 36.1% | 36.1% | 689 | 582 | 84.5% | 68 | 9.9% | 32 | 25.0% | 11 | 2 | -124 | -12.2 |
| 46 - 60 | |||||||||||||||||||||||||||||
| All Oppo | 41.7% | 815 | 34 | 31.1% | 15 | 10 | 3 | 1 | 9 | 6 | 2 | 1 | 1.34 | 1.34 | 1.57 | 2.19 | 61.1% | 61.1% | 477 | 356 | 74.6% | 81 | 17.0% | 18 | 16.7% | 3 | 1 | -114 | -14.0 |
| Liverpool | 58.3% | 1,139 | 44 | 68.9% | 32 | 9 | 9 | 4 | 21 | 11 | 4 | 3 | 4.00 | 4.00 | 3.22 | 4.37 | 91.5% | 91.5% | 782 | 661 | 84.5% | 73 | 9.3% | 35 | 20.0% | 7 | 1 | -151 | -13.3 |
| 61 - 75 | |||||||||||||||||||||||||||||
| All Oppo | 48.2% | 832 | 45 | 50.7% | 22 | 8 | 9 | 2 | 14 | 8 | 3 | 3 | 2.32 | 1.53 | 2.68 | 3.17 | 73.2% | 48.2% | 550 | 446 | 81.1% | 83 | 15.1% | 26 | 34.6% | 7 | 1 | -118 | -14.2 |
| Liverpool | 51.8% | 895 | 42 | 49.3% | 19 | 5 | 7 | 1 | 11 | 8 | 0 | 2 | 1.55 | 1.55 | 1.85 | 2.67 | 57.9% | 57.9% | 604 | 511 | 84.6% | 71 | 11.8% | 24 | 8.3% | 7 | 3 | -92 | -10.3 |
| 76 - 90 | |||||||||||||||||||||||||||||
| All Oppo | 52.1% | 877 | 26 | 48.5% | 15 | 6 | 2 | 2 | 6 | 9 | 2 | 1 | 1.80 | 1.80 | 1.20 | 2.68 | 67.1% | 67.1% | 601 | 488 | 81.2% | 73 | 12.2% | 26 | 19.2% | 5 | 0 | -119 | -13.6 |
| Liverpool | 47.9% | 807 | 35 | 51.5% | 20 | 5 | 3 | 2 | 15 | 5 | 1 | 1 | 1.34 | 1.34 | 1.69 | 2.87 | 46.7% | 46.7% | 521 | 437 | 83.9% | 58 | 11.1% | 22 | 22.7% | 4 | 0 | -124 | -15.4 |
| 90 + | |||||||||||||||||||||||||||||
| All Oppo | 52.3% | 255 | 4 | 49.7% | 6 | 2 | 1 | 0 | 2 | 4 | 0 | 0 | 0.19 | 0.19 | 0.13 | 0.56 | 34.2% | 34.2% | 169 | 135 | 79.9% | 27 | 16.0% | 3 | 0.0% | 2 | 1 | -40 | -15.7 |
| Liverpool | 47.7% | 233 | 12 | 50.3% | 7 | 3 | 3 | 0 | 4 | 3 | 2 | 1 | 1.28 | 0.49 | 1.13 | 0.98 | 130.6% | 50.0% | 140 | 116 | 82.9% | 20 | 14.3% | 10 | 20.0% | 1 | 0 | -28 | -12.0 |
| X @Barts78 · Bluesky @barts78 · Mastodon @DrBarts · GitHub Barts78 · LinkedIn Phil-barter · Data: Opta | |||||||||||||||||||||||||||||
| Season Summary - By Game State | |||||||||||||||||||||||||||||
| Up to Liverpool vs Arsenal - 01-11-2026 | |||||||||||||||||||||||||||||
Possession
|
Shots
|
Threat
|
Passes
|
Possession Control | Poss Control /100 Touches | ||||||||||||||||||||||||
|---|---|---|---|---|---|---|---|---|---|---|---|---|---|---|---|---|---|---|---|---|---|---|---|---|---|---|---|---|---|
| Possession % | Touches | PKBox Touches | Field Tilt % | Total Shots | OFF Shots | SoT | 6yrd box Shots | PK Box Shots | Outside Box Shots | BCs | Goals | xG | NPxG | xGOT | EPV | EPV % xG Con. | EPV % NPxG Con. | Attempted Passes | Successful Passes | Pass Success % | Long Passes | Long Ball Rate | Crosses | Cross Success % | Corners | Short Corners | |||
| Away Garbage Time | |||||||||||||||||||||||||||||
| All Oppo | 53.1% | 823 | 29 | 58.7% | 22 | 9 | 6 | 3 | 7 | 15 | 1 | 1 | 1.77 | 1.77 | 1.68 | 2.60 | 68.0% | 68.0% | 609 | 532 | 87.4% | 52 | 8.5% | 17 | 35.3% | 6 | 1 | -84 | -10.2 |
| Liverpool | 46.9% | 728 | 17 | 41.3% | 9 | 1 | 6 | 0 | 3 | 6 | 0 | 0 | 0.53 | 0.53 | 2.20 | 2.06 | 25.7% | 25.7% | 508 | 444 | 87.4% | 57 | 11.2% | 9 | 22.2% | 3 | 0 | -65 | -8.9 |
| Away Lead | |||||||||||||||||||||||||||||
| All Oppo | 43.8% | 1,184 | 46 | 35.6% | 18 | 8 | 5 | 2 | 12 | 6 | 0 | 1 | 1.11 | 1.11 | 1.49 | 3.73 | 29.7% | 29.7% | 695 | 510 | 73.4% | 128 | 18.4% | 30 | 26.7% | 6 | 1 | -182 | -15.4 |
| Liverpool | 56.2% | 1,519 | 83 | 64.4% | 35 | 12 | 8 | 2 | 26 | 9 | 2 | 3 | 3.39 | 3.39 | 2.39 | 6.39 | 53.1% | 53.1% | 1033 | 876 | 84.8% | 91 | 8.8% | 60 | 15.0% | 14 | 3 | -194 | -12.8 |
| Draw | |||||||||||||||||||||||||||||
| All Oppo | 46.5% | 2,312 | 95 | 42.6% | 41 | 14 | 12 | 6 | 32 | 9 | 12 | 7 | 5.08 | 4.29 | 5.43 | 7.76 | 65.4% | 55.3% | 1517 | 1176 | 77.5% | 233 | 15.4% | 57 | 15.8% | 21 | 7 | -384 | -16.6 |
| Liverpool | 53.5% | 2,660 | 89 | 57.4% | 54 | 23 | 13 | 4 | 31 | 23 | 6 | 4 | 4.67 | 4.67 | 3.15 | 8.48 | 55.1% | 55.1% | 1858 | 1524 | 82.0% | 203 | 10.9% | 68 | 16.2% | 15 | 4 | -335 | -12.6 |
| Home Garbage Time | |||||||||||||||||||||||||||||
| All Oppo | 62.7% | 657 | 37 | 68.4% | 16 | 8 | 1 | 1 | 9 | 7 | 0 | 0 | 1.09 | 1.09 | 0.09 | 2.58 | 42.3% | 42.3% | 472 | 404 | 85.6% | 45 | 9.5% | 21 | 23.8% | 2 | 0 | -90 | -13.7 |
| Liverpool | 37.3% | 391 | 18 | 31.6% | 8 | 4 | 1 | 2 | 5 | 3 | 0 | 0 | 0.66 | 0.66 | 0.05 | 1.21 | 54.5% | 54.5% | 223 | 157 | 70.4% | 44 | 19.7% | 4 | 50.0% | 4 | 0 | -57 | -14.6 |
| Home Lead | |||||||||||||||||||||||||||||
| All Oppo | 41.2% | 580 | 19 | 26.8% | 13 | 6 | 3 | 1 | 7 | 6 | 2 | 0 | 1.41 | 1.41 | 0.94 | 1.34 | 105.5% | 105.5% | 322 | 237 | 73.6% | 62 | 19.2% | 9 | 11.1% | 2 | 0 | -94 | -16.2 |
| Liverpool | 58.8% | 827 | 53 | 73.2% | 34 | 8 | 11 | 3 | 20 | 14 | 4 | 4 | 3.25 | 2.46 | 4.14 | 3.01 | 108.0% | 81.7% | 534 | 455 | 85.2% | 50 | 9.4% | 31 | 25.8% | 9 | 2 | -103 | -12.5 |
| X @Barts78 · Bluesky @barts78 · Mastodon @DrBarts · GitHub Barts78 · LinkedIn Phil-barter · Data: Opta | |||||||||||||||||||||||||||||
| Season Summary - By Match Day | ||||||||||||||||||||||||||||||
| Up to Liverpool vs Arsenal - 01-11-2026 | ||||||||||||||||||||||||||||||
| Fixture |
Possession
|
Shots
|
Threat
|
Passes
|
Possession Control | Poss Control /100 Touches | ||||||||||||||||||||||||
|---|---|---|---|---|---|---|---|---|---|---|---|---|---|---|---|---|---|---|---|---|---|---|---|---|---|---|---|---|---|---|
| Possession % | Touches | PKBox Touches | Field Tilt % | Total Shots | OFF Shots | SoT | 6yrd box Shots | PK Box Shots | Outside Box Shots | BCs | Goals | xG | NPxG | xGOT | EPV | EPV % xG Con. | EPV % NPxG Con. | Attempted Passes | Successful Passes | Pass Success % | Long Passes | Long Ball Rate | Crosses | Cross Success % | Corners | Short Corners | ||||
| 1 | ||||||||||||||||||||||||||||||
| All Oppo | Newcastle vs Liverpool | 43.8% | 518 | 16 | 31.2% | 13 | 5 | 4 | 1 | 6 | 7 | 3 | 2 | 1.43 | 1.43 | 1.30 | 1.23 | 116.1% | 116.1% | 292 | 222 | 76.0% | 50 | 17.1% | 8 | 12.5% | 2 | 0 | -72 | -13.9 |
| Liverpool | Newcastle vs Liverpool | 56.2% | 666 | 39 | 68.8% | 27 | 4 | 7 | 2 | 16 | 11 | 3 | 2 | 2.74 | 1.95 | 2.73 | 2.24 | 122.3% | 87.1% | 440 | 370 | 84.1% | 47 | 10.7% | 27 | 25.9% | 6 | 0 | -91 | -13.7 |
| 2 | ||||||||||||||||||||||||||||||
| All Oppo | Liverpool vs Nottingham Forest | 37.2% | 520 | 23 | 28.1% | 12 | 3 | 3 | 3 | 11 | 1 | 5 | 2 | 2.30 | 1.51 | 1.28 | 1.89 | 121.5% | 79.8% | 288 | 193 | 67.0% | 75 | 26.0% | 7 | 28.6% | 5 | 0 | -84 | -16.2 |
| Liverpool | Liverpool vs Nottingham Forest | 62.8% | 878 | 23 | 71.9% | 13 | 5 | 4 | 1 | 8 | 5 | 1 | 2 | 1.73 | 1.73 | 2.02 | 3.38 | 51.2% | 51.2% | 631 | 562 | 89.1% | 46 | 7.3% | 30 | 16.7% | 3 | 1 | -97 | -11.0 |
| 3 | ||||||||||||||||||||||||||||||
| All Oppo | Ipswich vs Liverpool | 45.4% | 620 | 16 | 43.0% | 14 | 5 | 5 | 2 | 4 | 10 | 0 | 0 | 0.76 | 0.76 | 0.76 | 1.92 | 39.6% | 39.6% | 428 | 357 | 83.4% | 41 | 9.6% | 15 | 26.7% | 4 | 0 | -83 | -13.4 |
| Liverpool | Ipswich vs Liverpool | 54.6% | 745 | 20 | 57.0% | 10 | 1 | 7 | 0 | 5 | 5 | 0 | 2 | 0.67 | 0.67 | 1.94 | 2.32 | 28.9% | 28.9% | 531 | 471 | 88.7% | 54 | 10.2% | 11 | 27.3% | 3 | 0 | -60 | -8.1 |
| 4 | ||||||||||||||||||||||||||||||
| All Oppo | Liverpool vs Fulham | 45.6% | 592 | 25 | 36.5% | 10 | 3 | 3 | 0 | 8 | 2 | 1 | 0 | 0.71 | 0.71 | 0.82 | 1.56 | 45.4% | 45.4% | 394 | 303 | 76.9% | 60 | 15.2% | 16 | 18.8% | 8 | 1 | -93 | -15.7 |
| Liverpool | Liverpool vs Fulham | 54.4% | 705 | 18 | 63.5% | 14 | 6 | 3 | 2 | 9 | 5 | 4 | 0 | 1.13 | 1.13 | 0.66 | 2.38 | 47.5% | 47.5% | 495 | 413 | 83.4% | 52 | 10.5% | 25 | 20.0% | 5 | 1 | -87 | -12.3 |
| 5 | ||||||||||||||||||||||||||||||
| All Oppo | Bournemouth vs Liverpool | 46.7% | 612 | 27 | 53.6% | 9 | 5 | 2 | 2 | 5 | 4 | 1 | 0 | 0.76 | 0.76 | 1.04 | 2.59 | 29.4% | 29.4% | 382 | 297 | 77.7% | 53 | 13.9% | 27 | 22.2% | 3 | 1 | -109 | -17.8 |
| Liverpool | Bournemouth vs Liverpool | 53.3% | 699 | 19 | 46.4% | 12 | 3 | 3 | 0 | 7 | 5 | 1 | 1 | 1.58 | 1.58 | 1.13 | 2.05 | 77.2% | 77.2% | 474 | 384 | 81.0% | 60 | 12.7% | 13 | 7.7% | 3 | 0 | -86 | -12.3 |
| 6 | ||||||||||||||||||||||||||||||
| All Oppo | Liverpool vs Man City | 61.2% | 746 | 28 | 62.7% | 15 | 7 | 4 | 1 | 8 | 7 | 2 | 3 | 1.31 | 1.31 | 1.68 | 2.15 | 60.9% | 60.9% | 551 | 489 | 88.7% | 50 | 9.1% | 12 | 16.7% | 6 | 3 | -79 | -10.6 |
| Liverpool | Liverpool vs Man City | 38.8% | 473 | 16 | 37.3% | 13 | 3 | 6 | 1 | 6 | 7 | 0 | 0 | 0.87 | 0.87 | 0.93 | 1.39 | 62.5% | 62.5% | 296 | 238 | 80.4% | 40 | 13.5% | 13 | 15.4% | 5 | 0 | -58 | -12.3 |
| 7 | ||||||||||||||||||||||||||||||
| All Oppo | Brentford vs Liverpool | 42.7% | 538 | 27 | 32.8% | 10 | 4 | 2 | 1 | 9 | 1 | 1 | 1 | 0.87 | 0.87 | 1.21 | 1.63 | 53.3% | 53.3% | 329 | 244 | 74.2% | 61 | 18.5% | 16 | 12.5% | 3 | 2 | -88 | -16.4 |
| Liverpool | Brentford vs Liverpool | 57.3% | 723 | 39 | 67.2% | 21 | 12 | 5 | 1 | 10 | 11 | 1 | 2 | 1.52 | 1.52 | 1.27 | 2.37 | 64.2% | 64.2% | 499 | 413 | 82.8% | 45 | 9.0% | 15 | 13.3% | 9 | 6 | -93 | -12.9 |
| 8 | ||||||||||||||||||||||||||||||
| All Oppo | Liverpool vs Brighton | 59.8% | 808 | 40 | 61.8% | 17 | 9 | 1 | 1 | 10 | 7 | 1 | 0 | 1.33 | 1.33 | 0.09 | 2.95 | 45.1% | 45.1% | 579 | 485 | 83.8% | 65 | 11.2% | 23 | 21.7% | 2 | 0 | -122 | -15.1 |
| Liverpool | Liverpool vs Brighton | 40.2% | 544 | 31 | 38.2% | 13 | 6 | 4 | 3 | 10 | 3 | 1 | 2 | 1.21 | 1.21 | 1.25 | 1.90 | 63.8% | 63.8% | 326 | 225 | 69.0% | 57 | 17.5% | 5 | 40.0% | 4 | 0 | -88 | -16.2 |
| 9 | ||||||||||||||||||||||||||||||
| All Oppo | Liverpool vs Arsenal | 46.5% | 602 | 24 | 38.5% | 10 | 4 | 3 | 2 | 6 | 4 | 1 | 1 | 0.99 | 0.99 | 1.45 | 2.08 | 47.5% | 47.5% | 372 | 269 | 72.3% | 65 | 17.5% | 10 | 40.0% | 4 | 2 | -104 | -17.3 |
| Liverpool | Liverpool vs Arsenal | 53.5% | 692 | 55 | 61.5% | 17 | 8 | 0 | 1 | 14 | 3 | 1 | 0 | 1.05 | 1.05 | 0.00 | 3.14 | 33.5% | 33.5% | 464 | 380 | 81.9% | 44 | 9.5% | 33 | 15.2% | 7 | 1 | -94 | -13.6 |
| X @Barts78 · Bluesky @barts78 · Mastodon @DrBarts · GitHub Barts78 · LinkedIn Phil-barter · Data: Opta | ||||||||||||||||||||||||||||||
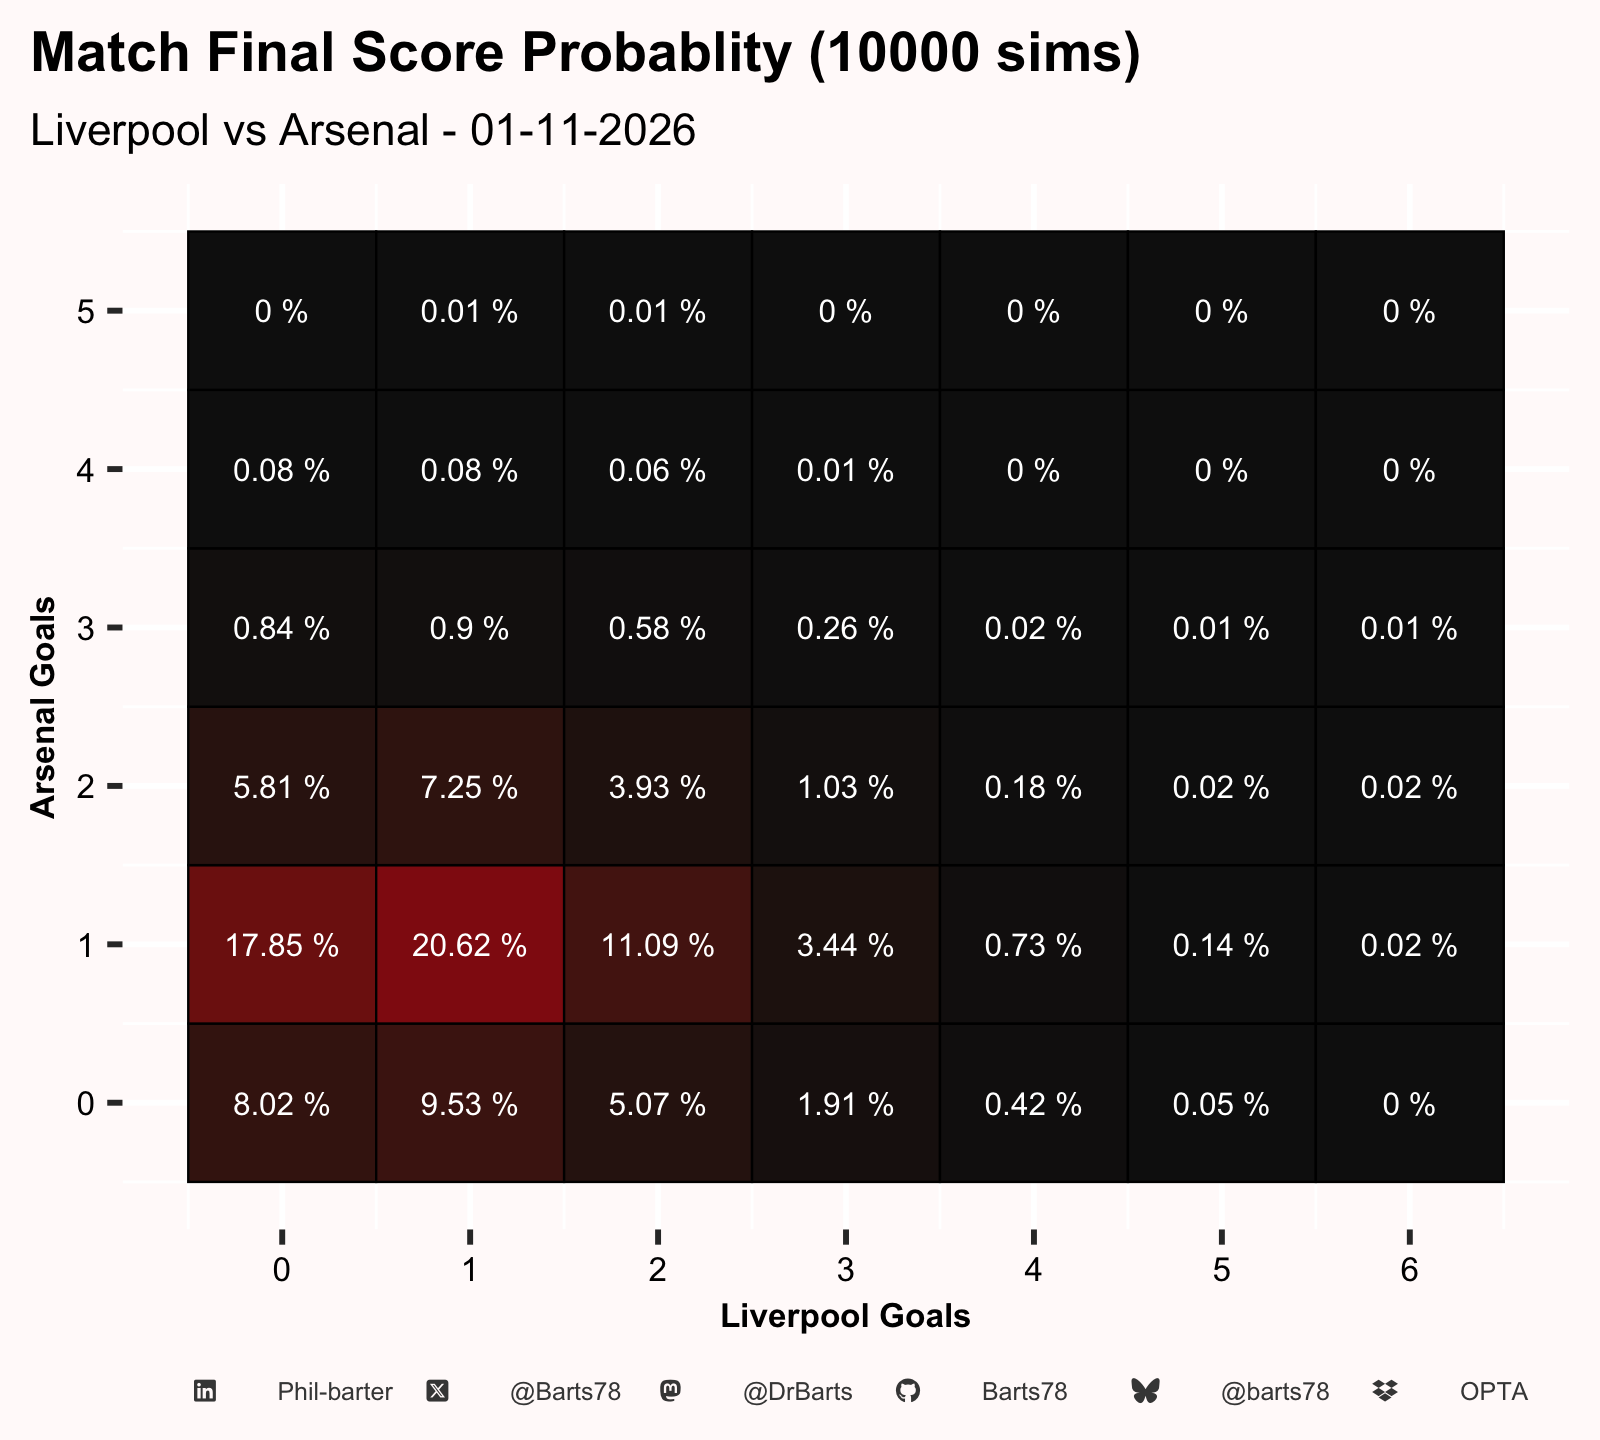
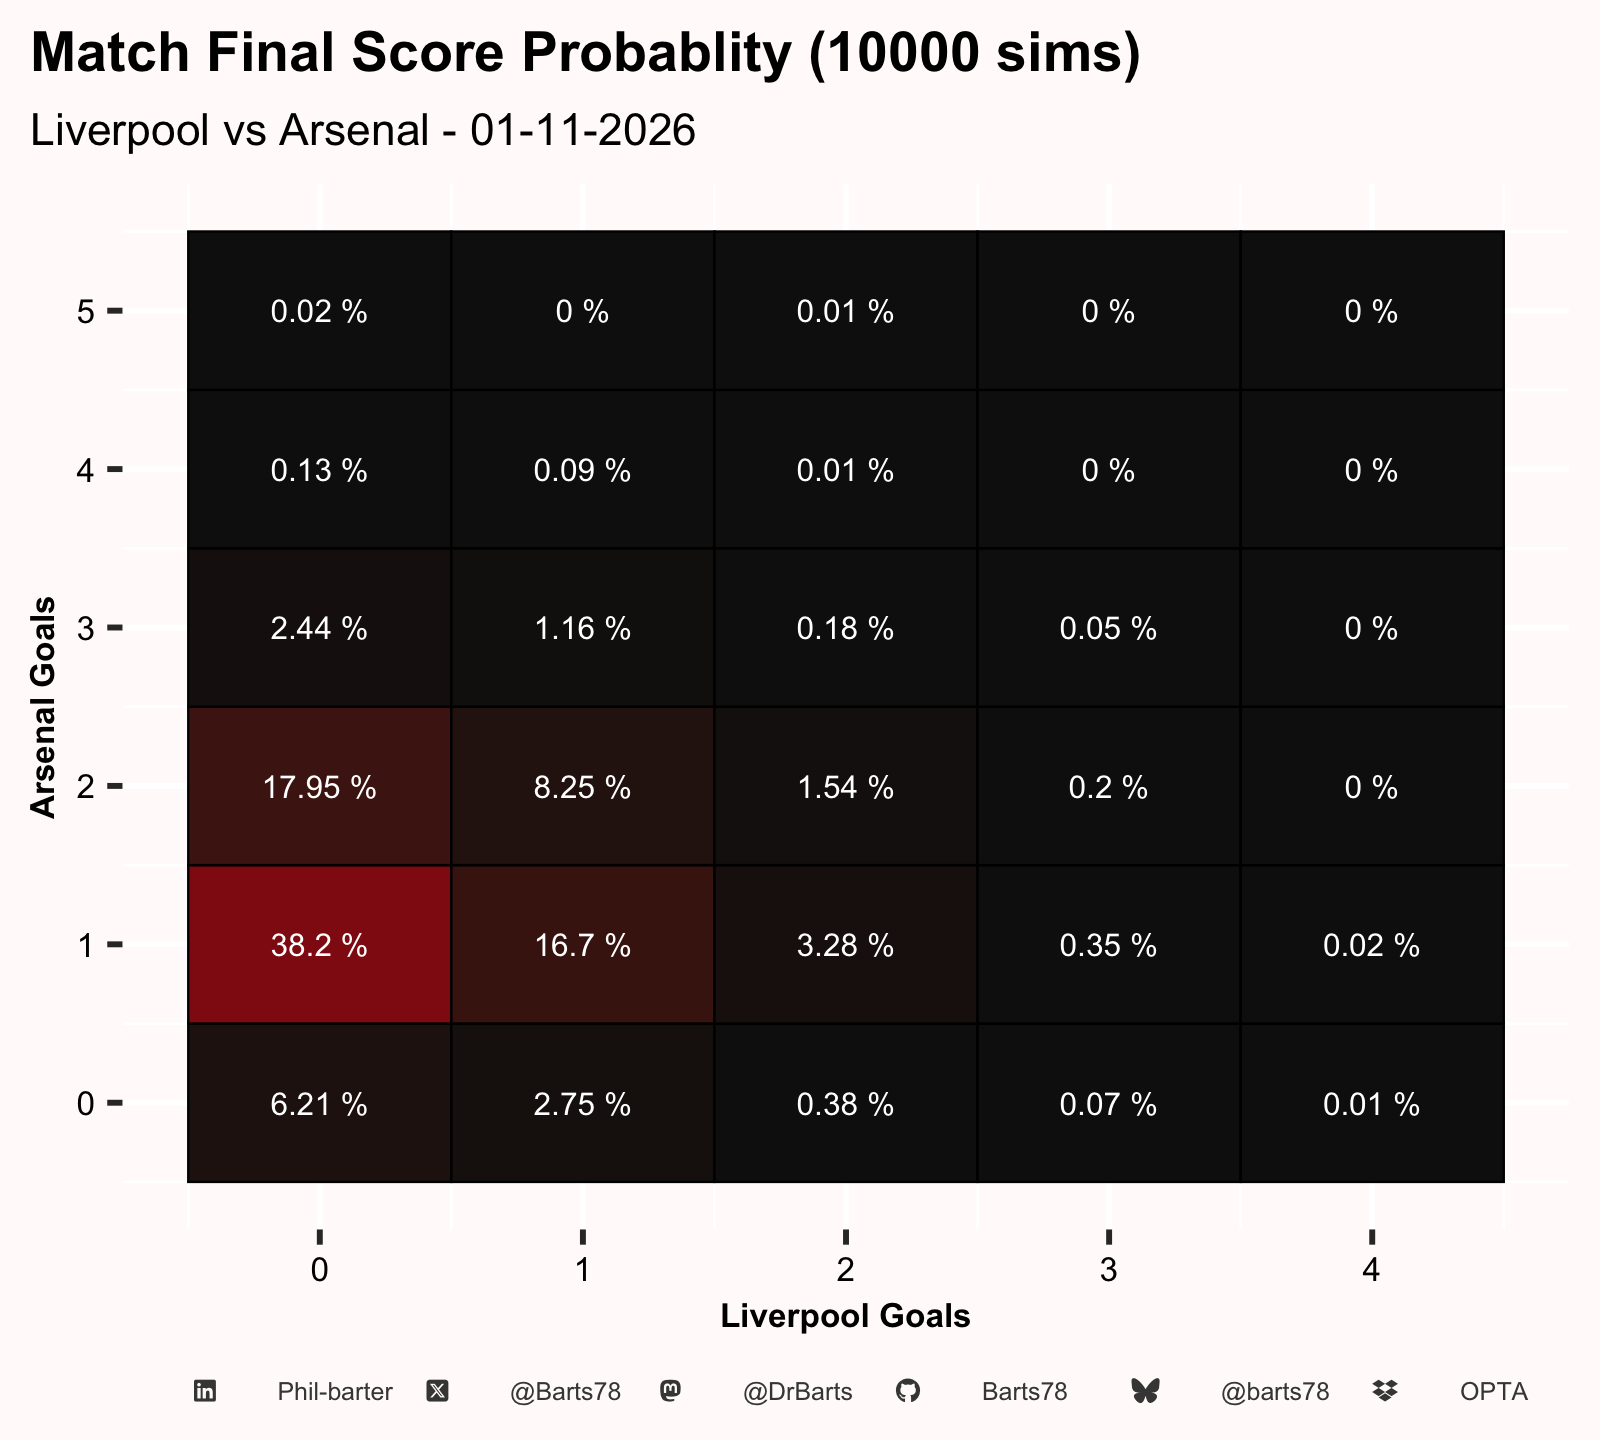
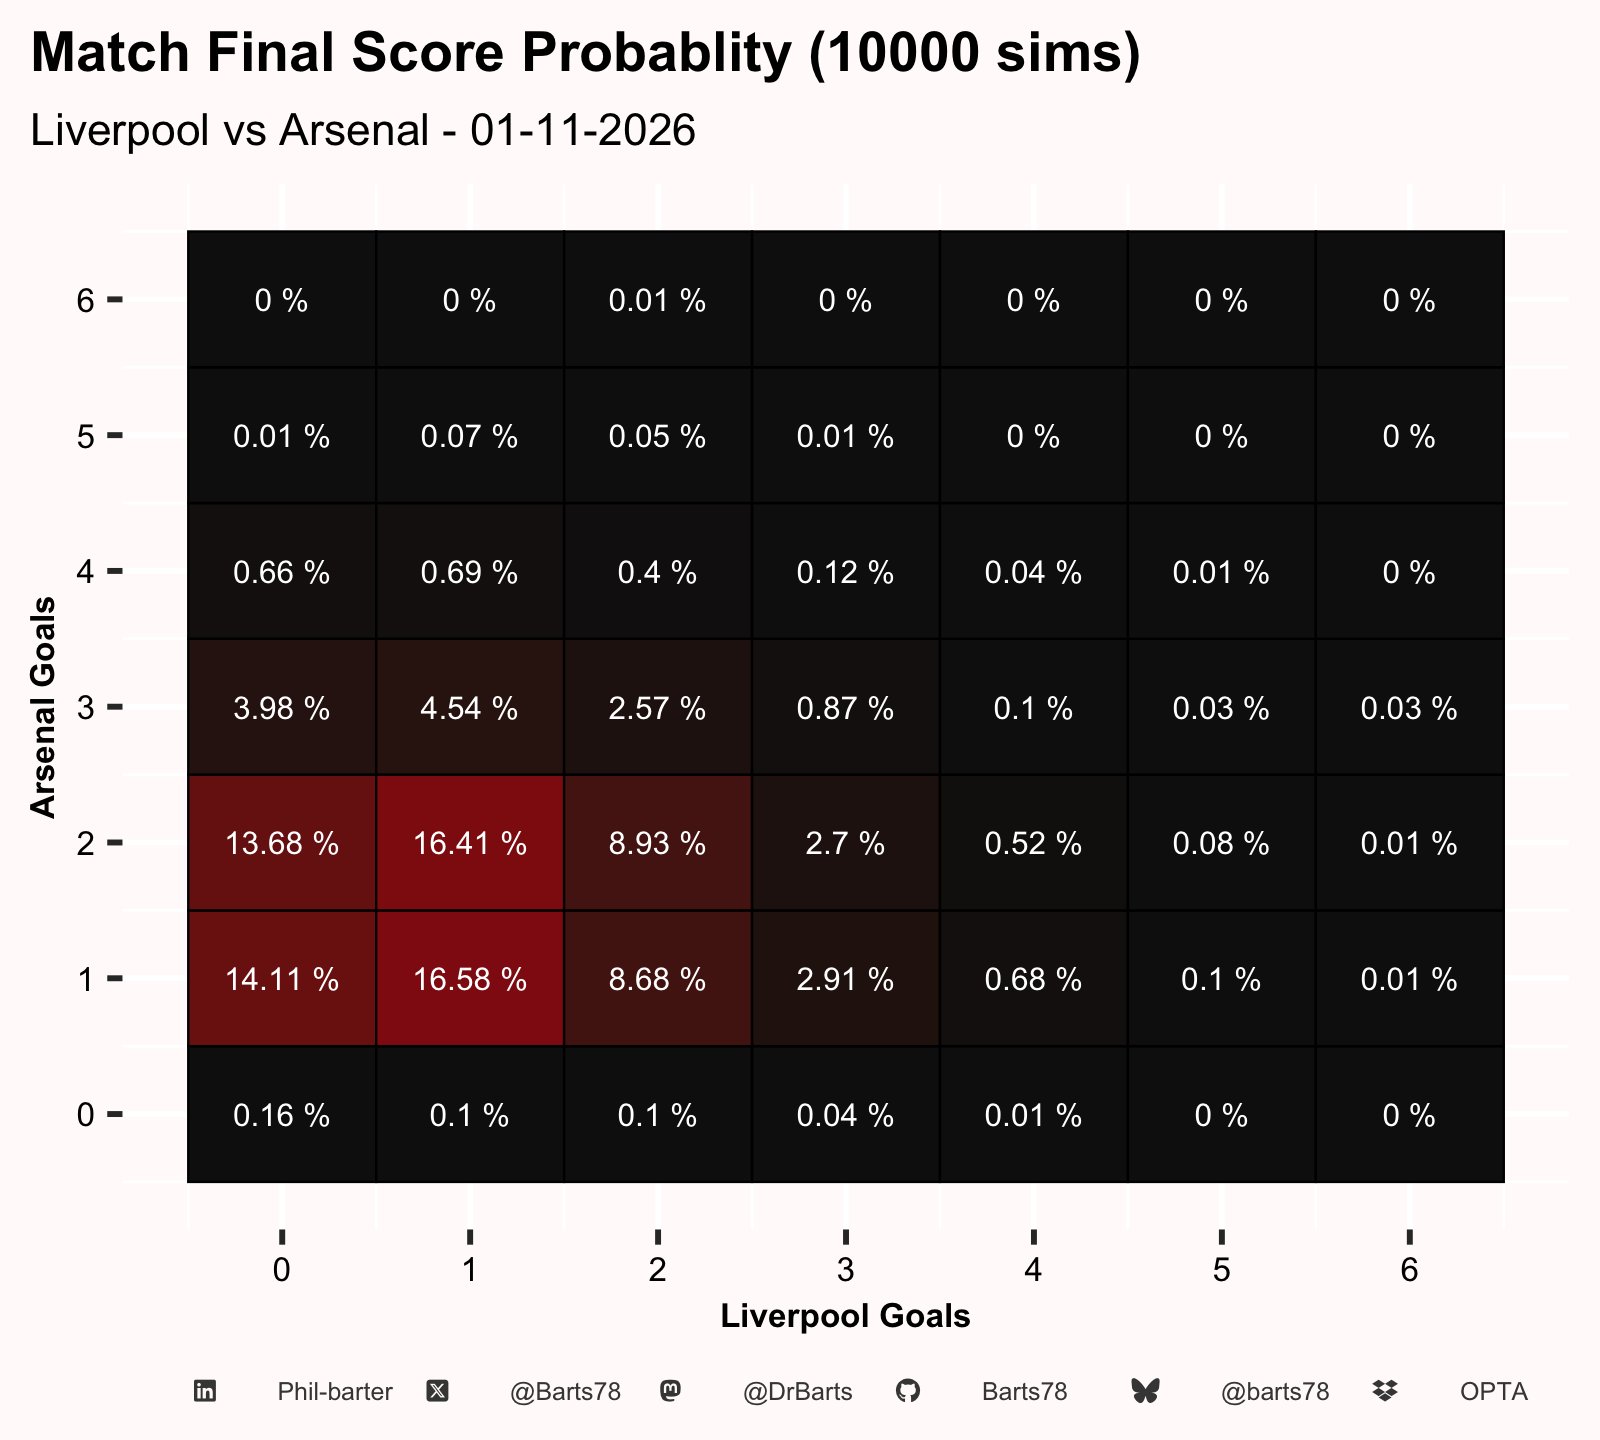
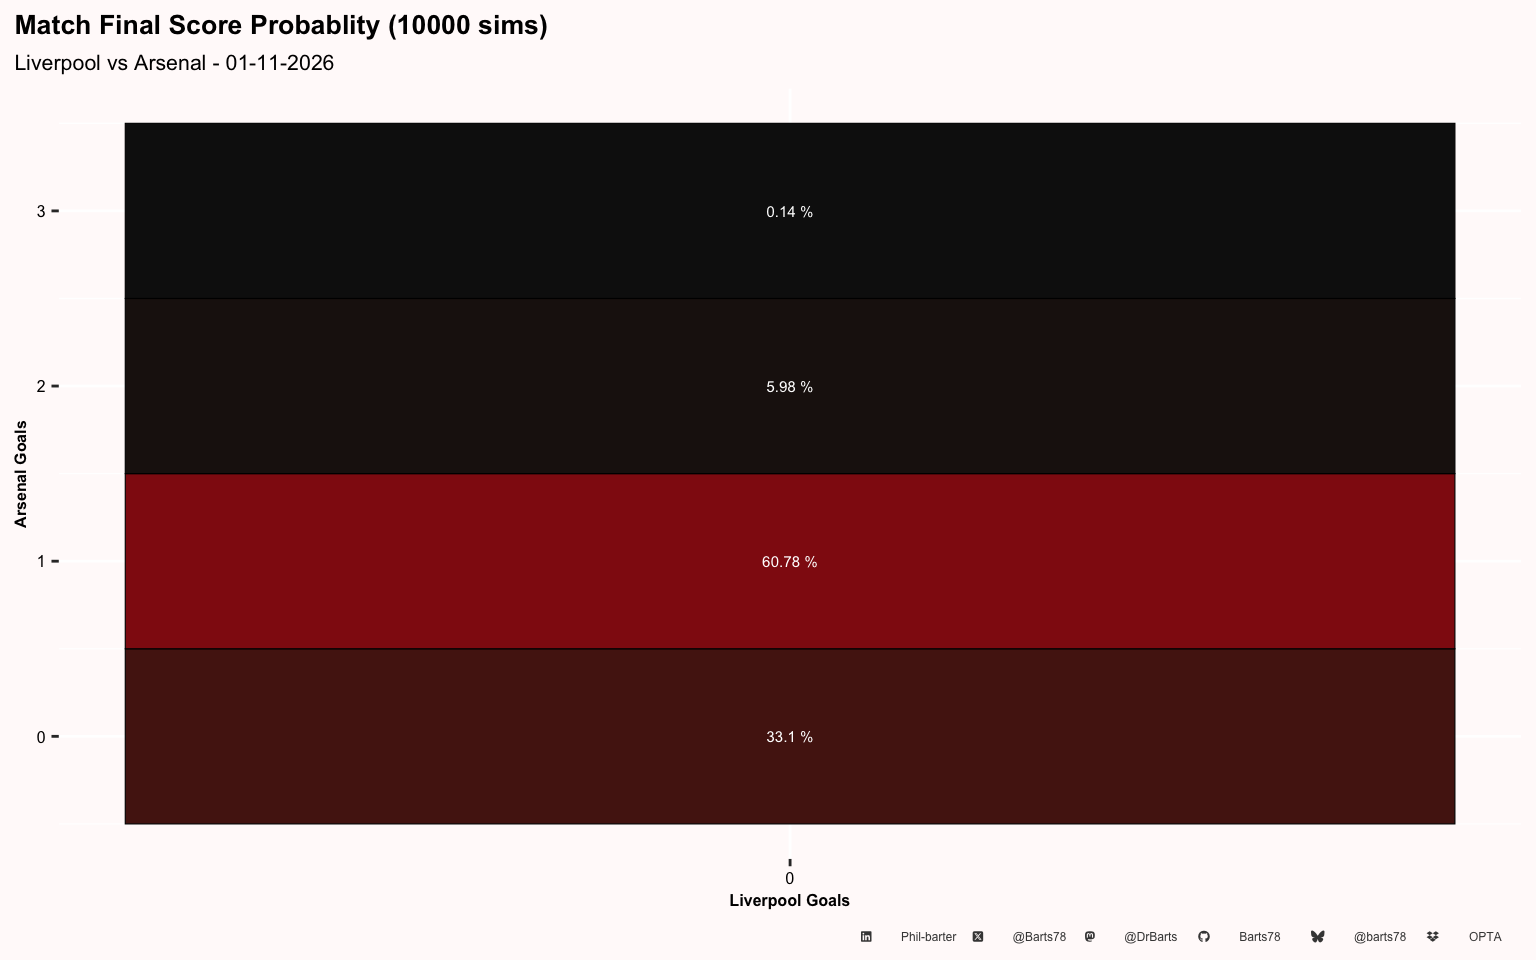
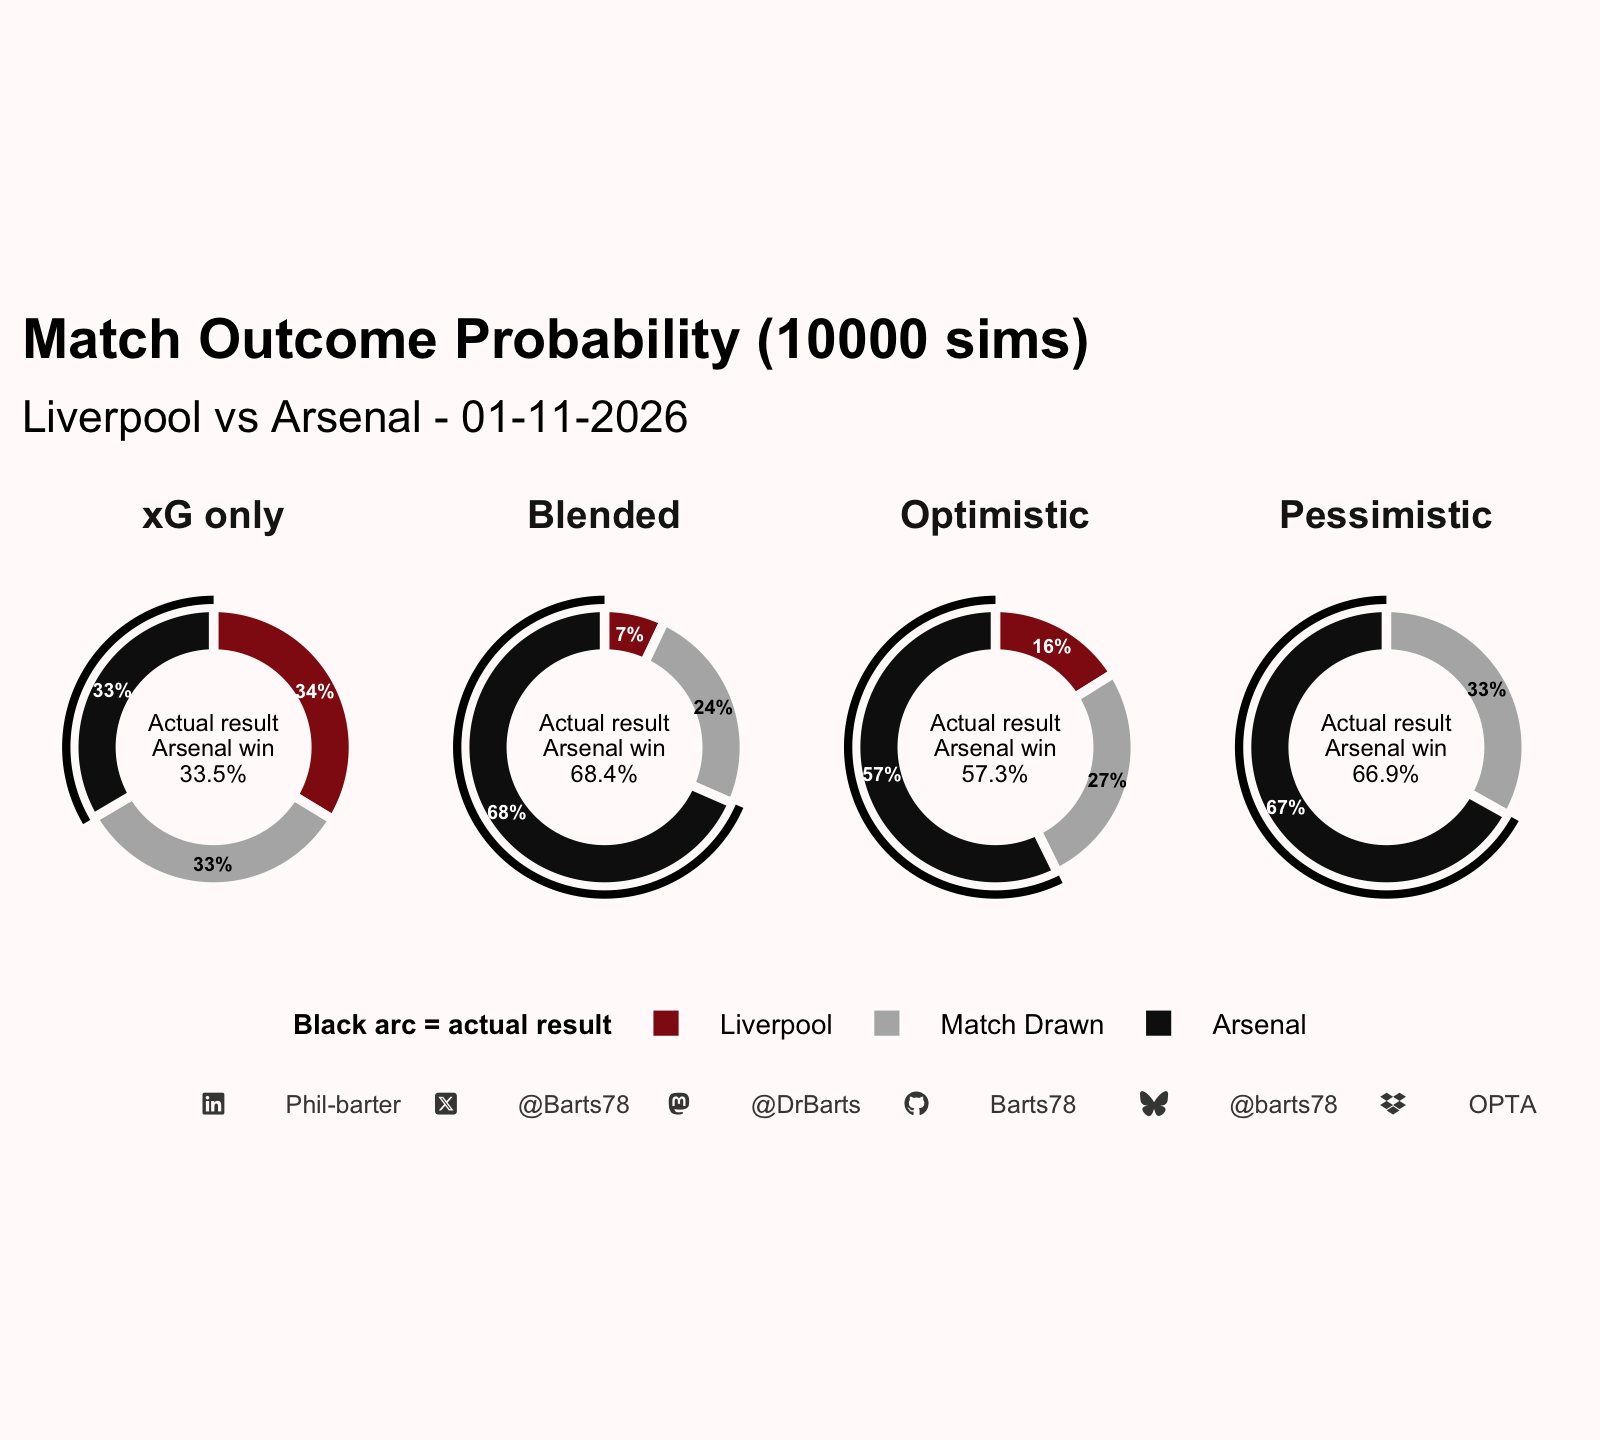
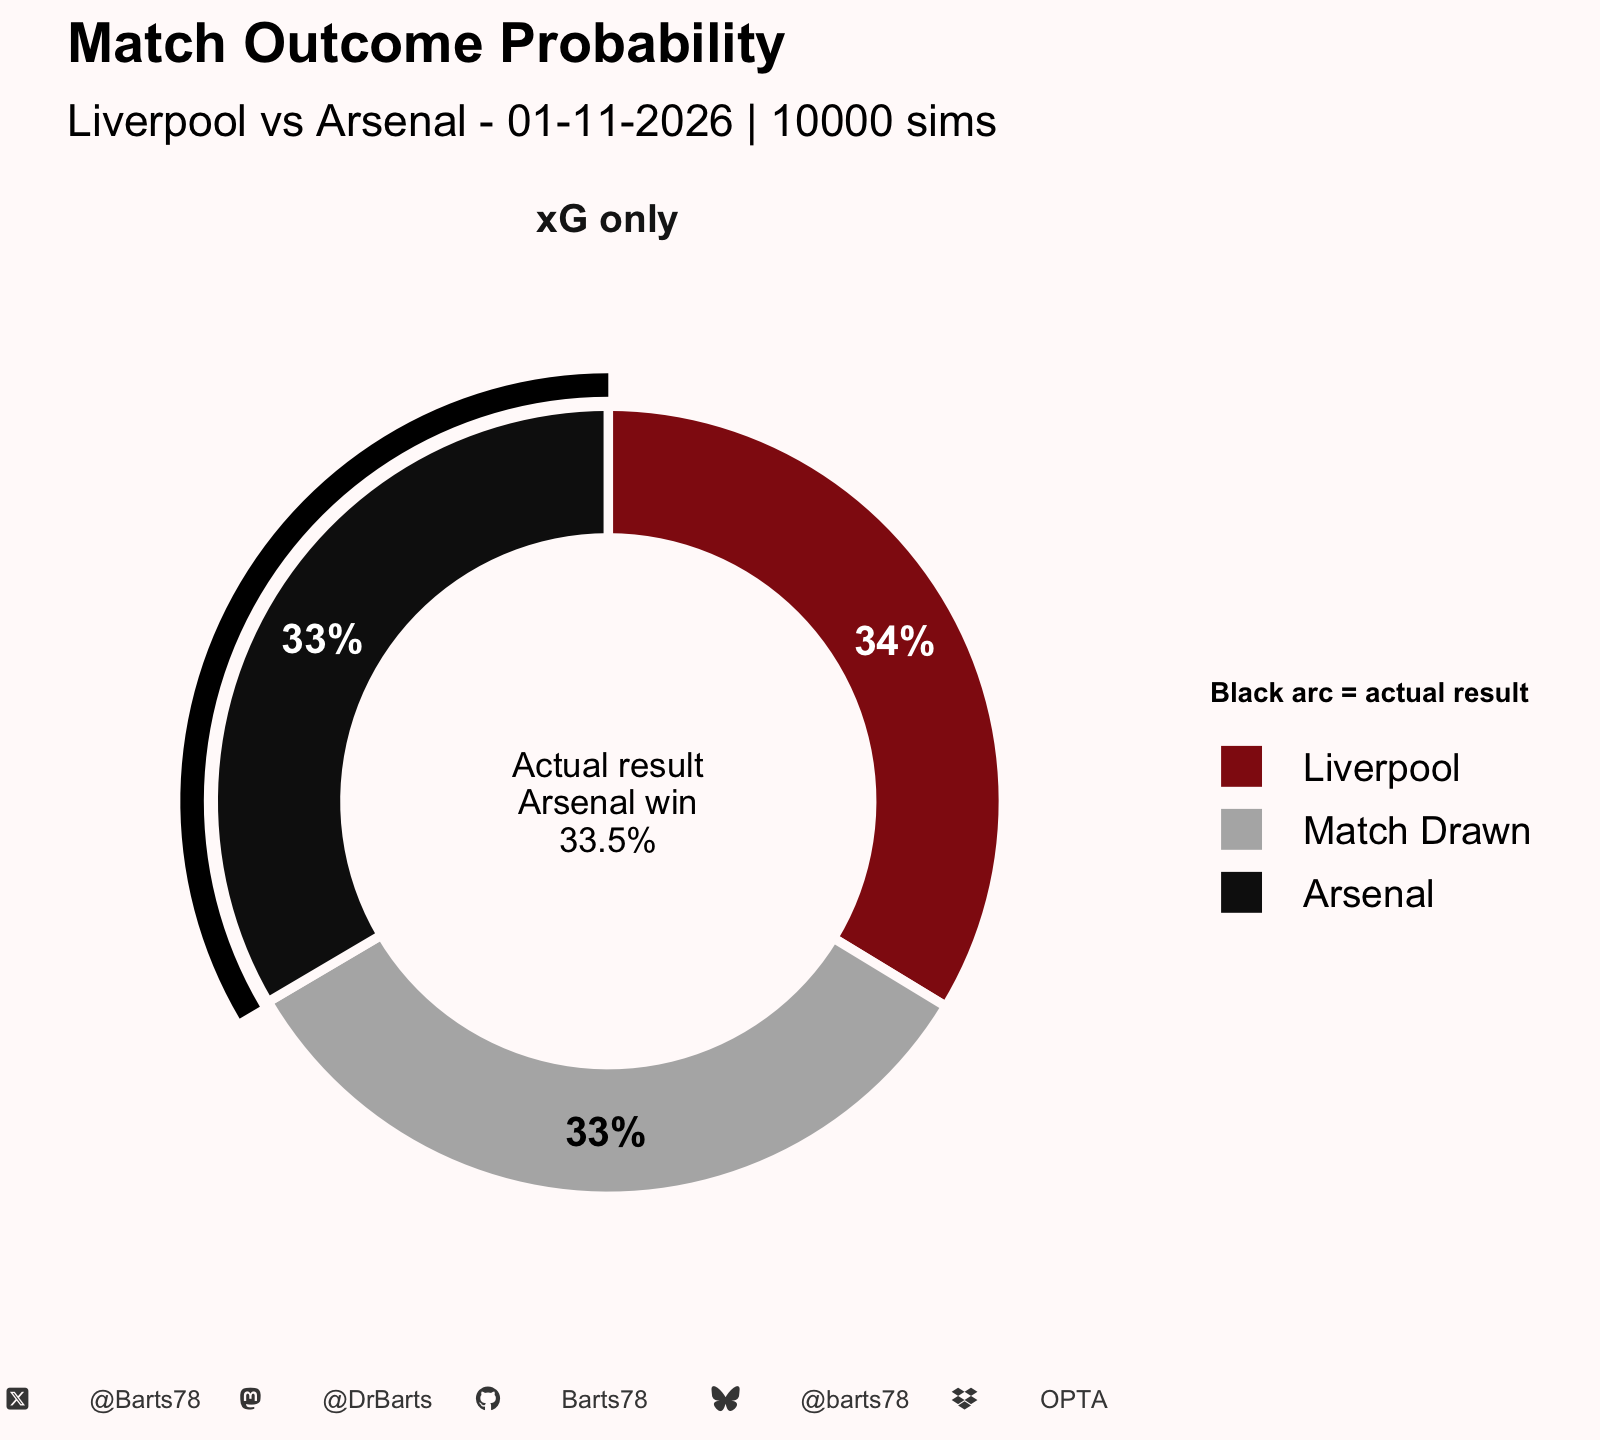
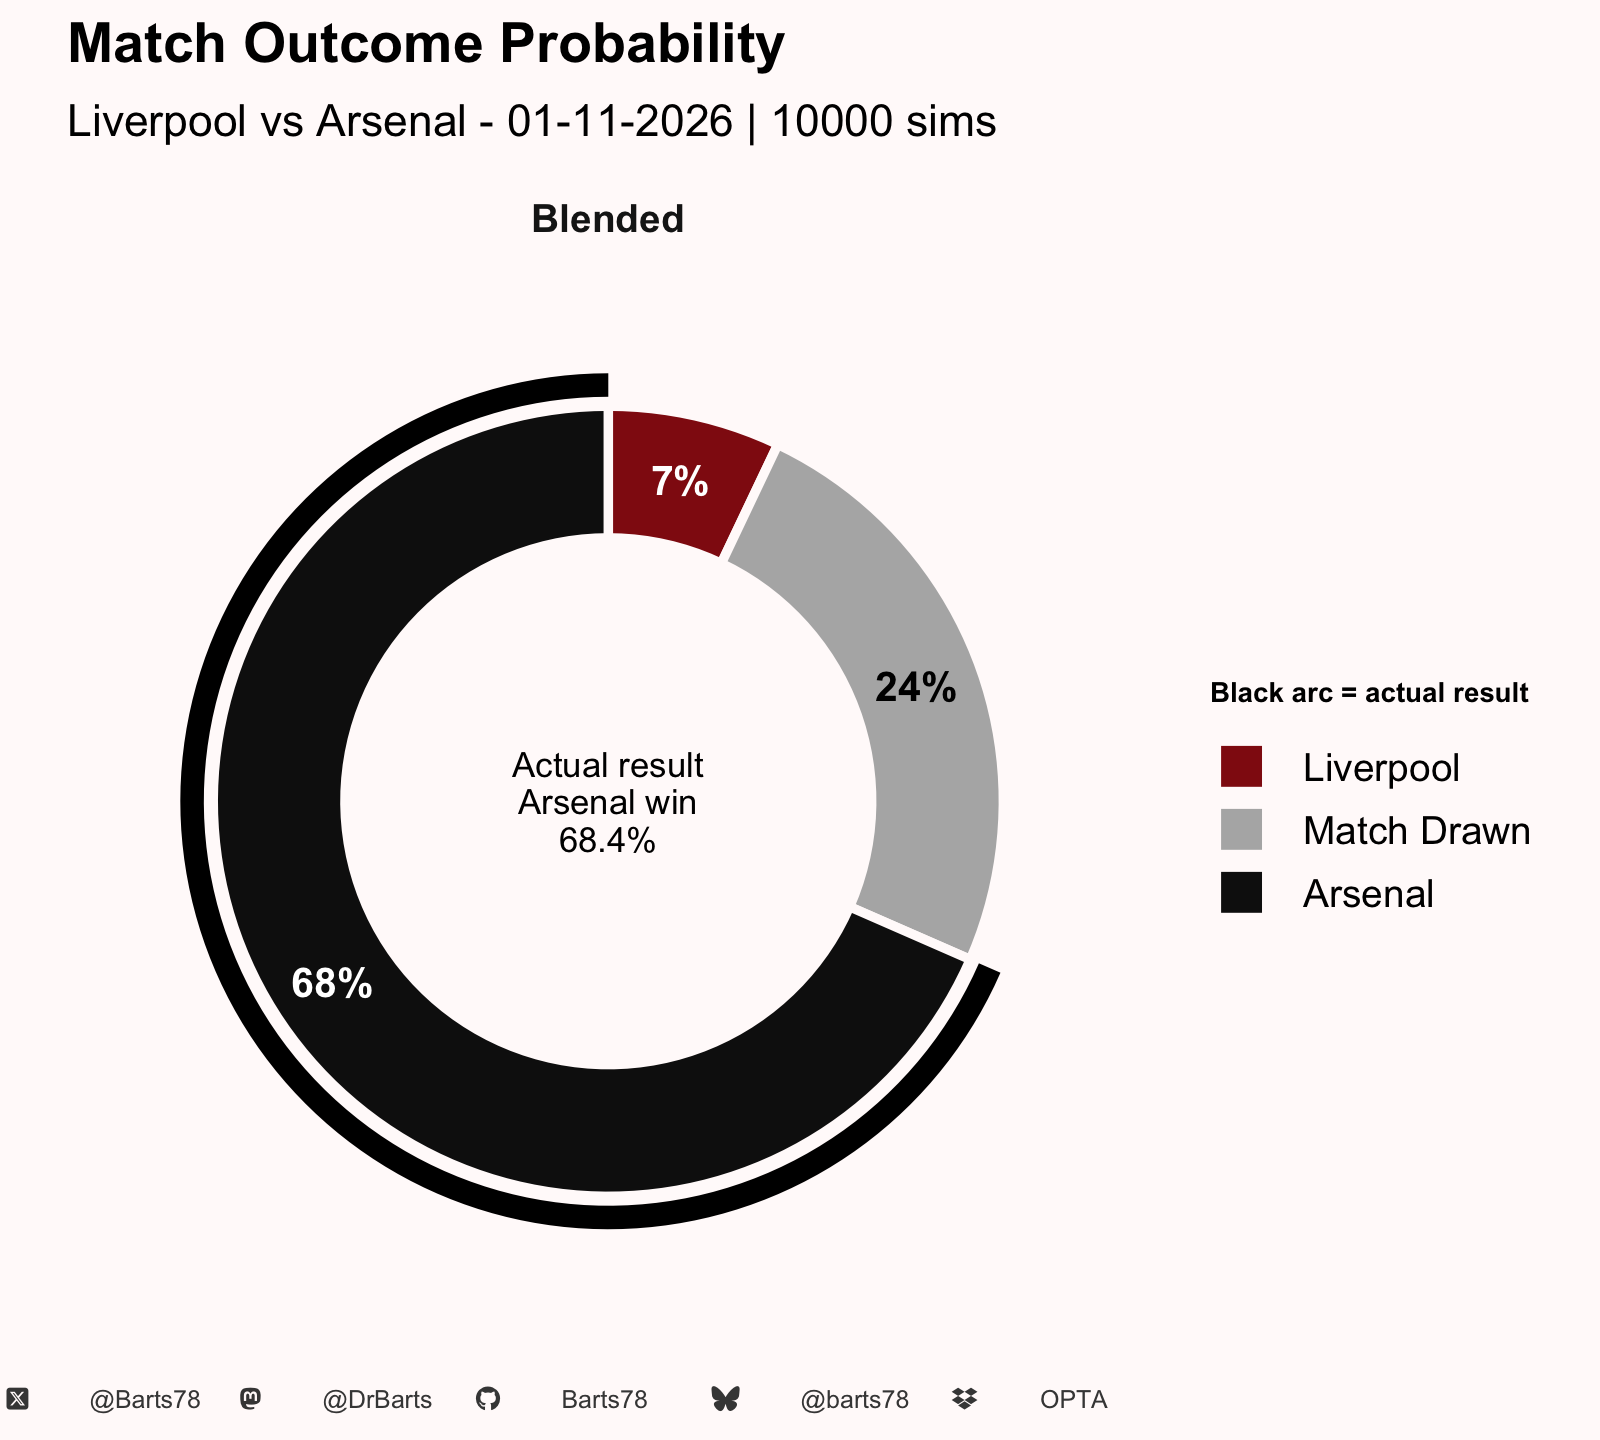
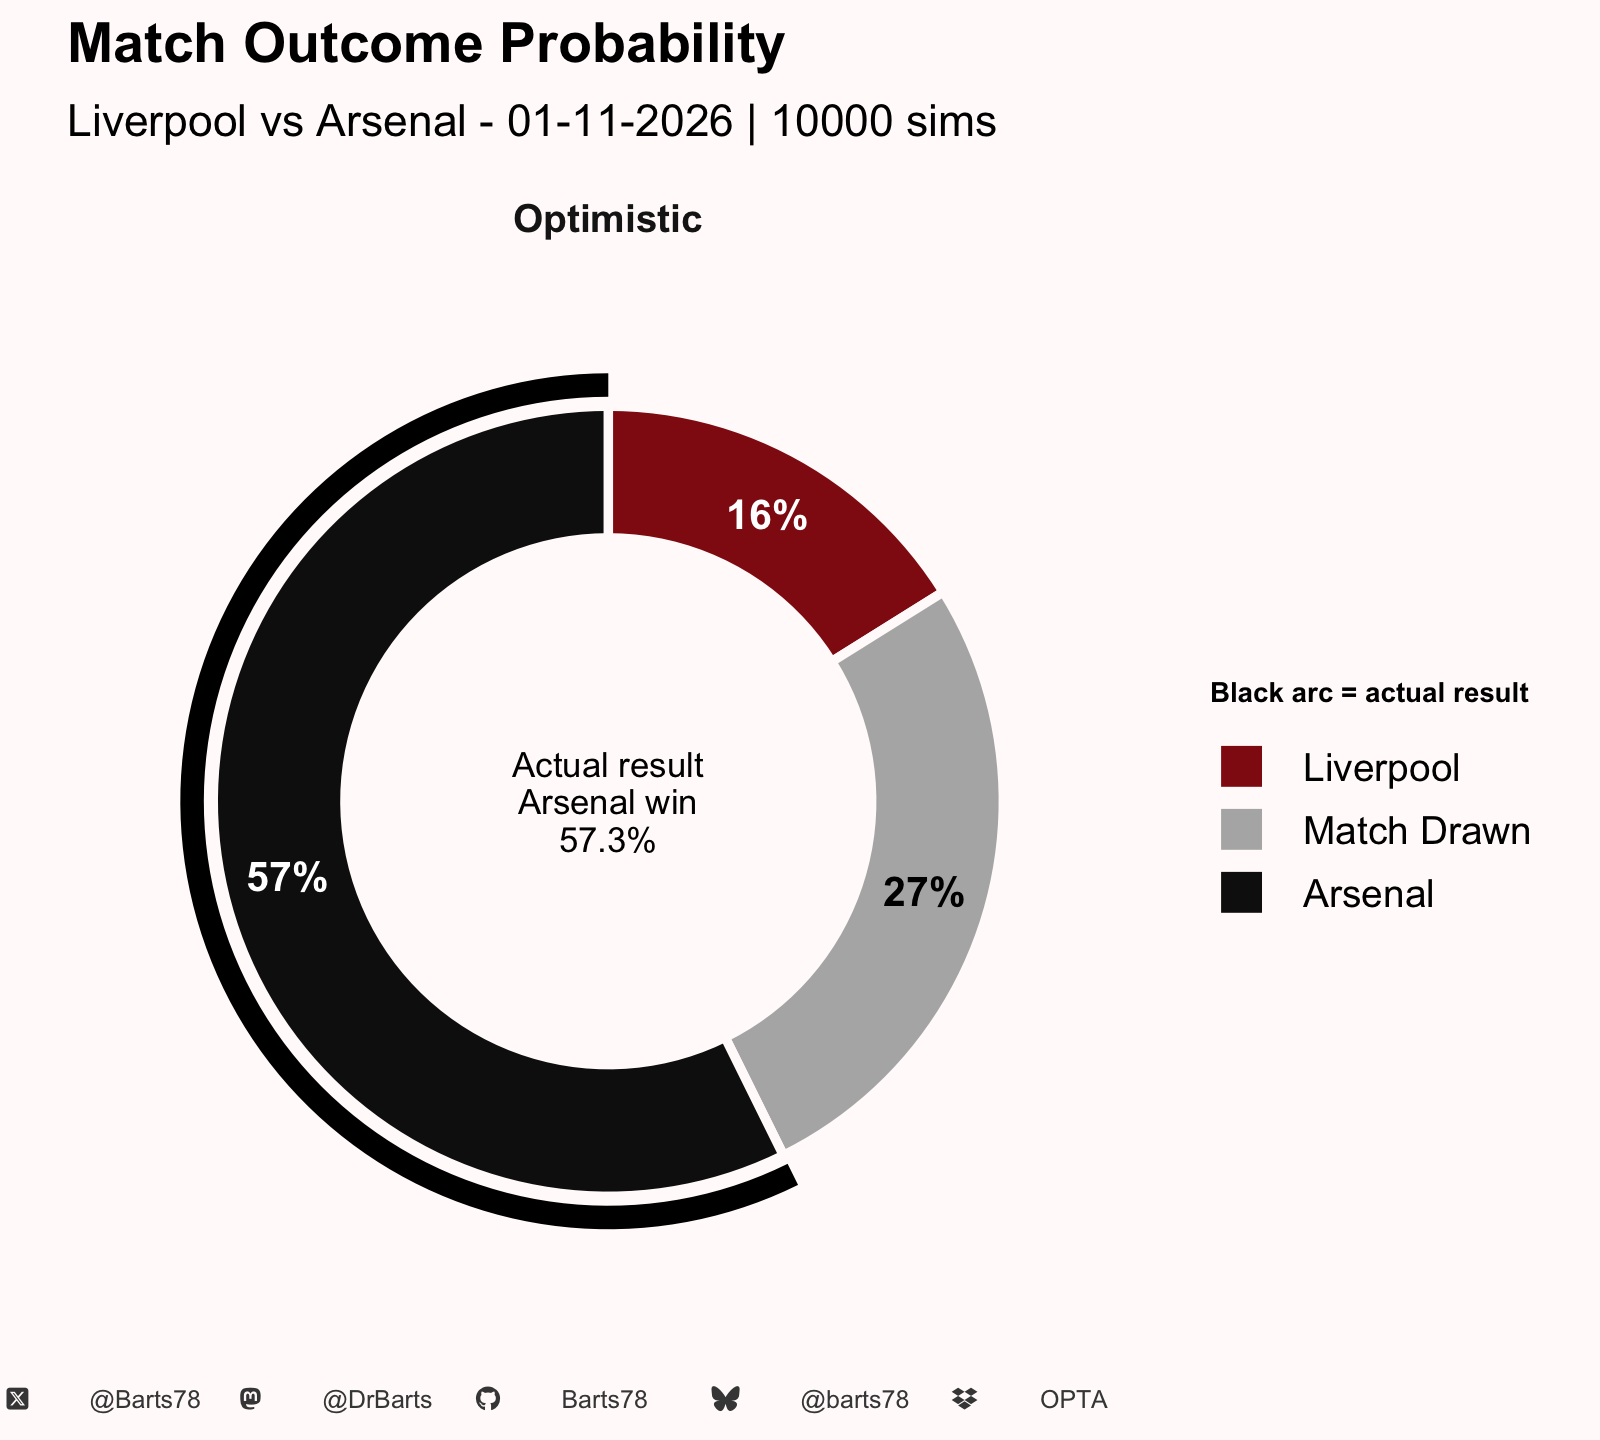
| Substitution Impact - Before and After Each Sub Window | |||||||||||
| Liverpool vs Arsenal - 01-11-2026 | xG and EPV per 10 minutes, field tilt and PPDA within each window | |||||||||||
| Mins | Subs on | Score |
Liverpool
|
Arsenal
|
|||||||
|---|---|---|---|---|---|---|---|---|---|---|---|
| xG/10 | EPV/10 | Field tilt % | PPDA | xG/10 | EPV/10 | Field tilt % | PPDA | ||||
| 0'-60' | 60 | Starting XIs | 0-0 | 0.08 | 0.31 | 60% | 8.72 | 0.15 | 0.24 | 40% | 13.54 |
| 60'-64' | 4 | LIV: Szoboszlai | 0-1 | 0.00 | 0.10 | 80% | 26.00 | 0.00 | 0.19 | 20% | - |
| 64'-69' | 5 | ARS: Lewis-Skelly | 0-1 | 0.36 | 0.08 | 18% | 6.33 | 0.06 | 0.17 | 82% | 3.00 |
| 69'-83' | 14 | LIV: Ngumoha | 0-1 | 0.14 | 0.31 | 57% | 6.33 | 0.06 | 0.26 | 43% | 6.50 |
| 83'-90' | 7 | LIV: Tsimikas, Muñoz, Koumas | ARS: Hincapié, Gyökeres | 0-1 | 0.04 | 0.36 | 89% | 6.00 | 0.00 | 0.09 | 11% | - |
| 90'-99' | 10 | ARS: Merino | 0-1 | 0.14 | 0.49 | 73% | 7.33 | 0.00 | 0.07 | 27% | 12.50 |
| Windows split at each substitution (subs within 3 minutes are grouped). Short windows are noisy, so read alongside the minutes column. | |||||||||||
| X @Barts78 · Bluesky @barts78 · Mastodon @DrBarts · GitHub Barts78 · LinkedIn Phil-barter · Data: Opta | |||||||||||


| Liverpool Open Play Passing connections | |||||||||||||
| Liverpool vs Arsenal - 01-11-2026 | Completed passes only, min 5 per pair. Passer Completion % = all of the passer's attempts | |||||||||||||
| Completed Passes | % of Passer's Completions | % of Receiver's Receptions | Passer Completion % | Long Passes | Final Third Passes | PK Box Passes | Crosses | Key Passes | Prog Passes | EPV | EPV / Pass | Pass Time | |
|---|---|---|---|---|---|---|---|---|---|---|---|---|---|
| Alexis Mac Allister | |||||||||||||
| Dominik Szoboszlai | 6 | 11% | 24% | 87% | 0 | 3 | 1 | 0 | 0 | 0 | 0.039 | 0.006 | 2.83 |
| Jérémy Jacquet | 10 | 19% | 26% | 87% | 0 | 4 | 0 | 0 | 0 | 0 | 0.019 | 0.002 | 2.10 |
| Trey Nyoni | 8 | 15% | 20% | 87% | 0 | 3 | 0 | 0 | 0 | 0 | 0.019 | 0.002 | 1.88 |
| Virgil van Dijk | 9 | 17% | 18% | 87% | 0 | 5 | 0 | 0 | 0 | 2 | 0.043 | 0.005 | 1.89 |
| Alisson Becker | |||||||||||||
| Jérémy Jacquet | 5 | 33% | 13% | 68% | 0 | 0 | 0 | 0 | 0 | 0 | 0.006 | 0.001 | 2.60 |
| Virgil van Dijk | 5 | 33% | 10% | 68% | 1 | 0 | 0 | 0 | 0 | 0 | 0.015 | 0.003 | 2.40 |
| Bradley Barcola | |||||||||||||
| Florian Wirtz | 9 | 41% | 29% | 71% | 0 | 8 | 1 | 0 | 0 | 3 | 0.149 | 0.017 | 1.44 |
| Florian Wirtz | |||||||||||||
| Alexis Mac Allister | 6 | 21% | 15% | 83% | 0 | 3 | 0 | 0 | 0 | 2 | 0.025 | 0.004 | 3.33 |
| Bradley Barcola | 5 | 17% | 15% | 83% | 0 | 5 | 1 | 0 | 0 | 1 | 0.070 | 0.014 | 2.20 |
| Milos Kerkez | 5 | 17% | 15% | 83% | 0 | 1 | 1 | 0 | 0 | 0 | 0.025 | 0.005 | 2.00 |
| Jérémy Jacquet | |||||||||||||
| Alexis Mac Allister | 6 | 14% | 15% | 81% | 0 | 0 | 0 | 0 | 0 | 1 | 0.015 | 0.002 | 2.50 |
| Trey Nyoni | 7 | 17% | 18% | 81% | 0 | 1 | 0 | 0 | 0 | 0 | 0.015 | 0.002 | 4.86 |
| Virgil van Dijk | 12 | 29% | 24% | 81% | 0 | 0 | 0 | 0 | 0 | 0 | 0.012 | 0.001 | 2.33 |
| Milos Kerkez | |||||||||||||
| Bradley Barcola | 6 | 25% | 18% | 80% | 0 | 4 | 0 | 0 | 0 | 0 | 0.037 | 0.006 | 3.17 |
| Virgil van Dijk | 5 | 21% | 10% | 80% | 0 | 1 | 0 | 0 | 0 | 0 | 0.011 | 0.002 | 3.40 |
| Trey Nyoni | |||||||||||||
| Alexis Mac Allister | 9 | 17% | 23% | 96% | 0 | 1 | 0 | 0 | 0 | 4 | 0.034 | 0.004 | 2.22 |
| Bradley Barcola | 5 | 9% | 15% | 96% | 1 | 1 | 0 | 0 | 0 | 0 | 0.022 | 0.004 | 4.60 |
| Jérémy Jacquet | 7 | 13% | 18% | 96% | 0 | 0 | 0 | 0 | 0 | 0 | 0.006 | 0.001 | 3.00 |
| Milos Kerkez | 11 | 20% | 33% | 96% | 0 | 2 | 0 | 0 | 0 | 0 | 0.036 | 0.003 | 3.55 |
| Virgil van Dijk | 10 | 18% | 20% | 96% | 0 | 0 | 0 | 0 | 0 | 0 | 0.011 | 0.001 | 2.80 |
| Virgil van Dijk | |||||||||||||
| Alexis Mac Allister | 5 | 9% | 13% | 82% | 0 | 0 | 0 | 0 | 0 | 2 | 0.021 | 0.004 | 3.80 |
| Dominik Szoboszlai | 5 | 9% | 20% | 82% | 0 | 0 | 0 | 0 | 0 | 1 | 0.010 | 0.002 | 3.80 |
| Florian Wirtz | 5 | 9% | 16% | 82% | 0 | 0 | 0 | 0 | 0 | 3 | 0.020 | 0.004 | 3.00 |
| Jérémy Jacquet | 6 | 11% | 16% | 82% | 0 | 0 | 0 | 0 | 0 | 0 | 0.004 | 0.001 | 3.83 |
| Milos Kerkez | 7 | 13% | 21% | 82% | 0 | 2 | 0 | 0 | 0 | 0 | 0.028 | 0.004 | 3.29 |
| Trey Nyoni | 13 | 24% | 33% | 82% | 0 | 1 | 0 | 0 | 0 | 0 | 0.012 | 0.001 | 3.23 |
| X @Barts78 · Bluesky @barts78 · Mastodon @DrBarts · GitHub Barts78 · LinkedIn Phil-barter · Data: Opta | |||||||||||||
| Liverpool Open Play Passing connections | |||||||||||||
| Liverpool vs Arsenal - 01-11-2026 | Completed passes only, min 5 per pair. Passer Completion % = all of the passer's attempts | |||||||||||||
| Completed Passes | % of Passer's Completions | % of Receiver's Receptions | Passer Completion % | Long Passes | Final Third Passes | PK Box Passes | Crosses | Key Passes | Prog Passes | EPV | EPV / Pass | Pass Time | |
|---|---|---|---|---|---|---|---|---|---|---|---|---|---|
| Dominik Szoboszlai | |||||||||||||
| Alexis Mac Allister | 6 | 11% | 24% | 87% | 0 | 3 | 1 | 0 | 0 | 0 | 0.039 | 0.006 | 2.83 |
| Virgil van Dijk | 5 | 9% | 20% | 82% | 0 | 0 | 0 | 0 | 0 | 1 | 0.010 | 0.002 | 3.80 |
| Jérémy Jacquet | |||||||||||||
| Alexis Mac Allister | 10 | 19% | 26% | 87% | 0 | 4 | 0 | 0 | 0 | 0 | 0.019 | 0.002 | 2.10 |
| Alisson Becker | 5 | 33% | 13% | 68% | 0 | 0 | 0 | 0 | 0 | 0 | 0.006 | 0.001 | 2.60 |
| Trey Nyoni | 7 | 13% | 18% | 96% | 0 | 0 | 0 | 0 | 0 | 0 | 0.006 | 0.001 | 3.00 |
| Virgil van Dijk | 6 | 11% | 16% | 82% | 0 | 0 | 0 | 0 | 0 | 0 | 0.004 | 0.001 | 3.83 |
| Trey Nyoni | |||||||||||||
| Alexis Mac Allister | 8 | 15% | 20% | 87% | 0 | 3 | 0 | 0 | 0 | 0 | 0.019 | 0.002 | 1.88 |
| Jérémy Jacquet | 7 | 17% | 18% | 81% | 0 | 1 | 0 | 0 | 0 | 0 | 0.015 | 0.002 | 4.86 |
| Virgil van Dijk | 13 | 24% | 33% | 82% | 0 | 1 | 0 | 0 | 0 | 0 | 0.012 | 0.001 | 3.23 |
| Virgil van Dijk | |||||||||||||
| Alexis Mac Allister | 9 | 17% | 18% | 87% | 0 | 5 | 0 | 0 | 0 | 2 | 0.043 | 0.005 | 1.89 |
| Alisson Becker | 5 | 33% | 10% | 68% | 1 | 0 | 0 | 0 | 0 | 0 | 0.015 | 0.003 | 2.40 |
| Jérémy Jacquet | 12 | 29% | 24% | 81% | 0 | 0 | 0 | 0 | 0 | 0 | 0.012 | 0.001 | 2.33 |
| Milos Kerkez | 5 | 21% | 10% | 80% | 0 | 1 | 0 | 0 | 0 | 0 | 0.011 | 0.002 | 3.40 |
| Trey Nyoni | 10 | 18% | 20% | 96% | 0 | 0 | 0 | 0 | 0 | 0 | 0.011 | 0.001 | 2.80 |
| Florian Wirtz | |||||||||||||
| Bradley Barcola | 9 | 41% | 29% | 71% | 0 | 8 | 1 | 0 | 0 | 3 | 0.149 | 0.017 | 1.44 |
| Virgil van Dijk | 5 | 9% | 16% | 82% | 0 | 0 | 0 | 0 | 0 | 3 | 0.020 | 0.004 | 3.00 |
| Alexis Mac Allister | |||||||||||||
| Florian Wirtz | 6 | 21% | 15% | 83% | 0 | 3 | 0 | 0 | 0 | 2 | 0.025 | 0.004 | 3.33 |
| Jérémy Jacquet | 6 | 14% | 15% | 81% | 0 | 0 | 0 | 0 | 0 | 1 | 0.015 | 0.002 | 2.50 |
| Trey Nyoni | 9 | 17% | 23% | 96% | 0 | 1 | 0 | 0 | 0 | 4 | 0.034 | 0.004 | 2.22 |
| Virgil van Dijk | 5 | 9% | 13% | 82% | 0 | 0 | 0 | 0 | 0 | 2 | 0.021 | 0.004 | 3.80 |
| Bradley Barcola | |||||||||||||
| Florian Wirtz | 5 | 17% | 15% | 83% | 0 | 5 | 1 | 0 | 0 | 1 | 0.070 | 0.014 | 2.20 |
| Milos Kerkez | 6 | 25% | 18% | 80% | 0 | 4 | 0 | 0 | 0 | 0 | 0.037 | 0.006 | 3.17 |
| Trey Nyoni | 5 | 9% | 15% | 96% | 1 | 1 | 0 | 0 | 0 | 0 | 0.022 | 0.004 | 4.60 |
| Milos Kerkez | |||||||||||||
| Florian Wirtz | 5 | 17% | 15% | 83% | 0 | 1 | 1 | 0 | 0 | 0 | 0.025 | 0.005 | 2.00 |
| Trey Nyoni | 11 | 20% | 33% | 96% | 0 | 2 | 0 | 0 | 0 | 0 | 0.036 | 0.003 | 3.55 |
| Virgil van Dijk | 7 | 13% | 21% | 82% | 0 | 2 | 0 | 0 | 0 | 0 | 0.028 | 0.004 | 3.29 |
| X @Barts78 · Bluesky @barts78 · Mastodon @DrBarts · GitHub Barts78 · LinkedIn Phil-barter · Data: Opta | |||||||||||||
| Arsenal Open Play Passing connections | |||||||||||||
| Liverpool vs Arsenal - 01-11-2026 | Completed passes only, min 5 per pair. Passer Completion % = all of the passer's attempts | |||||||||||||
| Completed Passes | % of Passer's Completions | % of Receiver's Receptions | Passer Completion % | Long Passes | Final Third Passes | PK Box Passes | Crosses | Key Passes | Prog Passes | EPV | EPV / Pass | Pass Time | |
|---|---|---|---|---|---|---|---|---|---|---|---|---|---|
| David Raya | |||||||||||||
| Gabriel Magalhães | 5 | 18% | 20% | 53% | 0 | 0 | 0 | 0 | 0 | 0 | 0.003 | 0.001 | 4.00 |
| Declan Rice | |||||||||||||
| Ezri Konsa | 6 | 16% | 40% | 86% | 0 | 0 | 0 | 0 | 0 | 0 | 0.011 | 0.002 | 2.83 |
| Jurriën Timber | 5 | 13% | 20% | 86% | 0 | 0 | 0 | 0 | 1 | 1 | 0.015 | 0.003 | 2.00 |
| Noni Madueke | 8 | 21% | 31% | 86% | 0 | 4 | 0 | 0 | 0 | 1 | 0.039 | 0.005 | 3.62 |
| Ezri Konsa | |||||||||||||
| David Raya | 13 | 54% | 52% | 86% | 0 | 0 | 0 | 0 | 0 | 0 | 0.017 | 0.001 | 3.15 |
| Gabriel Magalhães | |||||||||||||
| Christos Tzolis | 5 | 16% | 17% | 82% | 0 | 0 | 0 | 0 | 0 | 0 | 0.011 | 0.002 | 2.60 |
| David Raya | 7 | 22% | 28% | 82% | 1 | 0 | 0 | 0 | 0 | 0 | 0.013 | 0.002 | 4.86 |
| Martin Ødegaard | 5 | 16% | 22% | 82% | 0 | 0 | 0 | 0 | 0 | 0 | 0.007 | 0.001 | 3.80 |
| Martin Ødegaard | |||||||||||||
| Christos Tzolis | 8 | 24% | 28% | 79% | 1 | 3 | 0 | 0 | 0 | 1 | 0.042 | 0.005 | 4.25 |
| Declan Rice | 6 | 18% | 18% | 79% | 0 | 4 | 2 | 0 | 1 | 0 | 0.043 | 0.007 | 3.33 |
| Riccardo Calafiori | 5 | 15% | 29% | 79% | 1 | 1 | 0 | 0 | 0 | 1 | 0.041 | 0.008 | 3.20 |
| X @Barts78 · Bluesky @barts78 · Mastodon @DrBarts · GitHub Barts78 · LinkedIn Phil-barter · Data: Opta | |||||||||||||
| Arsenal Open Play Passing connections | |||||||||||||
| Liverpool vs Arsenal - 01-11-2026 | Completed passes only, min 5 per pair. Passer Completion % = all of the passer's attempts | |||||||||||||
| Completed Passes | % of Passer's Completions | % of Receiver's Receptions | Passer Completion % | Long Passes | Final Third Passes | PK Box Passes | Crosses | Key Passes | Prog Passes | EPV | EPV / Pass | Pass Time | |
|---|---|---|---|---|---|---|---|---|---|---|---|---|---|
| Gabriel Magalhães | |||||||||||||
| David Raya | 5 | 18% | 20% | 53% | 0 | 0 | 0 | 0 | 0 | 0 | 0.003 | 0.001 | 4.00 |
| Ezri Konsa | |||||||||||||
| Declan Rice | 6 | 16% | 40% | 86% | 0 | 0 | 0 | 0 | 0 | 0 | 0.011 | 0.002 | 2.83 |
| Jurriën Timber | |||||||||||||
| Declan Rice | 5 | 13% | 20% | 86% | 0 | 0 | 0 | 0 | 1 | 1 | 0.015 | 0.003 | 2.00 |
| Noni Madueke | |||||||||||||
| Declan Rice | 8 | 21% | 31% | 86% | 0 | 4 | 0 | 0 | 0 | 1 | 0.039 | 0.005 | 3.62 |
| David Raya | |||||||||||||
| Ezri Konsa | 13 | 54% | 52% | 86% | 0 | 0 | 0 | 0 | 0 | 0 | 0.017 | 0.001 | 3.15 |
| Gabriel Magalhães | 7 | 22% | 28% | 82% | 1 | 0 | 0 | 0 | 0 | 0 | 0.013 | 0.002 | 4.86 |
| Christos Tzolis | |||||||||||||
| Gabriel Magalhães | 5 | 16% | 17% | 82% | 0 | 0 | 0 | 0 | 0 | 0 | 0.011 | 0.002 | 2.60 |
| Martin Ødegaard | 8 | 24% | 28% | 79% | 1 | 3 | 0 | 0 | 0 | 1 | 0.042 | 0.005 | 4.25 |
| Martin Ødegaard | |||||||||||||
| Gabriel Magalhães | 5 | 16% | 22% | 82% | 0 | 0 | 0 | 0 | 0 | 0 | 0.007 | 0.001 | 3.80 |
| Declan Rice | |||||||||||||
| Martin Ødegaard | 6 | 18% | 18% | 79% | 0 | 4 | 2 | 0 | 1 | 0 | 0.043 | 0.007 | 3.33 |
| Riccardo Calafiori | |||||||||||||
| Martin Ødegaard | 5 | 15% | 29% | 79% | 1 | 1 | 0 | 0 | 0 | 1 | 0.041 | 0.008 | 3.20 |
| X @Barts78 · Bluesky @barts78 · Mastodon @DrBarts · GitHub Barts78 · LinkedIn Phil-barter · Data: Opta | |||||||||||||
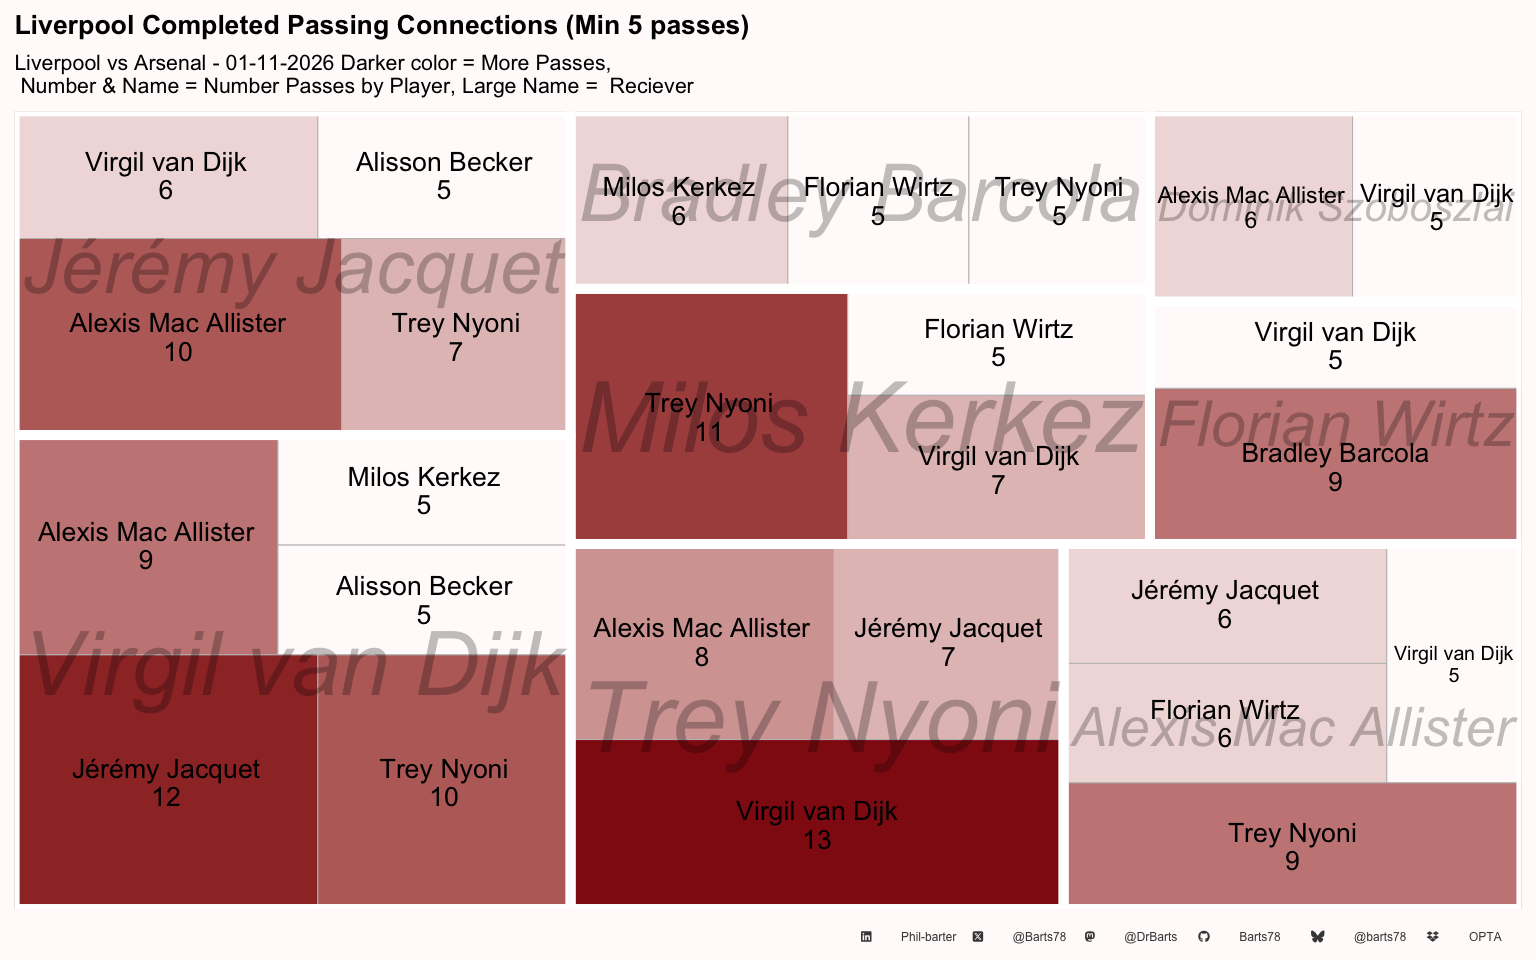
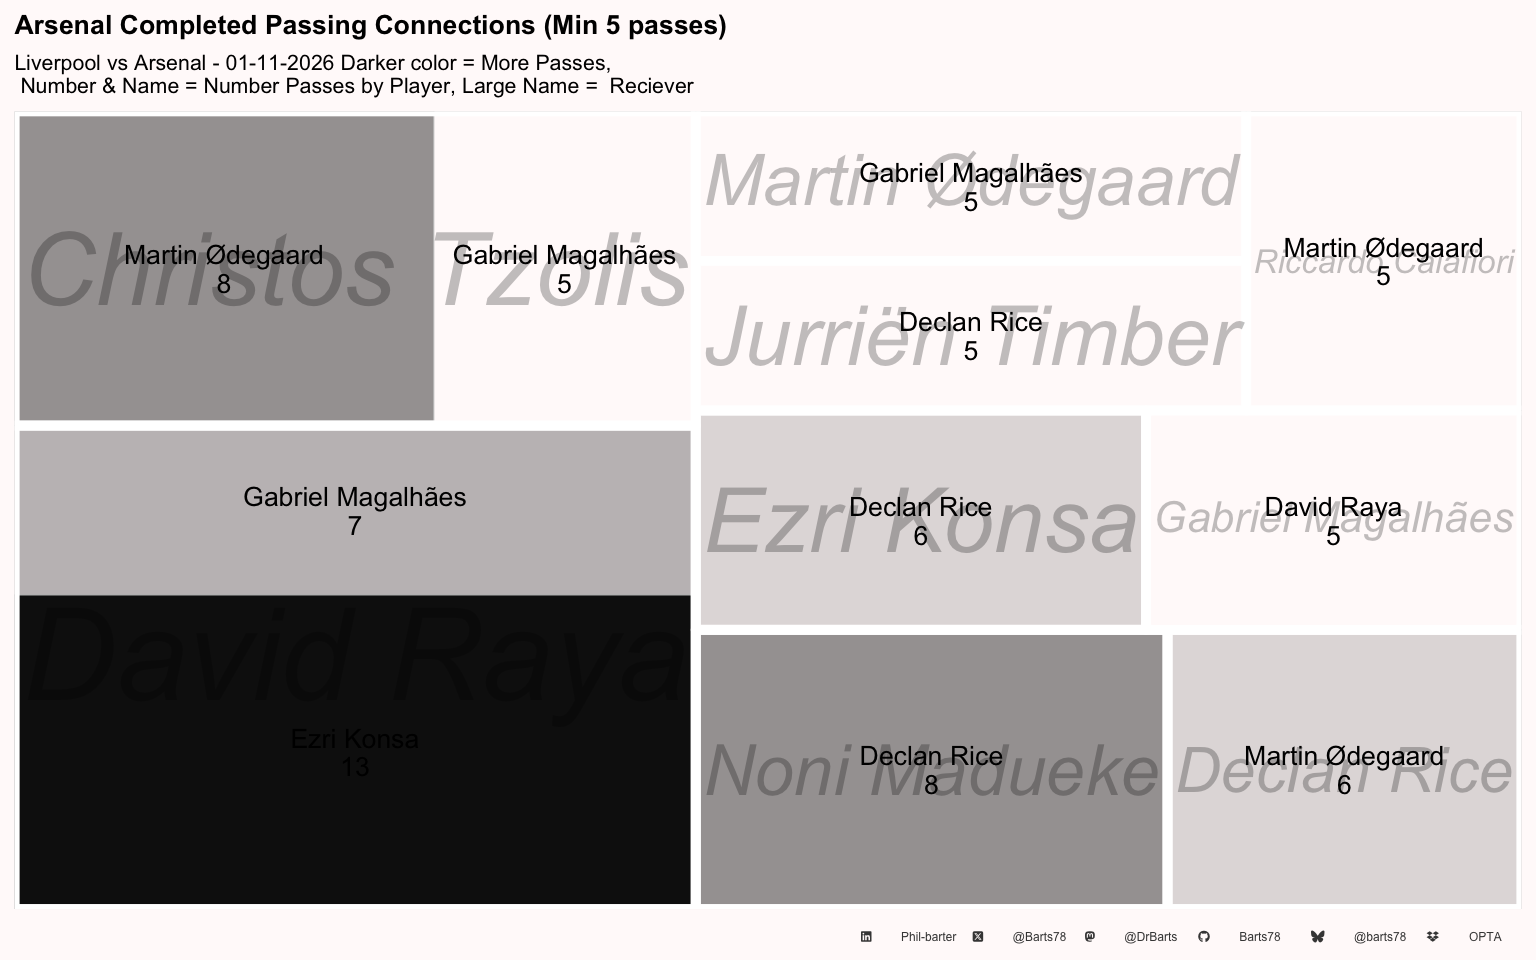
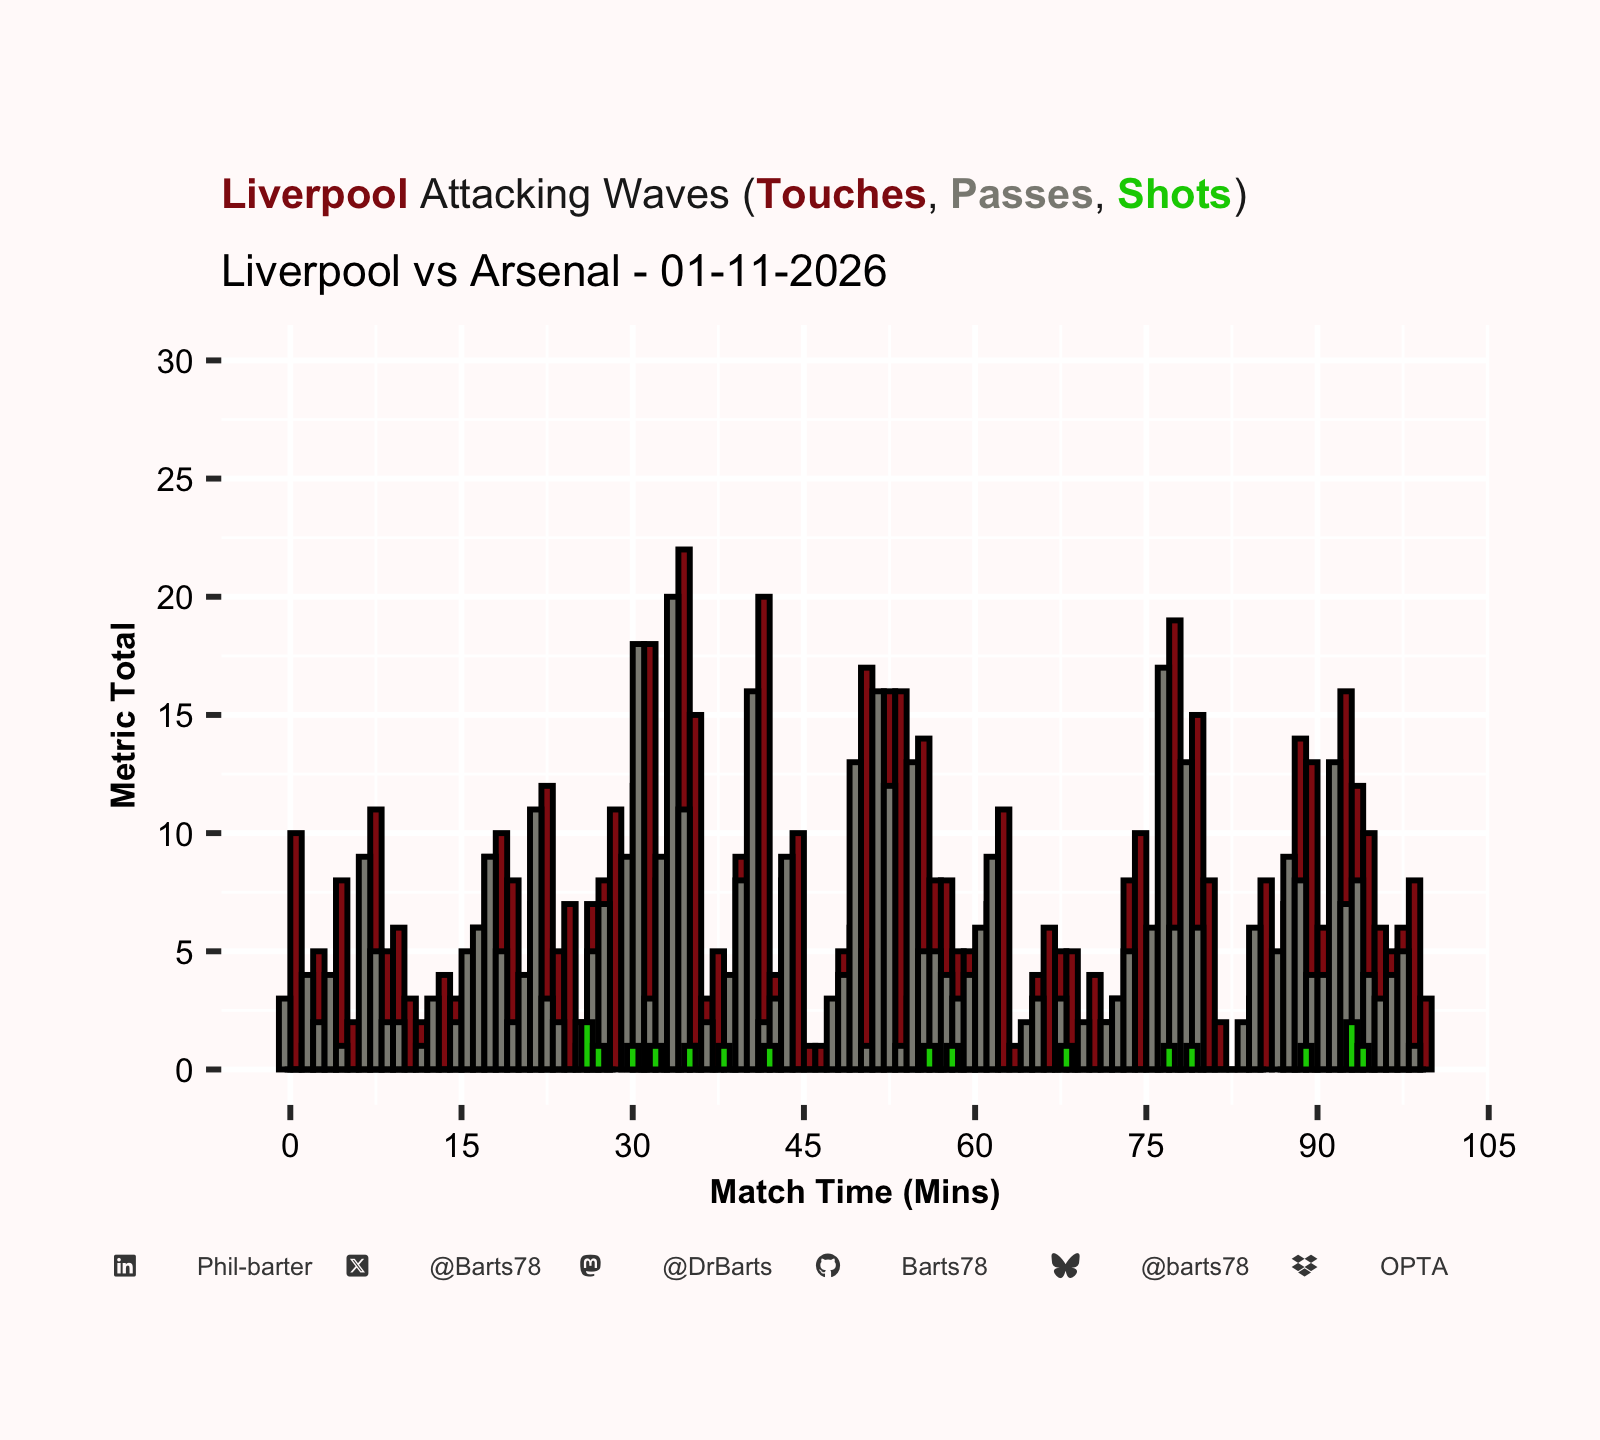
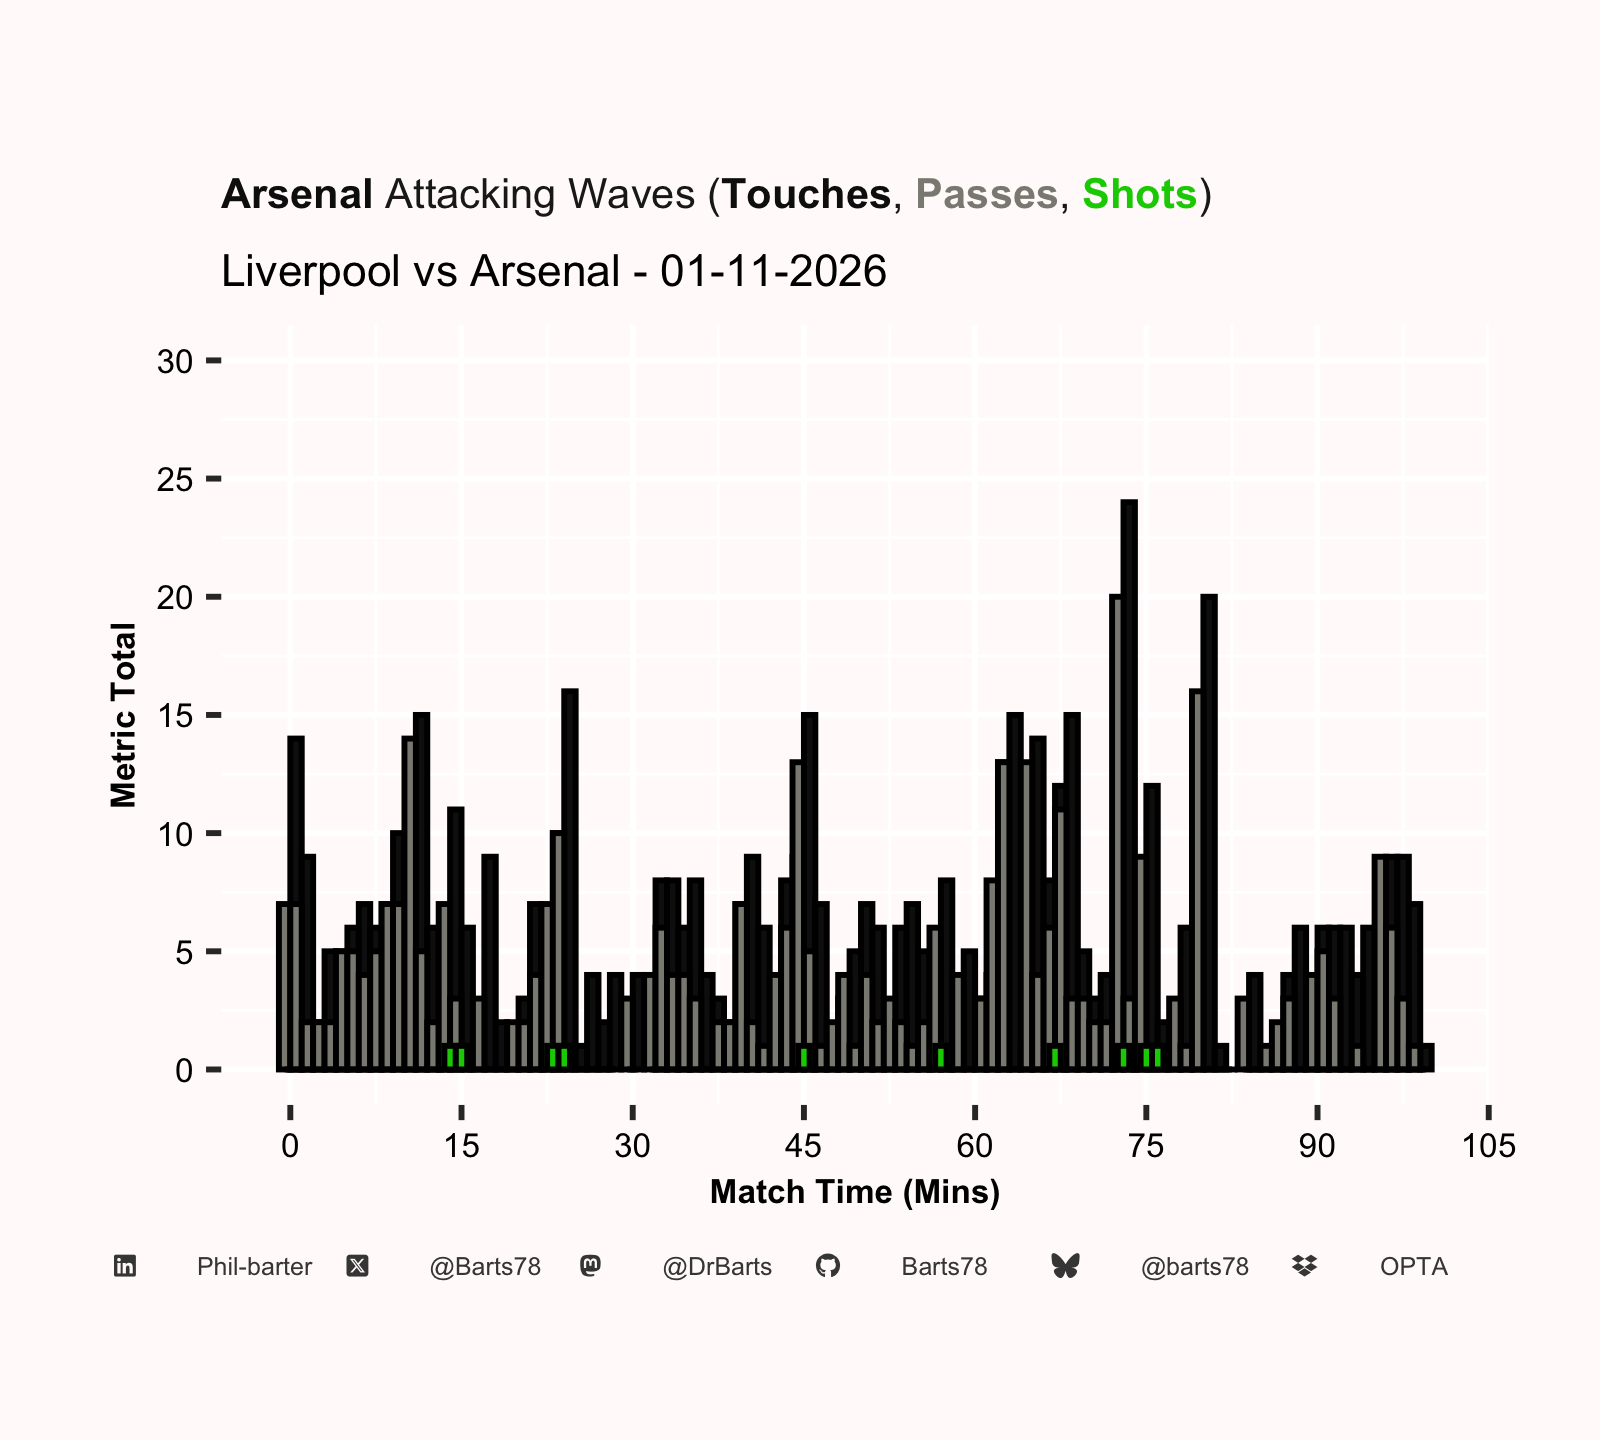
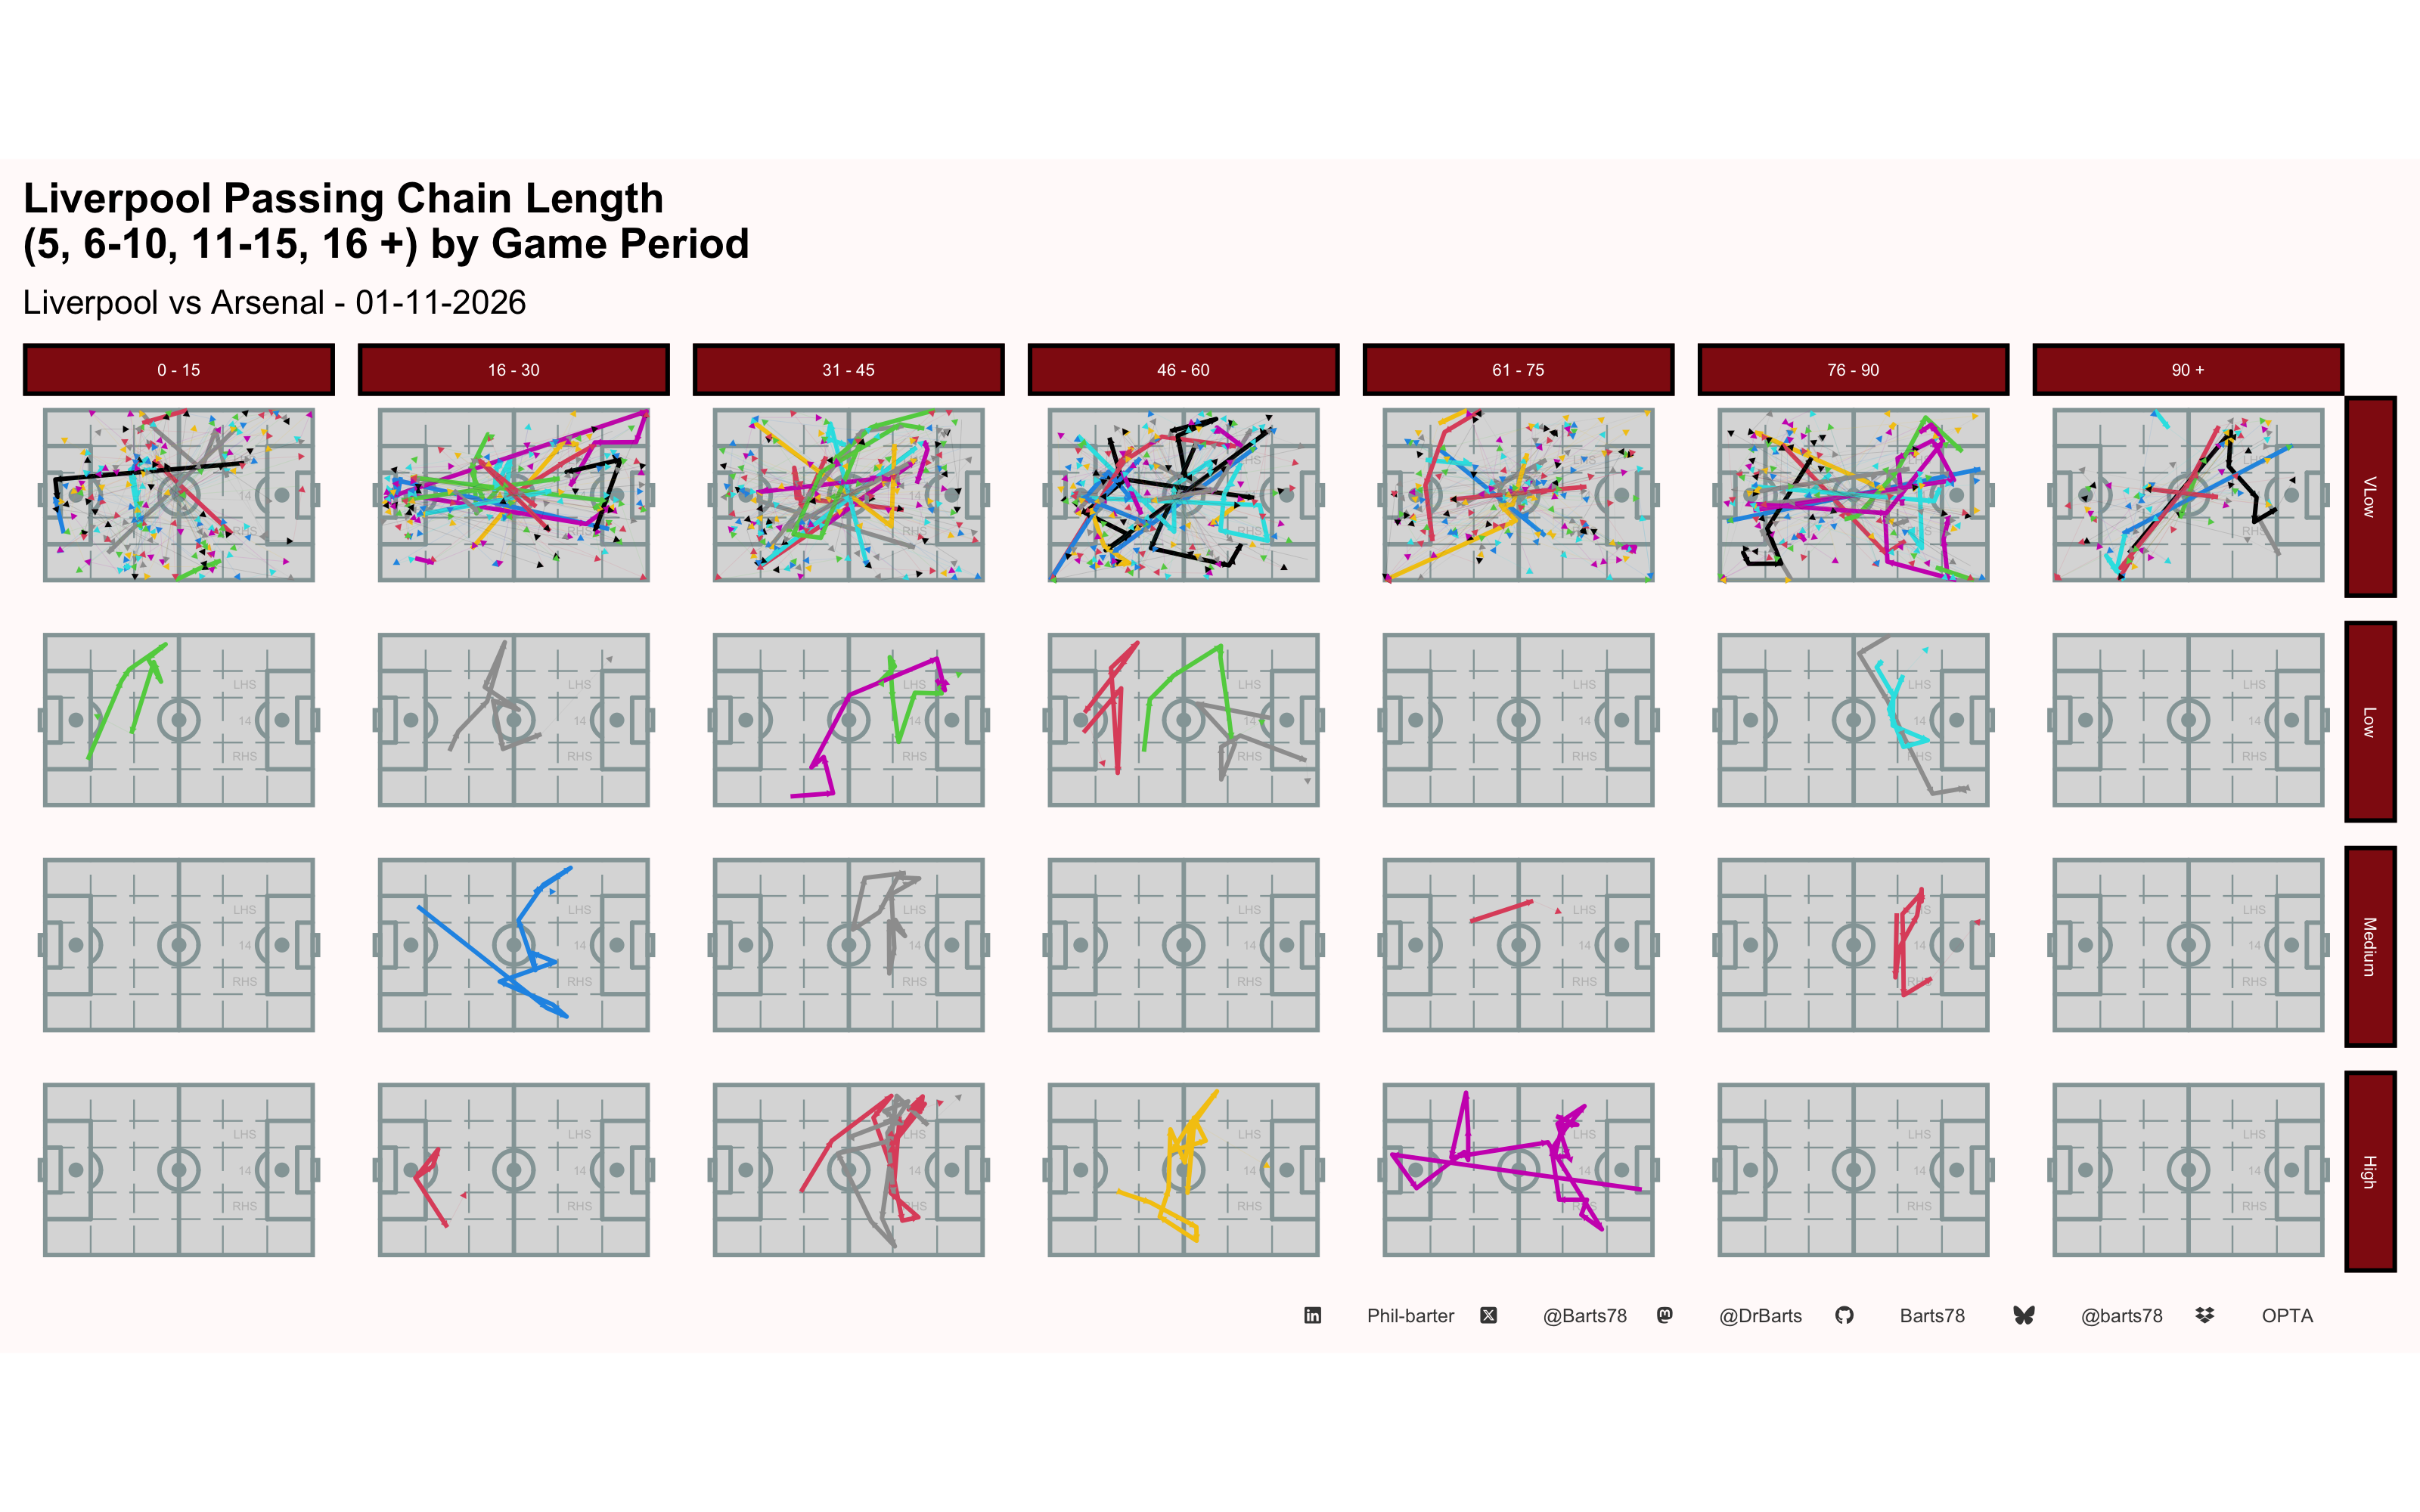
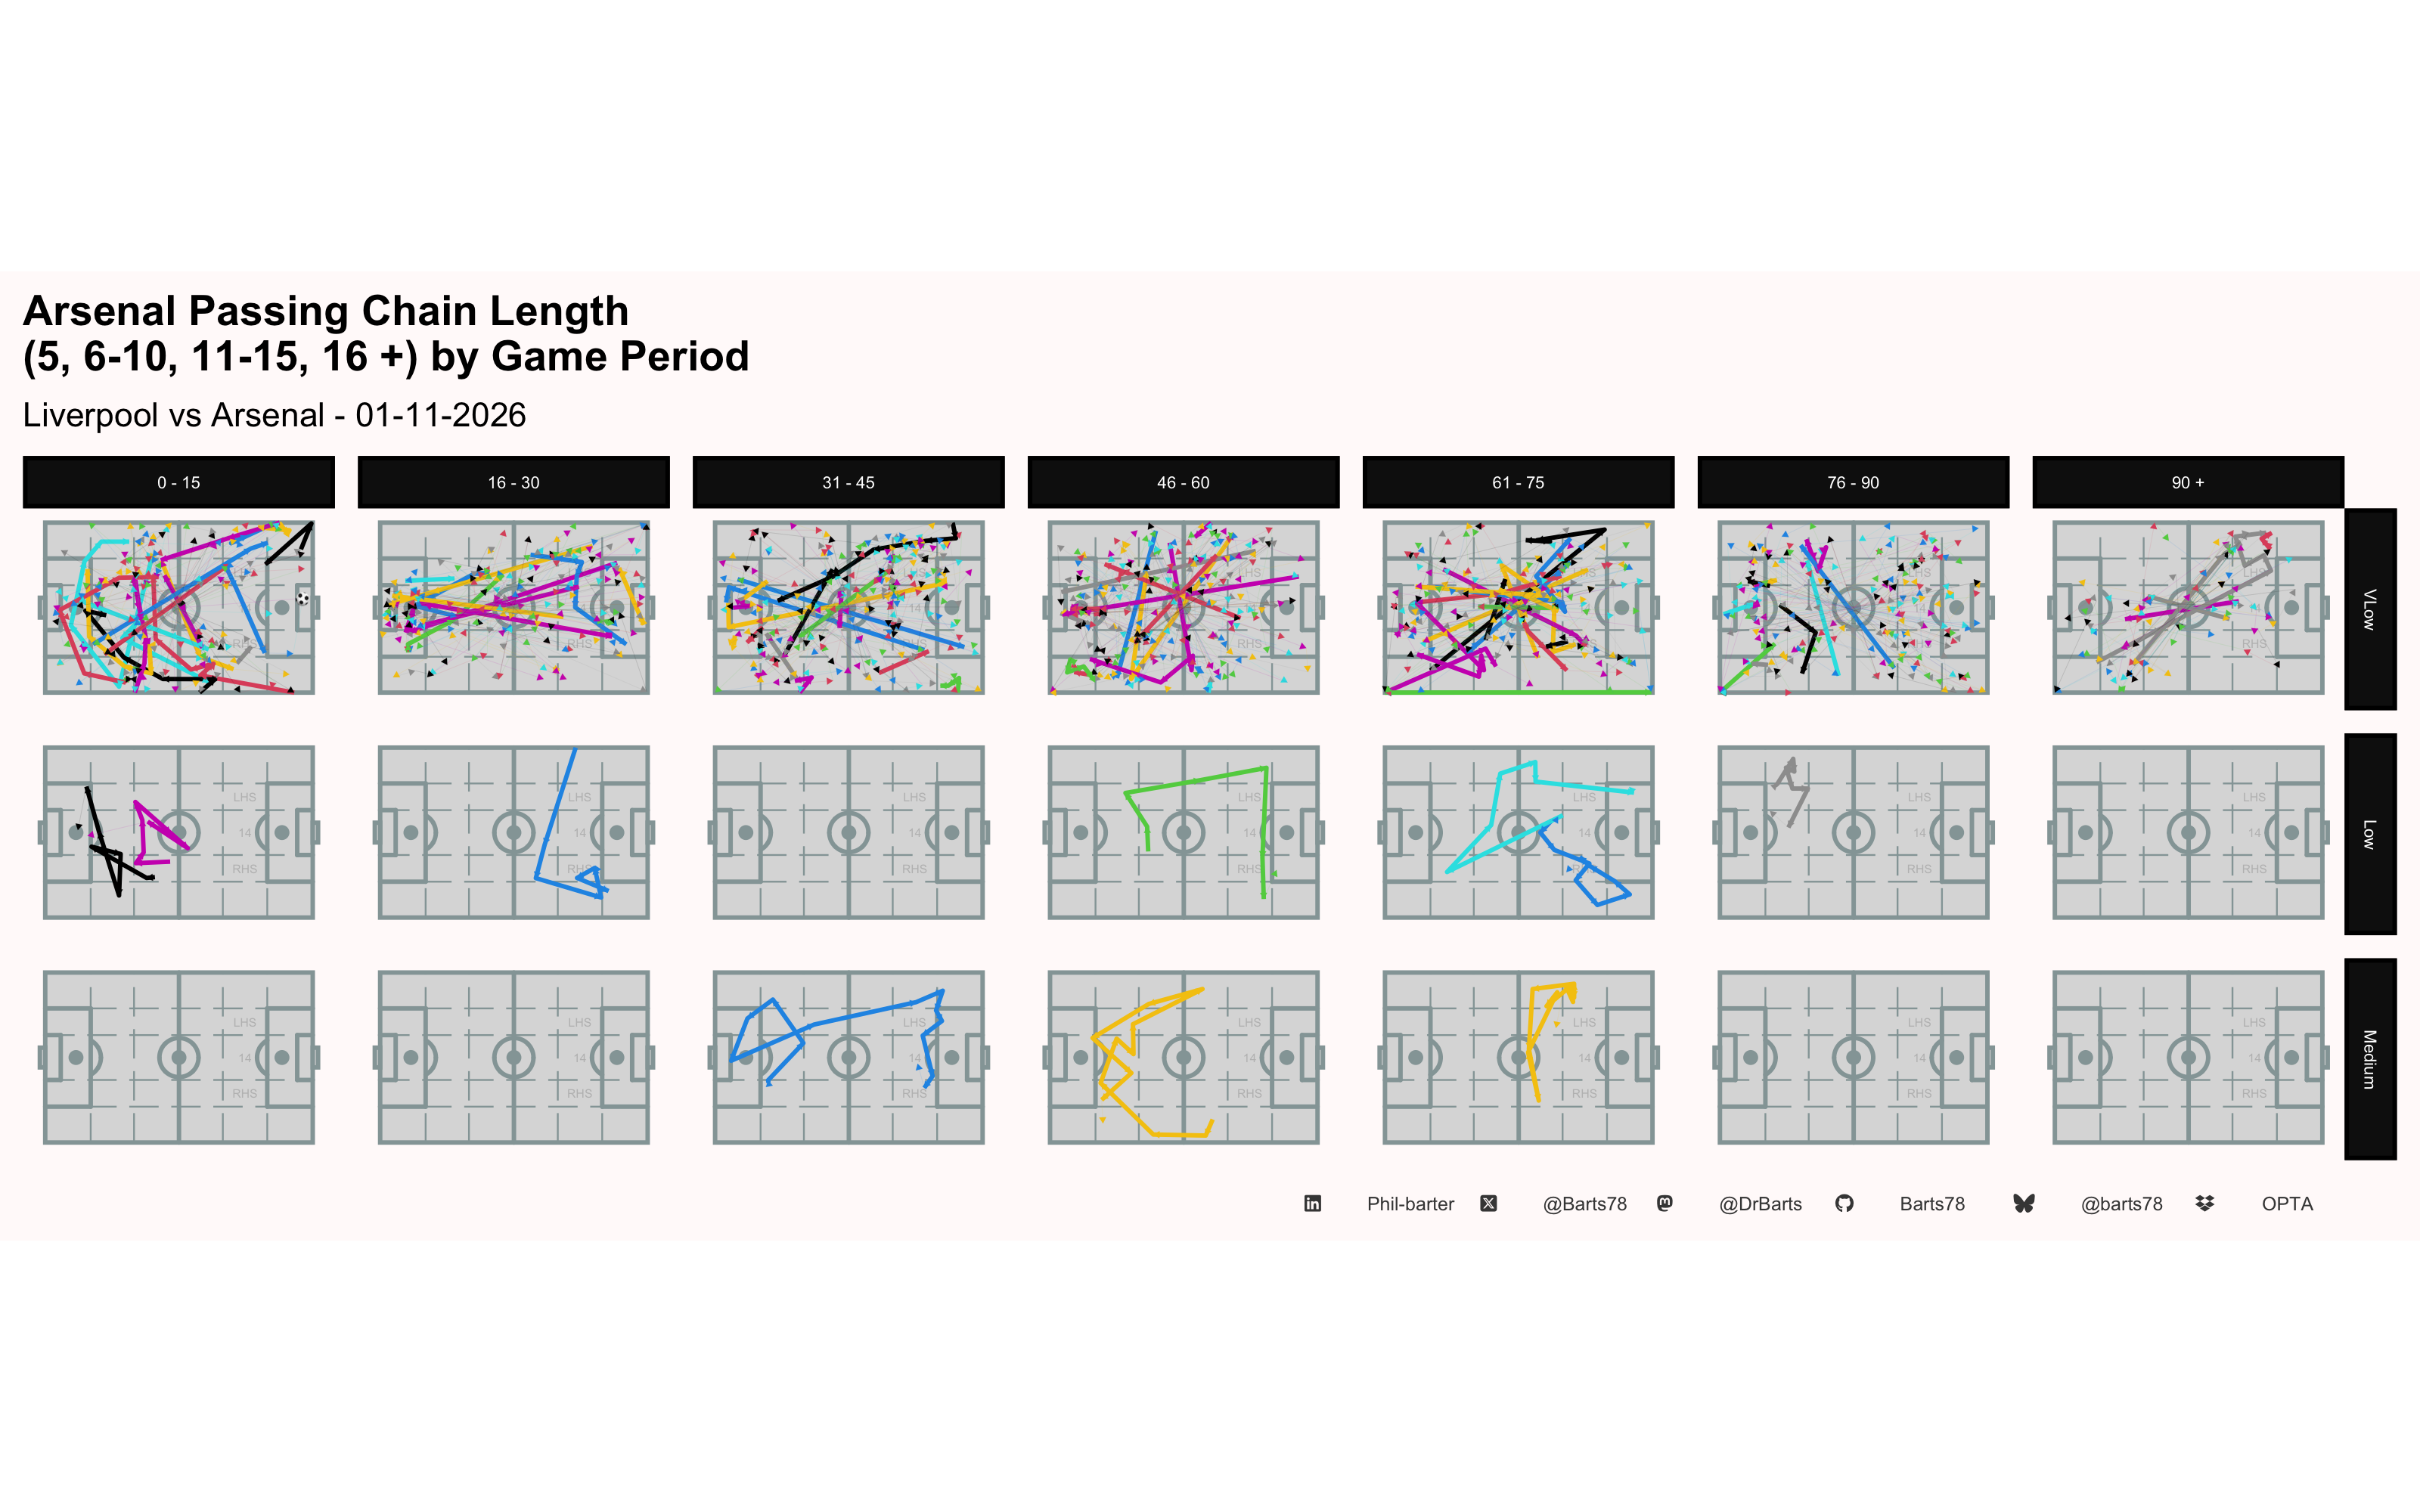
| Liverpool FT Passing Chain Length (5, 6-10, 11-15, 16 +) & Distance (m) | |||||||||
| Liverpool vs Arsenal - 01-11-2026 | |||||||||
| Pass Chain Length | Total Chain Passes | Max Chain Length | Average Chain Length | Percent of Teams Passes | Total Chain Distance | Max Chain Distance | Average Chain Distance | Percent of Teams Passing Distance | |
|---|---|---|---|---|---|---|---|---|---|
| VLow | 233 | 5 | 3 | 57% | 3,439.25 | 100.28 | 14.80 | 57% | |
| Low | 65 | 8 | 7 | 16% | 946.41 | 161.22 | 14.60 | 16% | |
| Medium | 36 | 12 | 12 | 9% | 487.75 | 181.47 | 13.50 | 8% | |
| High | 76 | 22 | 19 | 19% | 1,136.19 | 344.00 | 14.90 | 19% | |
| Overall Totals | — | 410 | 47 | 41 | — | 6,010 | 787 | 58 | — |
| Overall Average | — | 102 | 12 | 10 | — | 1,502 | 197 | 14 | — |
| X @Barts78 · Bluesky @barts78 · Mastodon @DrBarts · GitHub Barts78 · LinkedIn Phil-barter · Data: Opta | |||||||||
| Liverpool 1st Half Passing Chain Length (5, 6-10, 11-15, 16 +) & Distance (m) | |||||||||
| Liverpool vs Arsenal - 01-11-2026 | |||||||||
| Pass Chain Length | Total Chain Passes | Max Chain Length | Average Chain Length | Percent of Teams Passes | Total Chain Distance | Max Chain Distance | Average Chain Distance | Percent of Teams Passing Distance | |
|---|---|---|---|---|---|---|---|---|---|
| VLow | 98 | 5 | 2 | 51% | 1,430.61 | 100.28 | 14.60 | 52% | |
| Low | 31 | 8 | 8 | 16% | 441.15 | 149.68 | 14.20 | 16% | |
| Medium | 24 | 12 | 12 | 12% | 306.28 | 157.82 | 12.80 | 11% | |
| High | 39 | 22 | 20 | 20% | 576.79 | 344.00 | 14.80 | 21% | |
| Overall Totals | — | 192 | 47 | 42 | — | 2,755 | 752 | 56 | — |
| Overall Average | — | 48 | 12 | 10 | — | 689 | 188 | 14 | — |
| X @Barts78 · Bluesky @barts78 · Mastodon @DrBarts · GitHub Barts78 · LinkedIn Phil-barter · Data: Opta | |||||||||
| Liverpool 2nd Half Passing Chain Length (5, 6-10, 11-15, 16 +) & Distance (m) | |||||||||
| Liverpool vs Arsenal - 01-11-2026 | |||||||||
| Pass Chain Length | Total Chain Passes | Max Chain Length | Average Chain Length | Percent of Teams Passes | Total Chain Distance | Max Chain Distance | Average Chain Distance | Percent of Teams Passing Distance | |
|---|---|---|---|---|---|---|---|---|---|
| VLow | 135 | 5 | 3 | 62% | 2,008.64 | 99.16 | 14.90 | 62% | |
| Low | 34 | 7 | 6 | 16% | 505.26 | 161.22 | 14.90 | 16% | |
| Medium | 12 | 12 | 12 | 6% | 181.47 | 181.47 | 15.10 | 6% | |
| High | 37 | 21 | 19 | 17% | 559.40 | 298.52 | 15.10 | 17% | |
| Overall Totals | — | 218 | 45 | 40 | — | 3,255 | 740 | 60 | — |
| Overall Average | — | 54 | 11 | 10 | — | 814 | 185 | 15 | — |
| X @Barts78 · Bluesky @barts78 · Mastodon @DrBarts · GitHub Barts78 · LinkedIn Phil-barter · Data: Opta | |||||||||
| Arsenal FT Passing Chain Length (5, 6-10, 11-15, 16 +) & Distance (m) | |||||||||
| Liverpool vs Arsenal - 01-11-2026 | |||||||||
| Pass Chain Length | Total Chain Passes | Max Chain Length | Average Chain Length | Percent of Teams Passes | Total Chain Distance | Max Chain Distance | Average Chain Distance | Percent of Teams Passing Distance | |
|---|---|---|---|---|---|---|---|---|---|
| VLow | 211 | 5 | 3 | 72% | 3,098.39 | 139.97 | 14.70 | 74% | |
| Low | 49 | 10 | 7 | 17% | 585.85 | 114.89 | 12.00 | 14% | |
| Medium | 35 | 13 | 12 | 12% | 528.31 | 202.41 | 15.10 | 13% | |
| Overall Totals | — | 295 | 28 | 22 | — | 4,213 | 457 | 42 | — |
| Overall Average | — | 98 | 9 | 7 | — | 1,404 | 152 | 14 | — |
| X @Barts78 · Bluesky @barts78 · Mastodon @DrBarts · GitHub Barts78 · LinkedIn Phil-barter · Data: Opta | |||||||||
| Arsenal 1st Half Passing Chain Length (5, 6-10, 11-15, 16 +) & Distance (m) | |||||||||
| Liverpool vs Arsenal - 01-11-2026 | |||||||||
| Pass Chain Length | Total Chain Passes | Max Chain Length | Average Chain Length | Percent of Teams Passes | Total Chain Distance | Max Chain Distance | Average Chain Distance | Percent of Teams Passing Distance | |
|---|---|---|---|---|---|---|---|---|---|
| VLow | 121 | 5 | 3 | 79% | 1,727.99 | 139.97 | 14.30 | 81% | |
| Low | 20 | 7 | 6 | 13% | 245.94 | 103.57 | 12.30 | 12% | |
| Medium | 13 | 13 | 13 | 8% | 160.72 | 160.72 | 12.40 | 8% | |
| Overall Totals | — | 154 | 25 | 22 | — | 2,135 | 404 | 39 | — |
| Overall Average | — | 51 | 8 | 7 | — | 712 | 135 | 13 | — |
| X @Barts78 · Bluesky @barts78 · Mastodon @DrBarts · GitHub Barts78 · LinkedIn Phil-barter · Data: Opta | |||||||||
| Arsenal 2nd Half Passing Chain Length (5, 6-10, 11-15, 16 +) & Distance (m) | |||||||||
| Liverpool vs Arsenal - 01-11-2026 | |||||||||
| Pass Chain Length | Total Chain Passes | Max Chain Length | Average Chain Length | Percent of Teams Passes | Total Chain Distance | Max Chain Distance | Average Chain Distance | Percent of Teams Passing Distance | |
|---|---|---|---|---|---|---|---|---|---|
| VLow | 90 | 5 | 2 | 64% | 1,370.40 | 89.39 | 15.20 | 66% | |
| Low | 29 | 10 | 8 | 21% | 339.91 | 114.89 | 11.70 | 16% | |
| Medium | 22 | 11 | 11 | 16% | 367.59 | 202.41 | 16.70 | 18% | |
| Overall Totals | — | 141 | 26 | 21 | — | 2,078 | 407 | 44 | — |
| Overall Average | — | 47 | 9 | 7 | — | 693 | 136 | 15 | — |
| X @Barts78 · Bluesky @barts78 · Mastodon @DrBarts · GitHub Barts78 · LinkedIn Phil-barter · Data: Opta | |||||||||
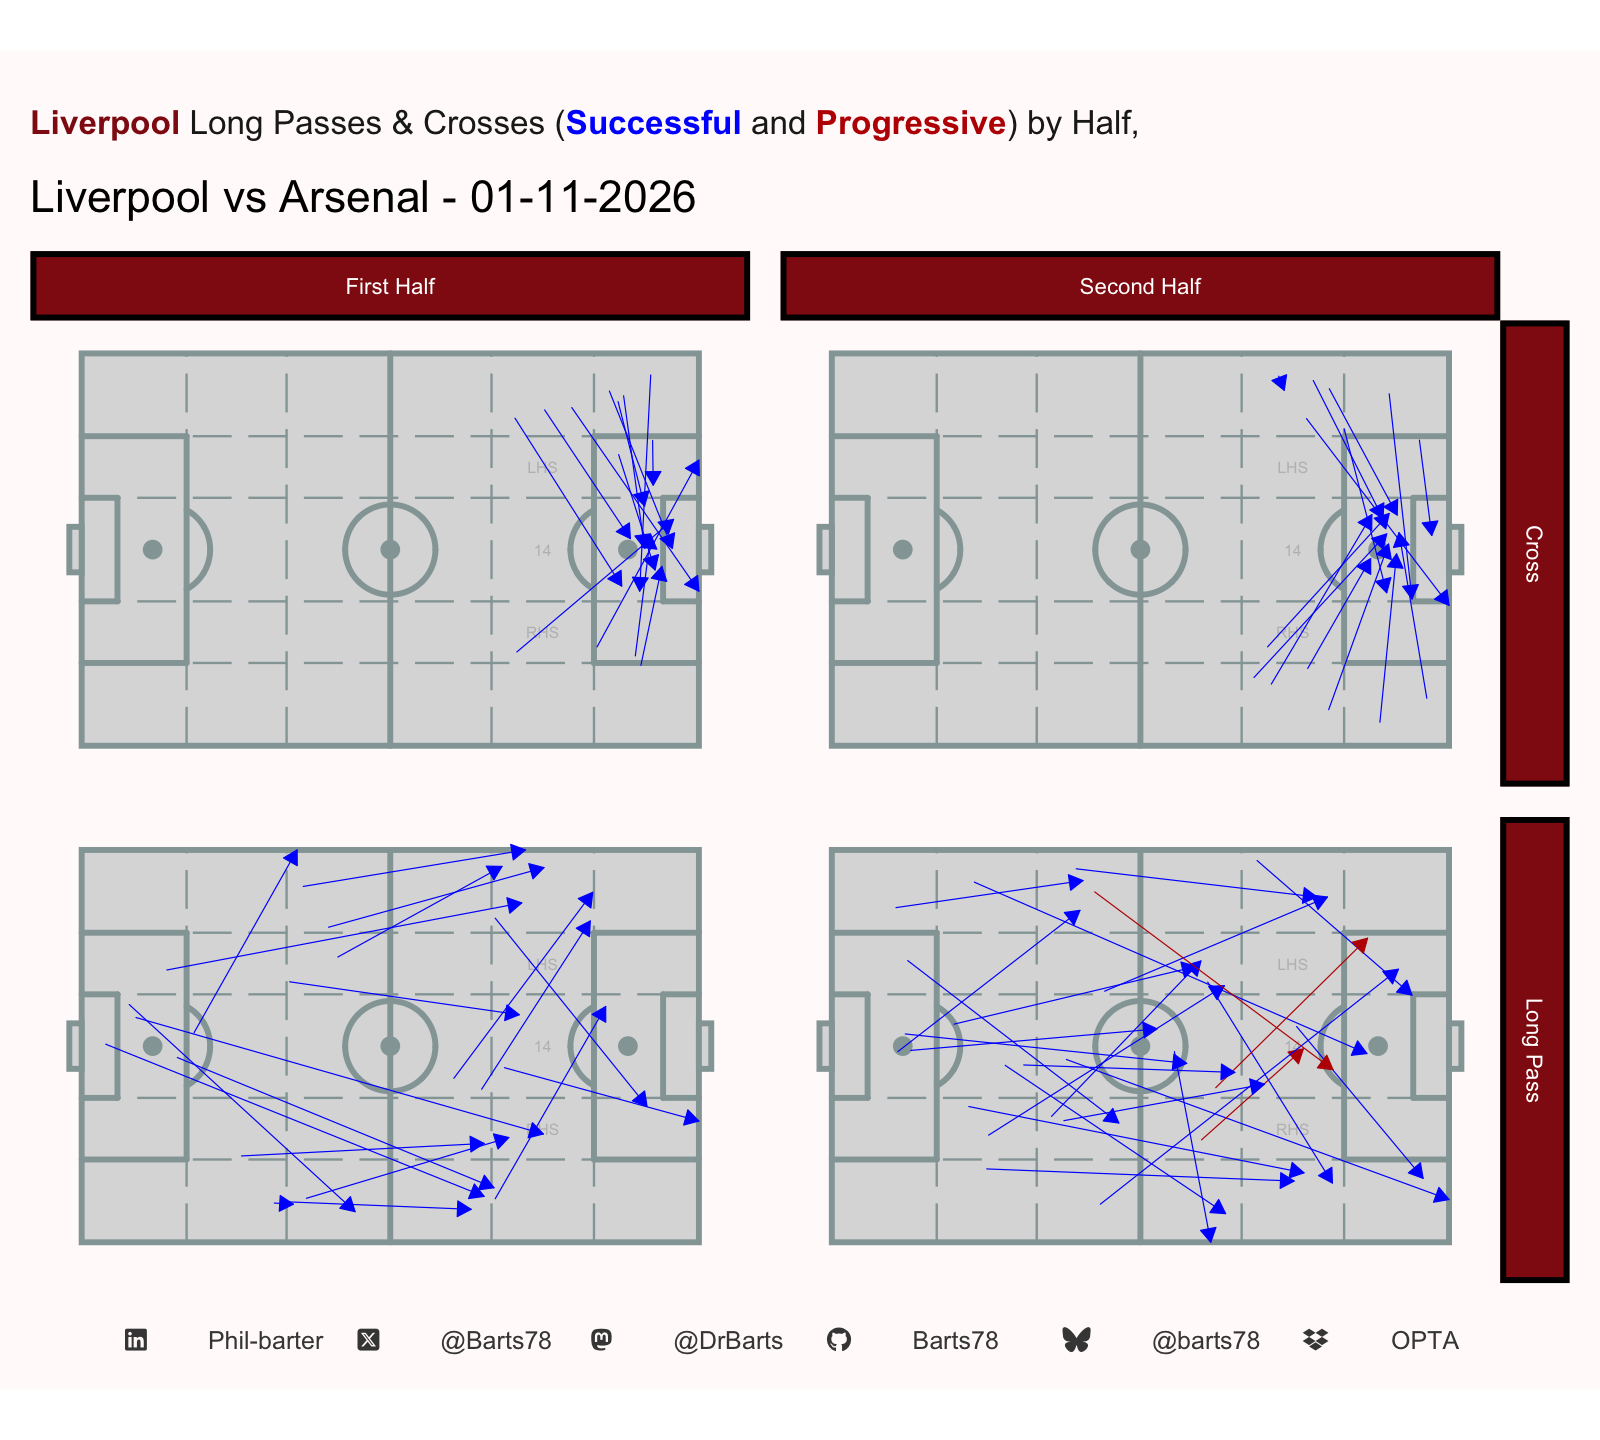
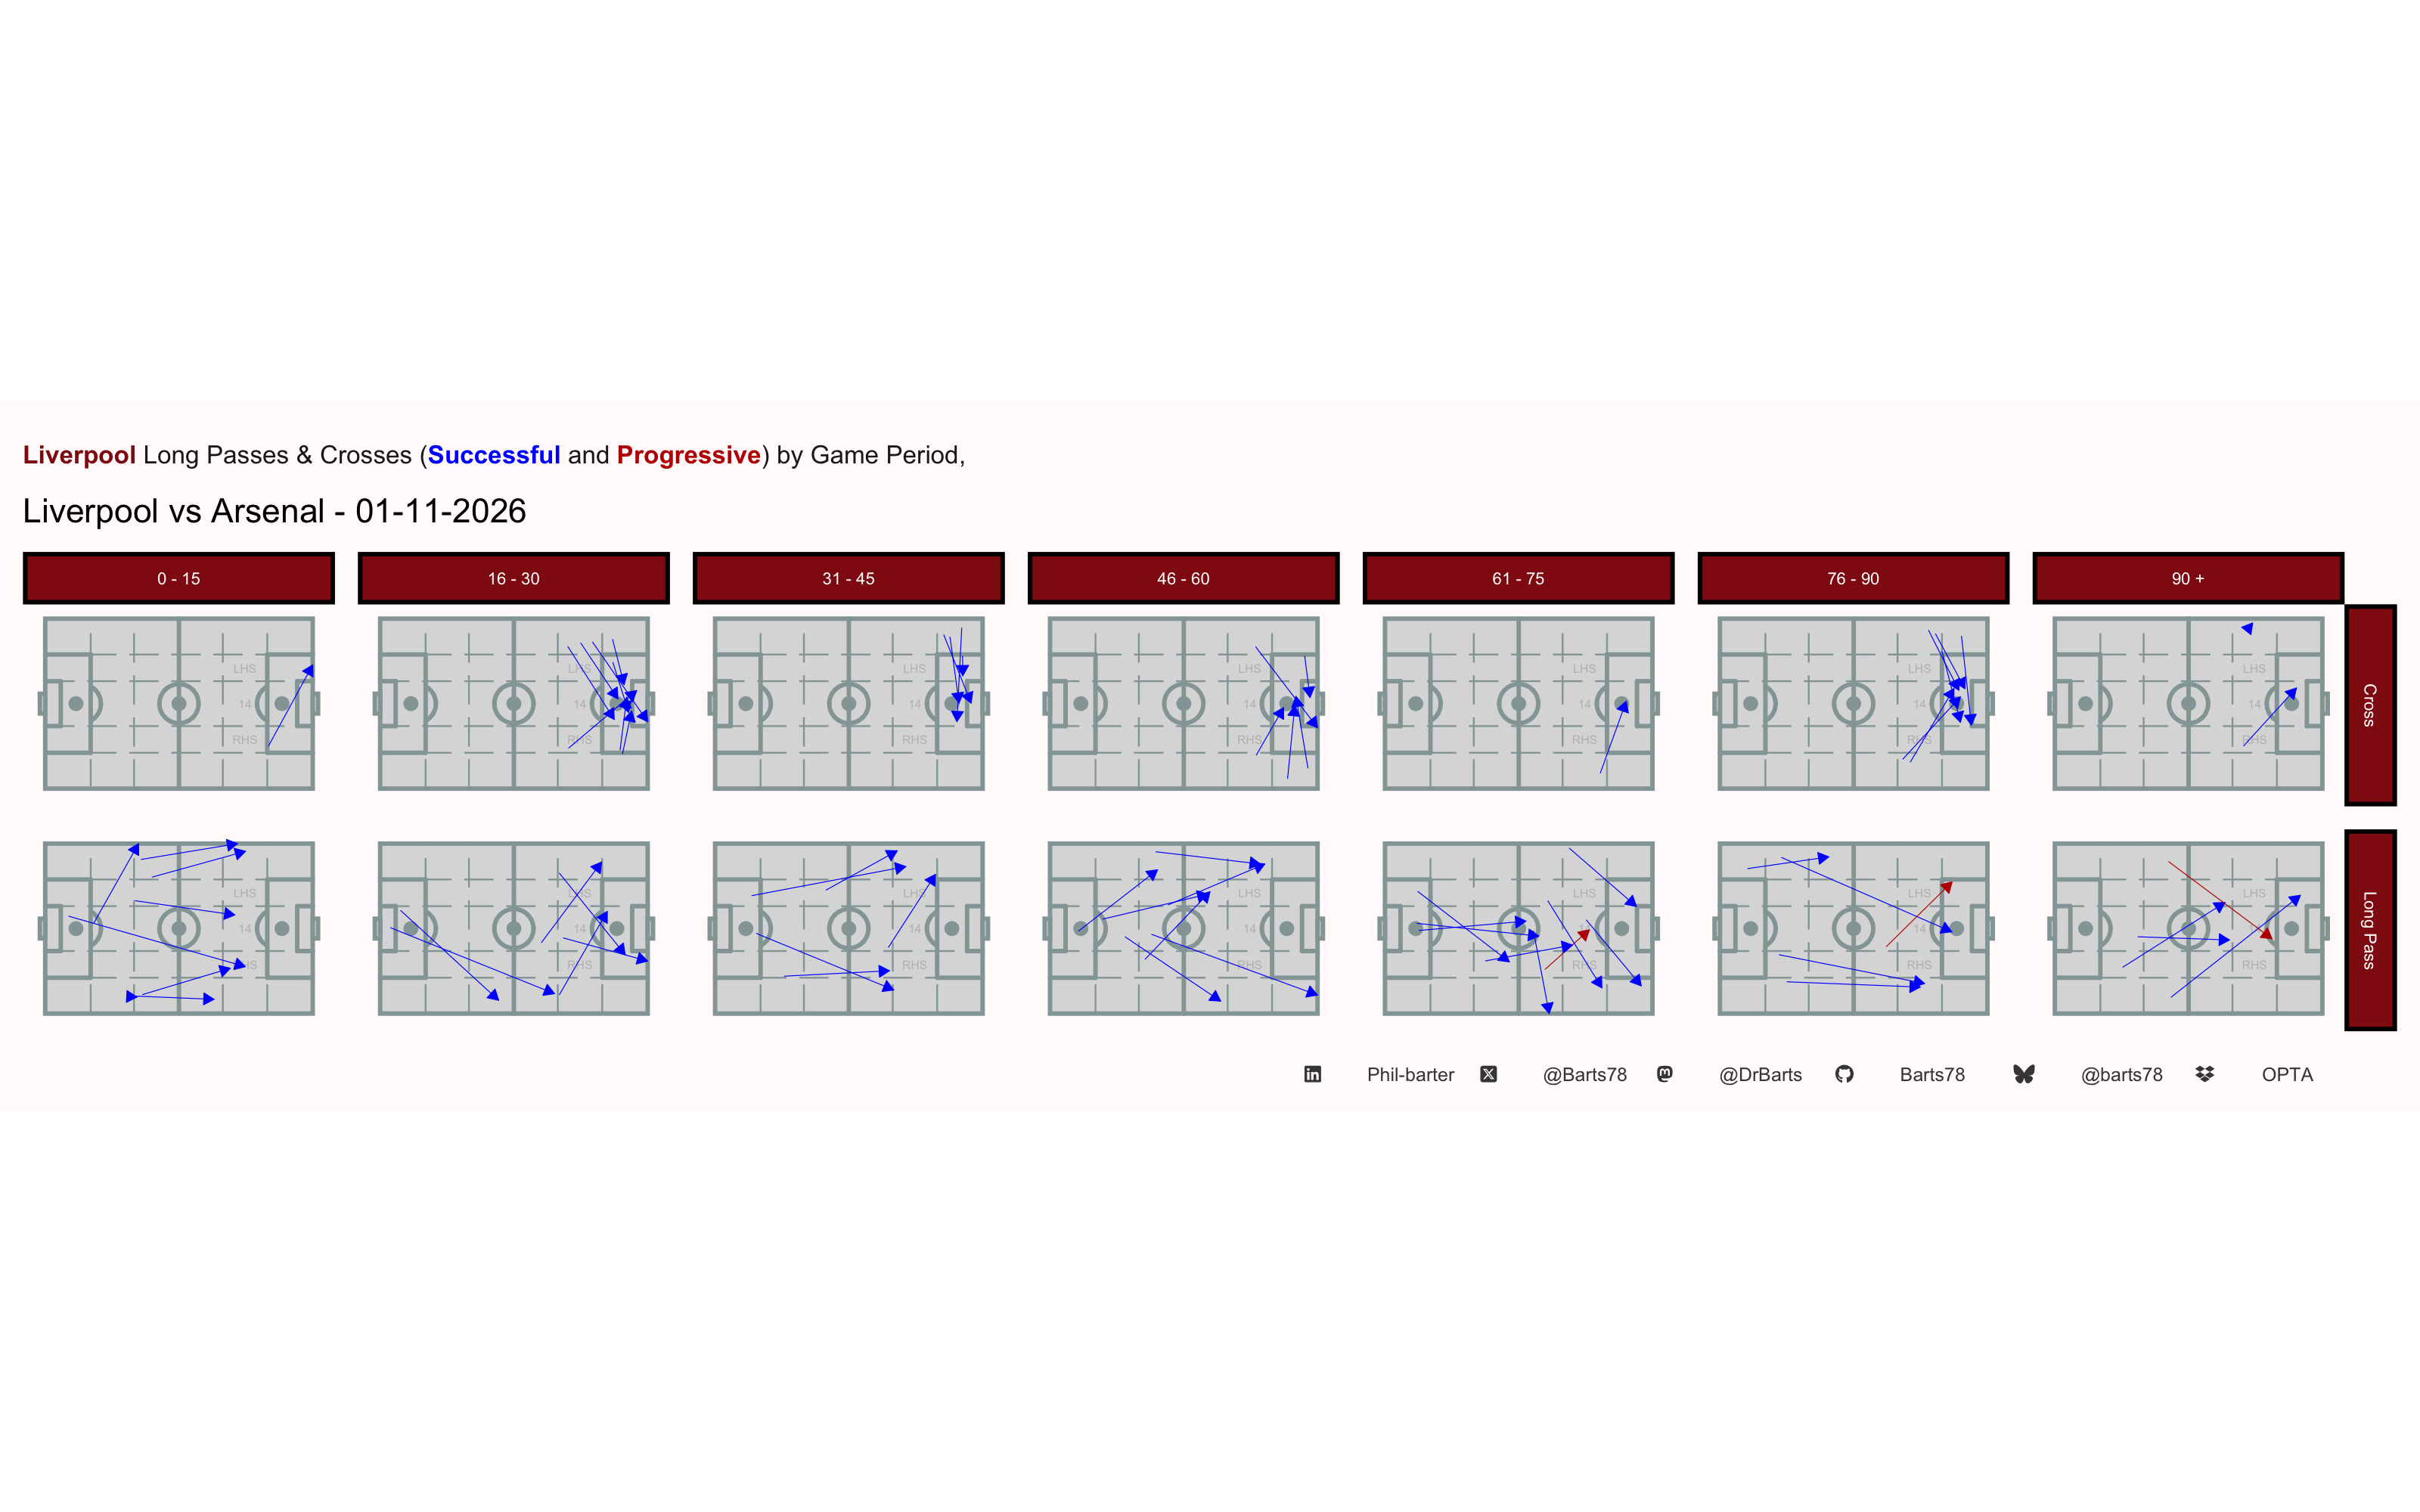
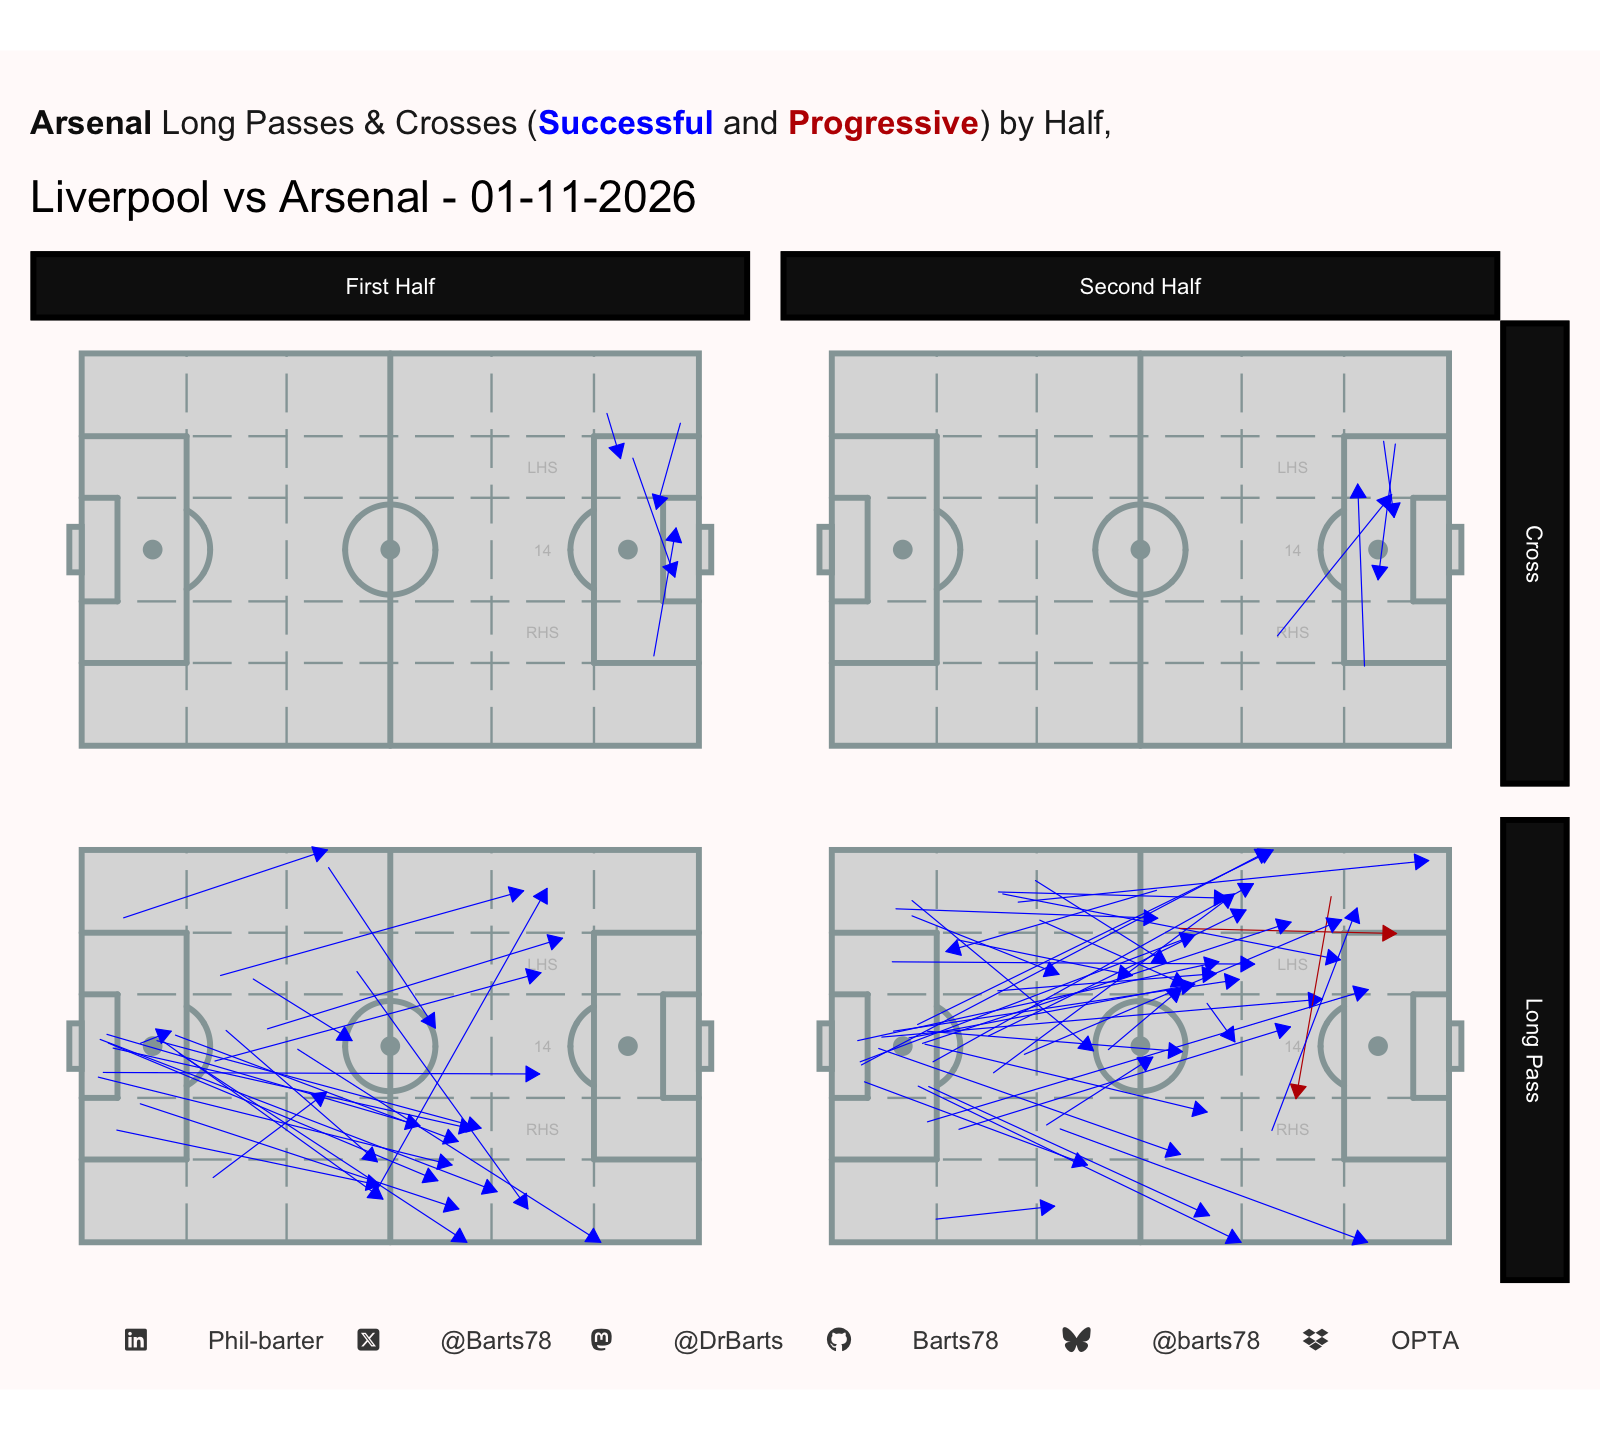
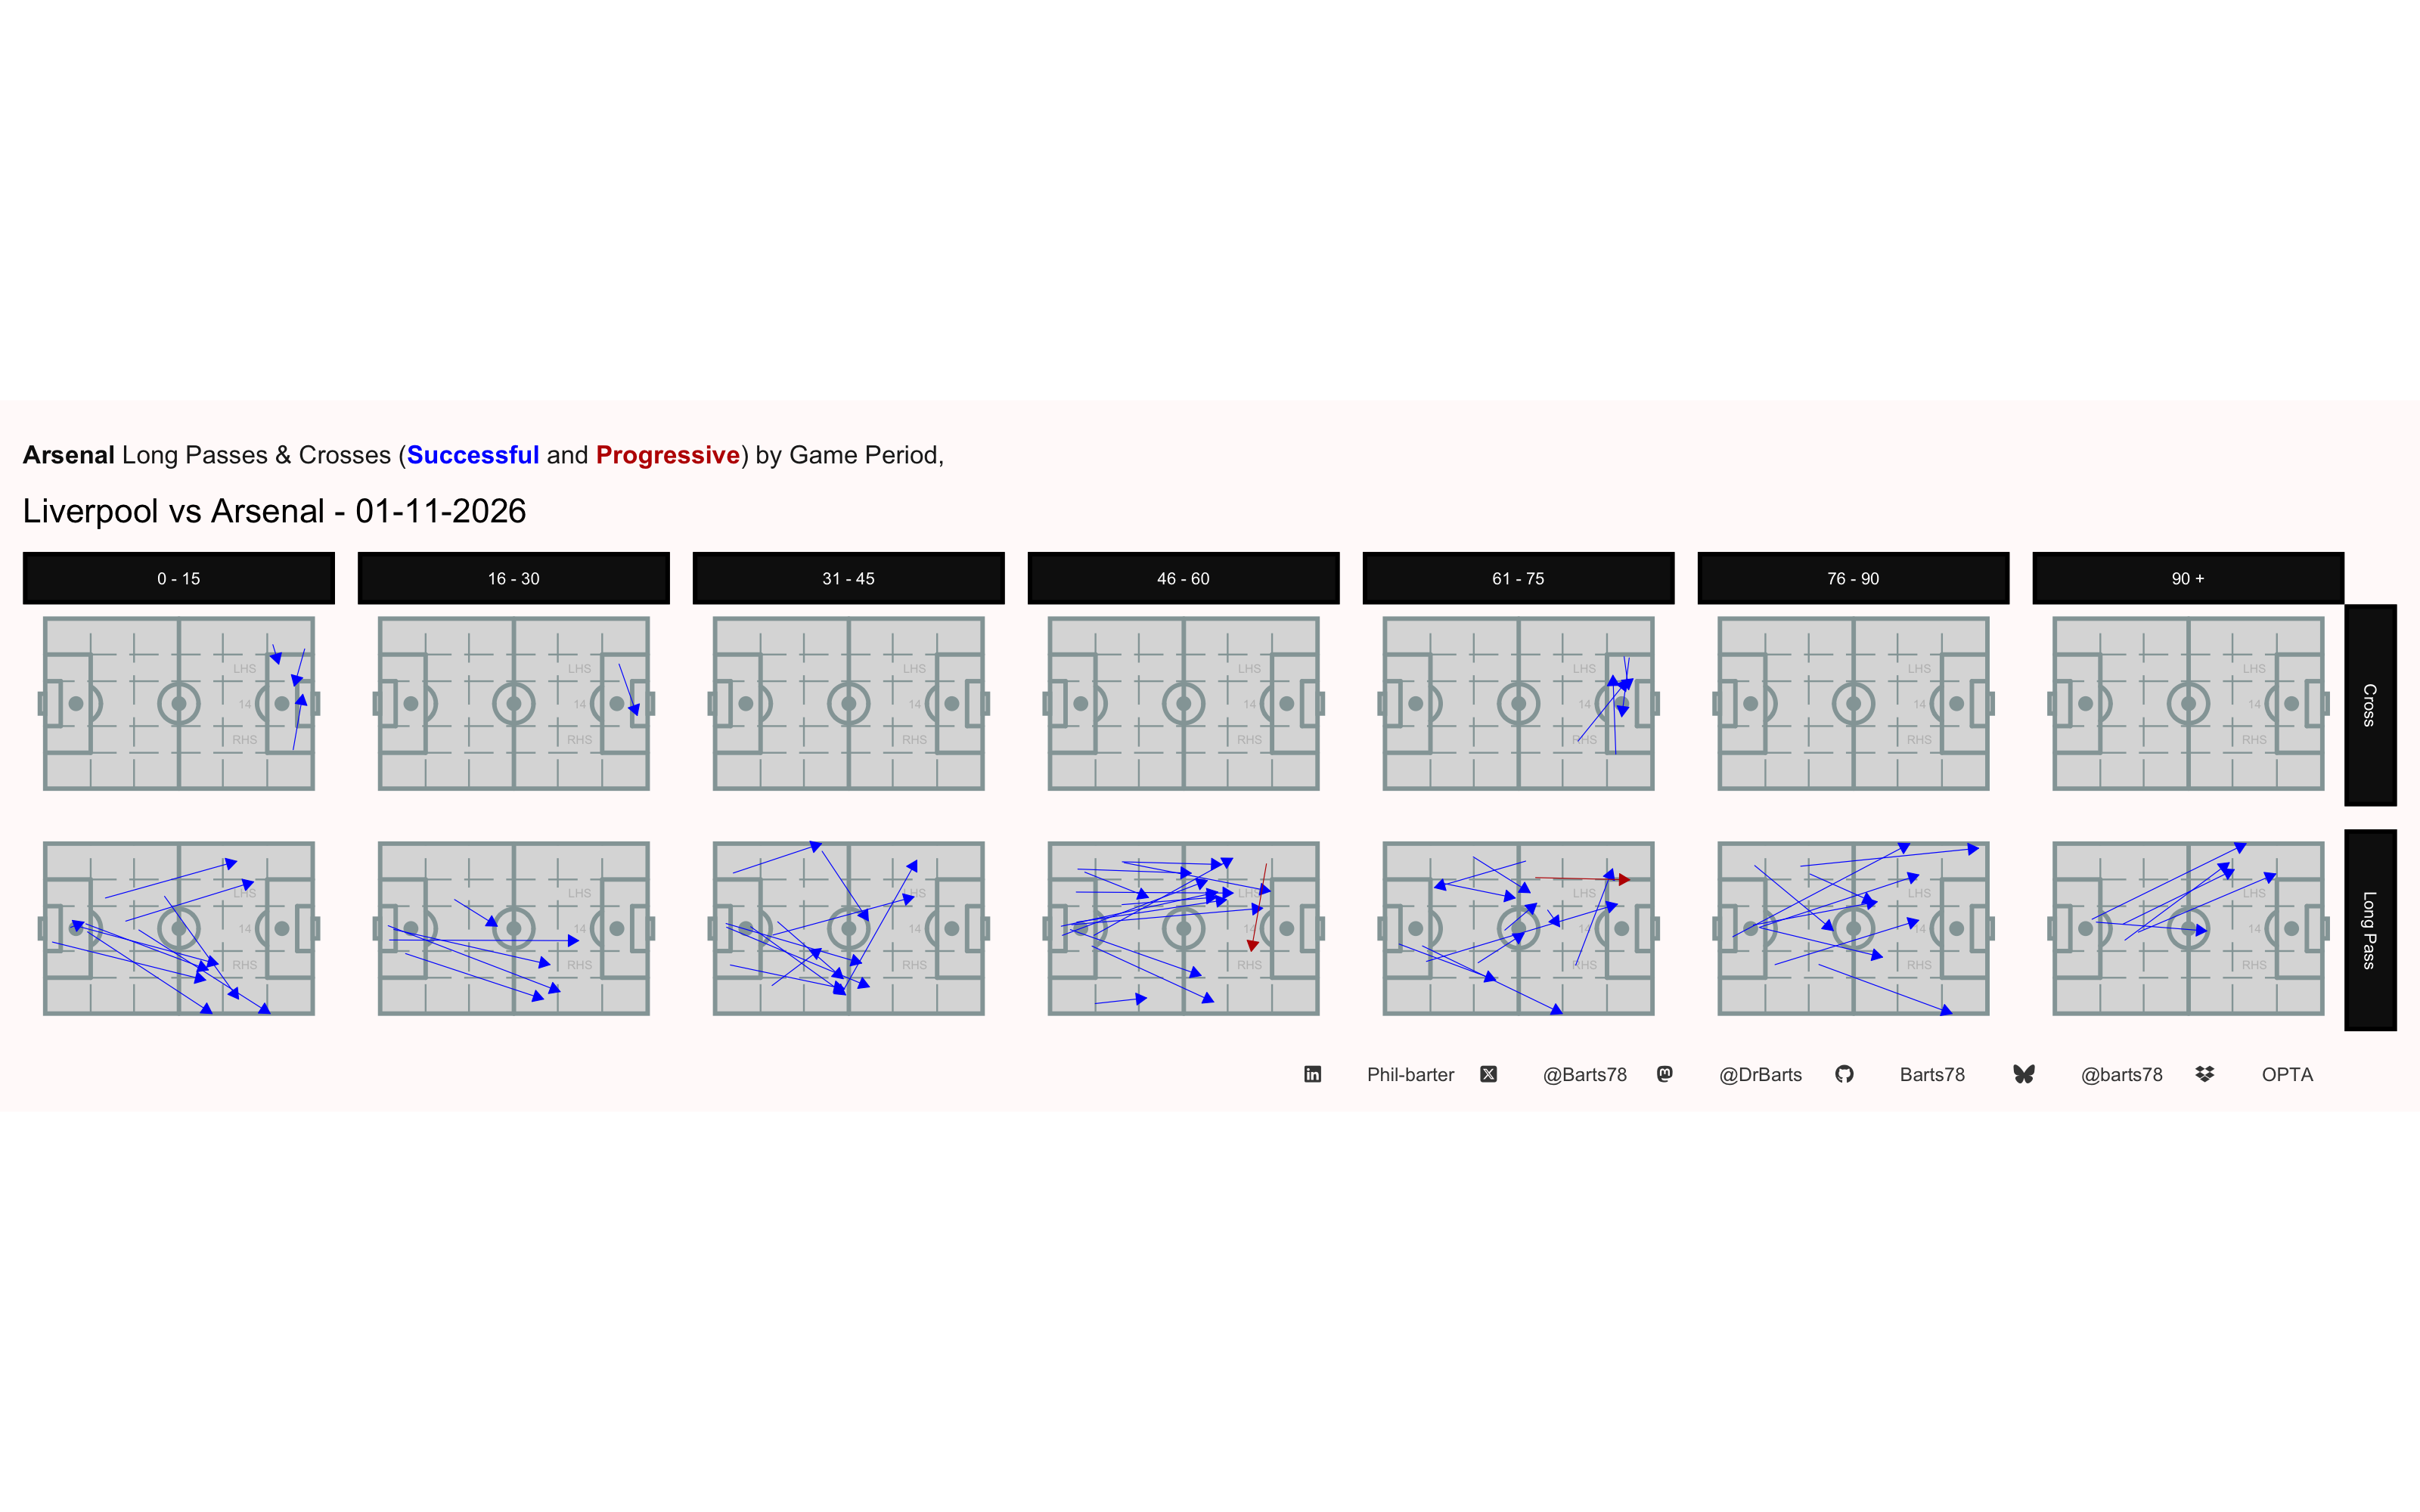
| Set Pieces | ||
| Liverpool vs Arsenal - 01-11-2026 | ||
| Liverpool | Arsenal | |
|---|---|---|
| Corners | ||
| Corners taken | 7 | 4 |
| Short | 1 | 2 |
| Direct | 6 | 2 |
| Direct - first contact won | 1 (17%) | 1 (50%) |
| Free kicks | ||
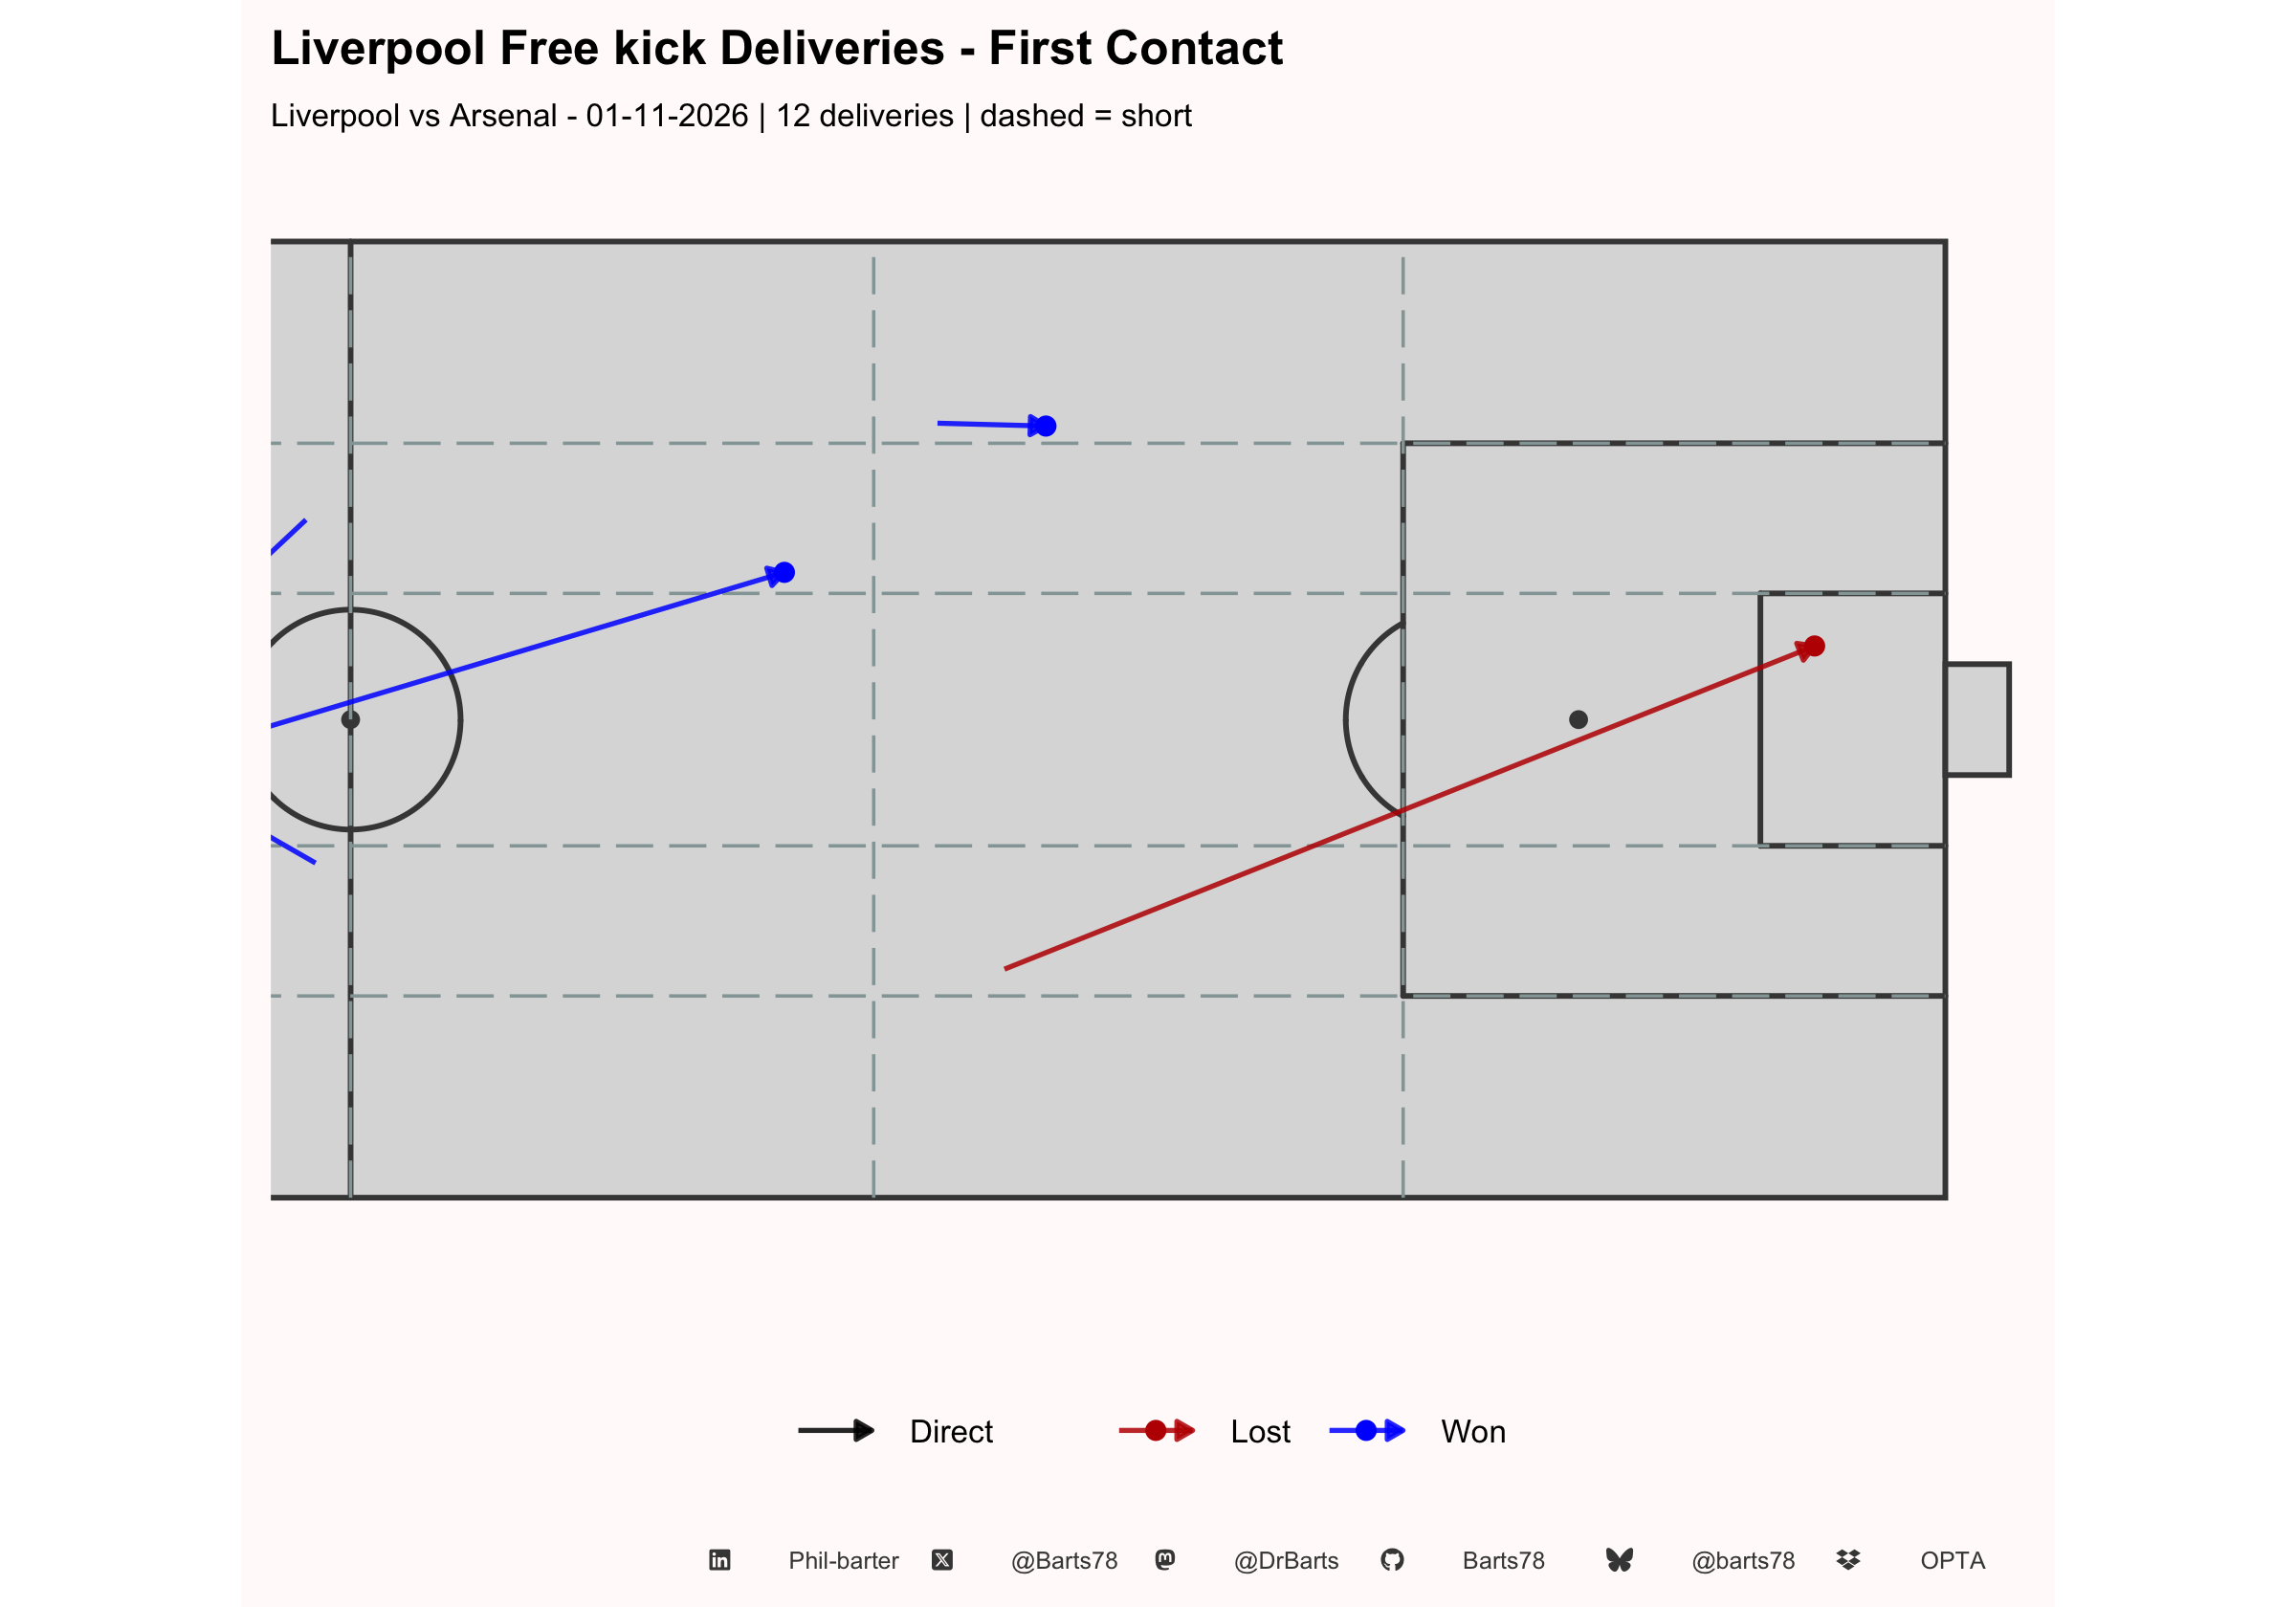
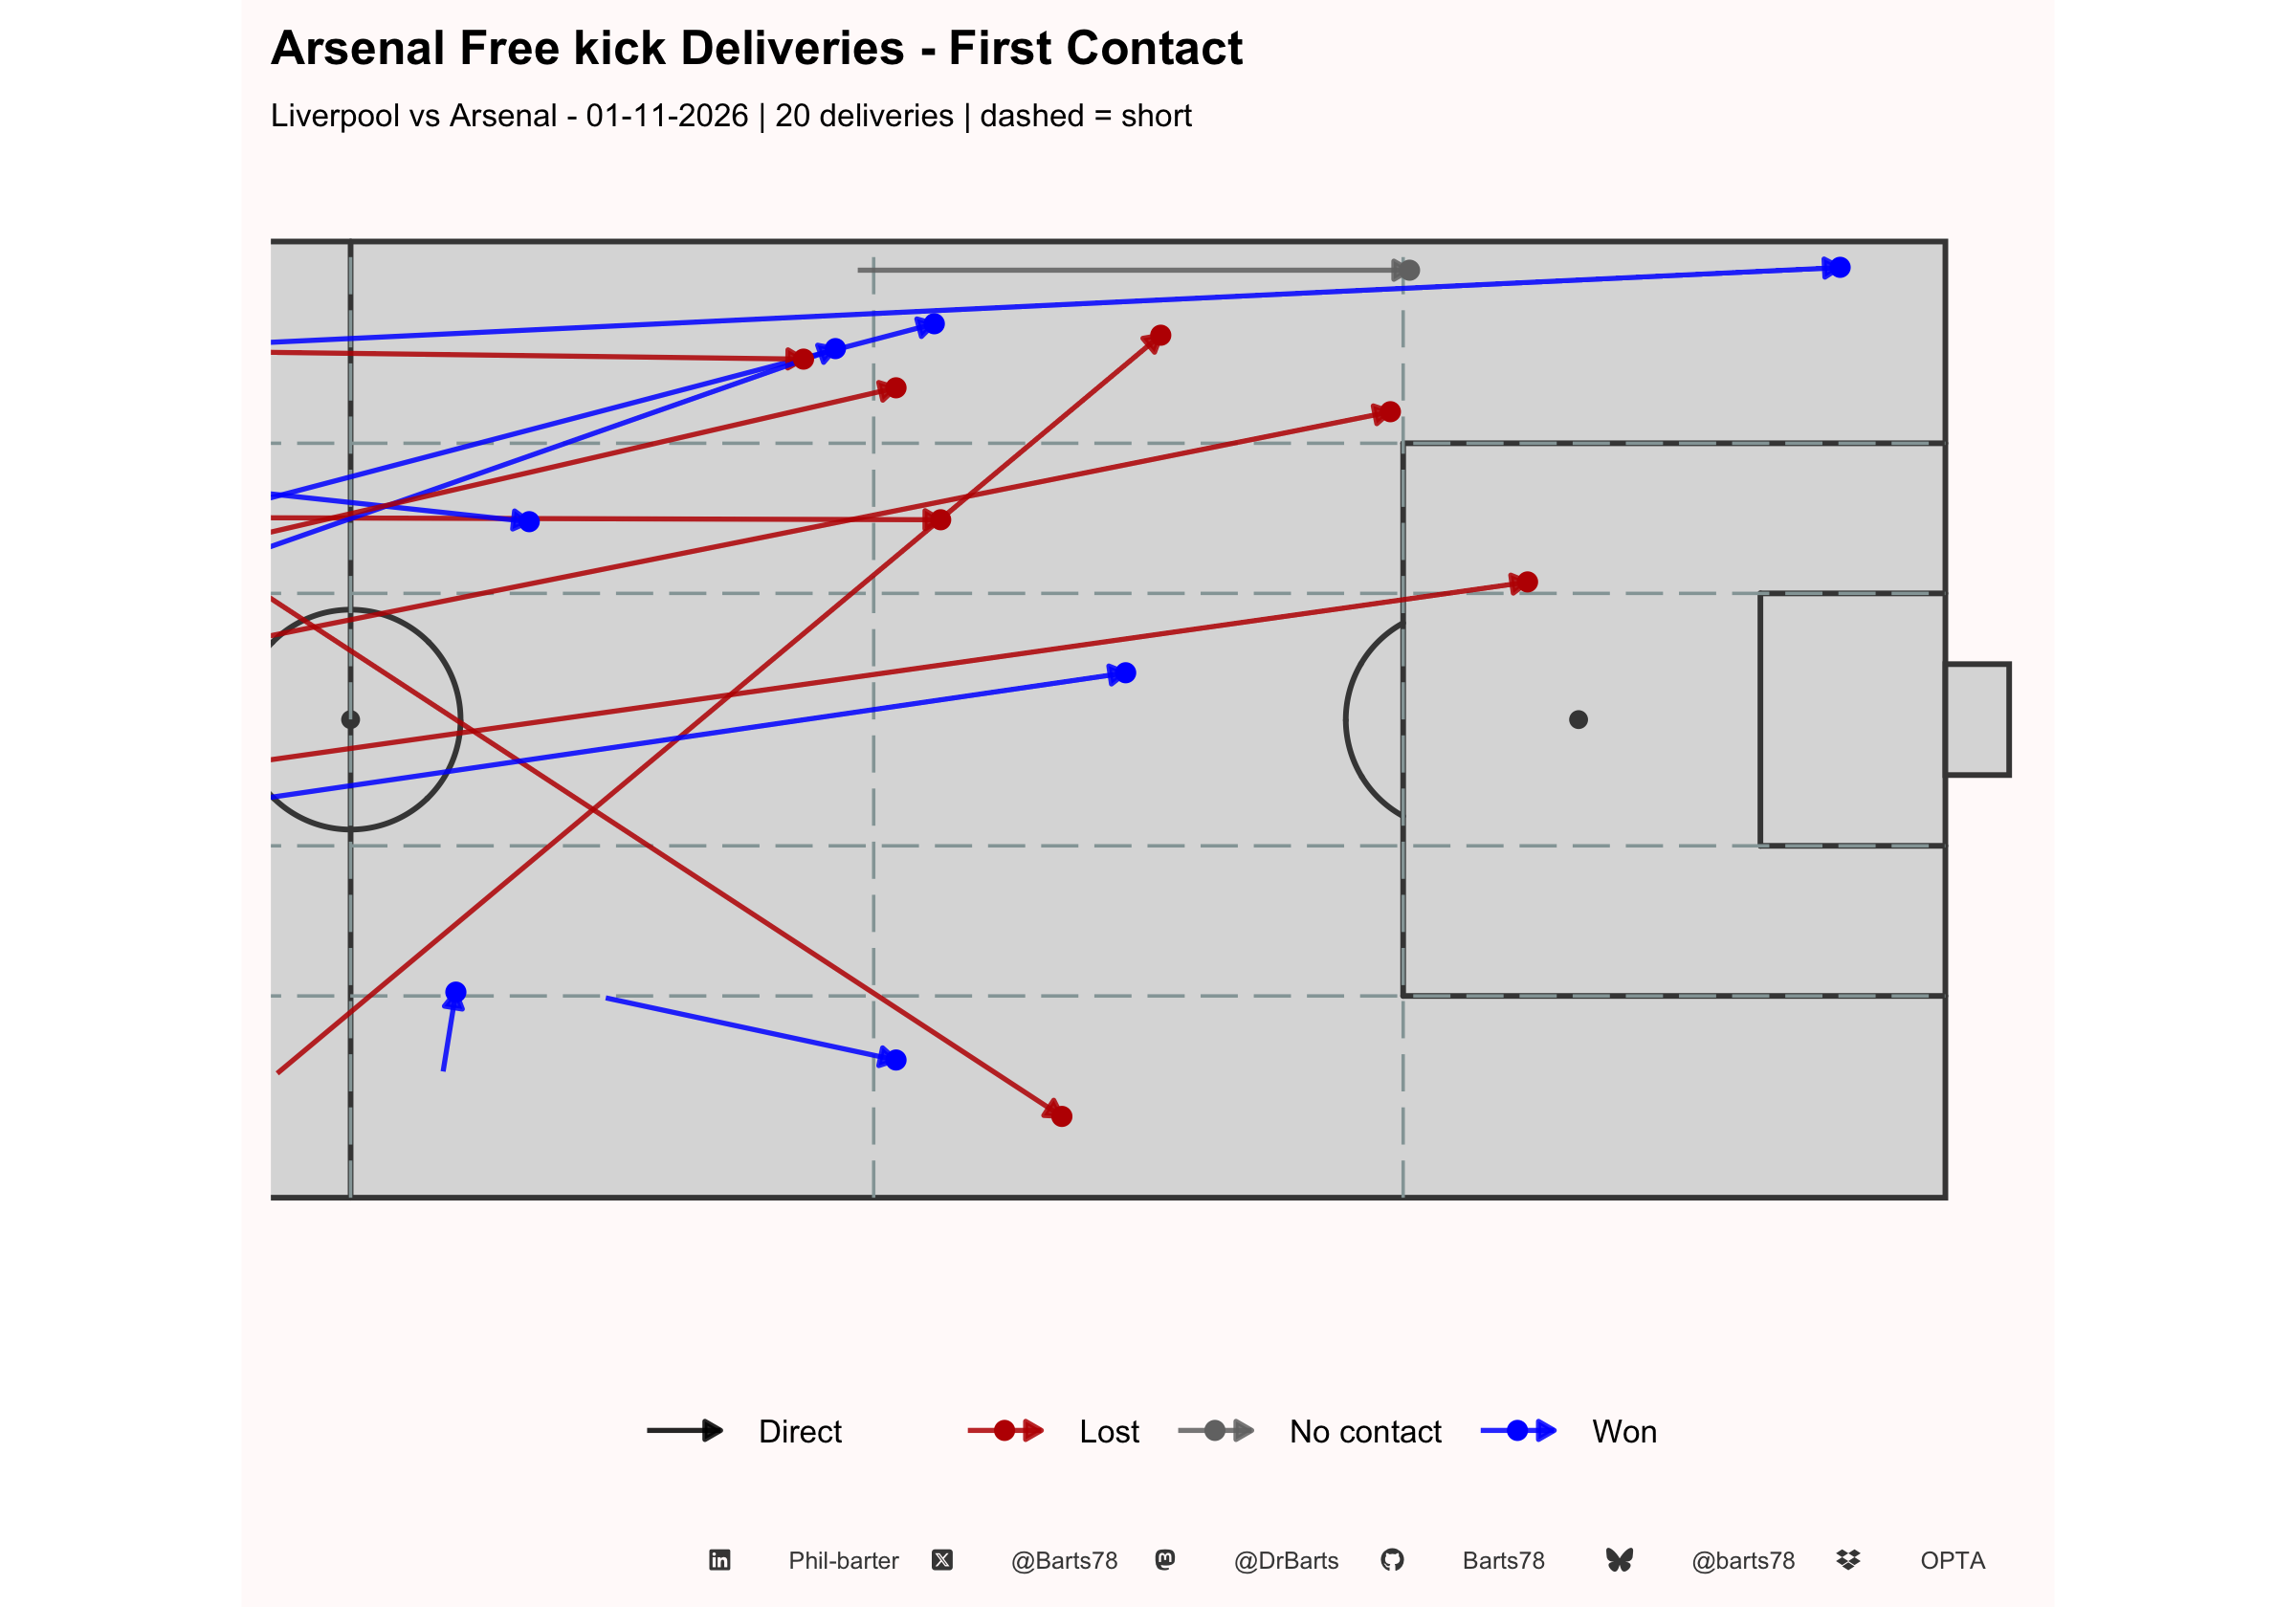
| Free kicks (passes) | 12 | 20 |
| Into final third / box | 2 | 11 |
| Into box | 1 | 1 |
| Throw-ins | ||
| Throw-ins | 25 | 18 |
| Retained (first touch) | 80% | 89% |
| Shots by situation | ||
| Open-play shots | 13 | 9 |
| Open-play xG | 0.93 | 0.95 |
| Open-play goals | 0 | 1 |
| Set-piece shots | 4 | 1 |
| Set-piece xG | 0.12 | 0.04 |
| Set-piece goals | 0 | 0 |
| Penalties | 0 | 0 |
| Penalty xG | 0.00 | 0.00 |
| Set-piece share of xG | 11% | 4% |
| First contact: the team that touches the ball first after the delivery (aerial duels go to the winner). Throw-ins retained = first touch by the taking team. | ||
| X @Barts78 · Bluesky @barts78 · Mastodon @DrBarts · GitHub Barts78 · LinkedIn Phil-barter · Data: Opta | ||
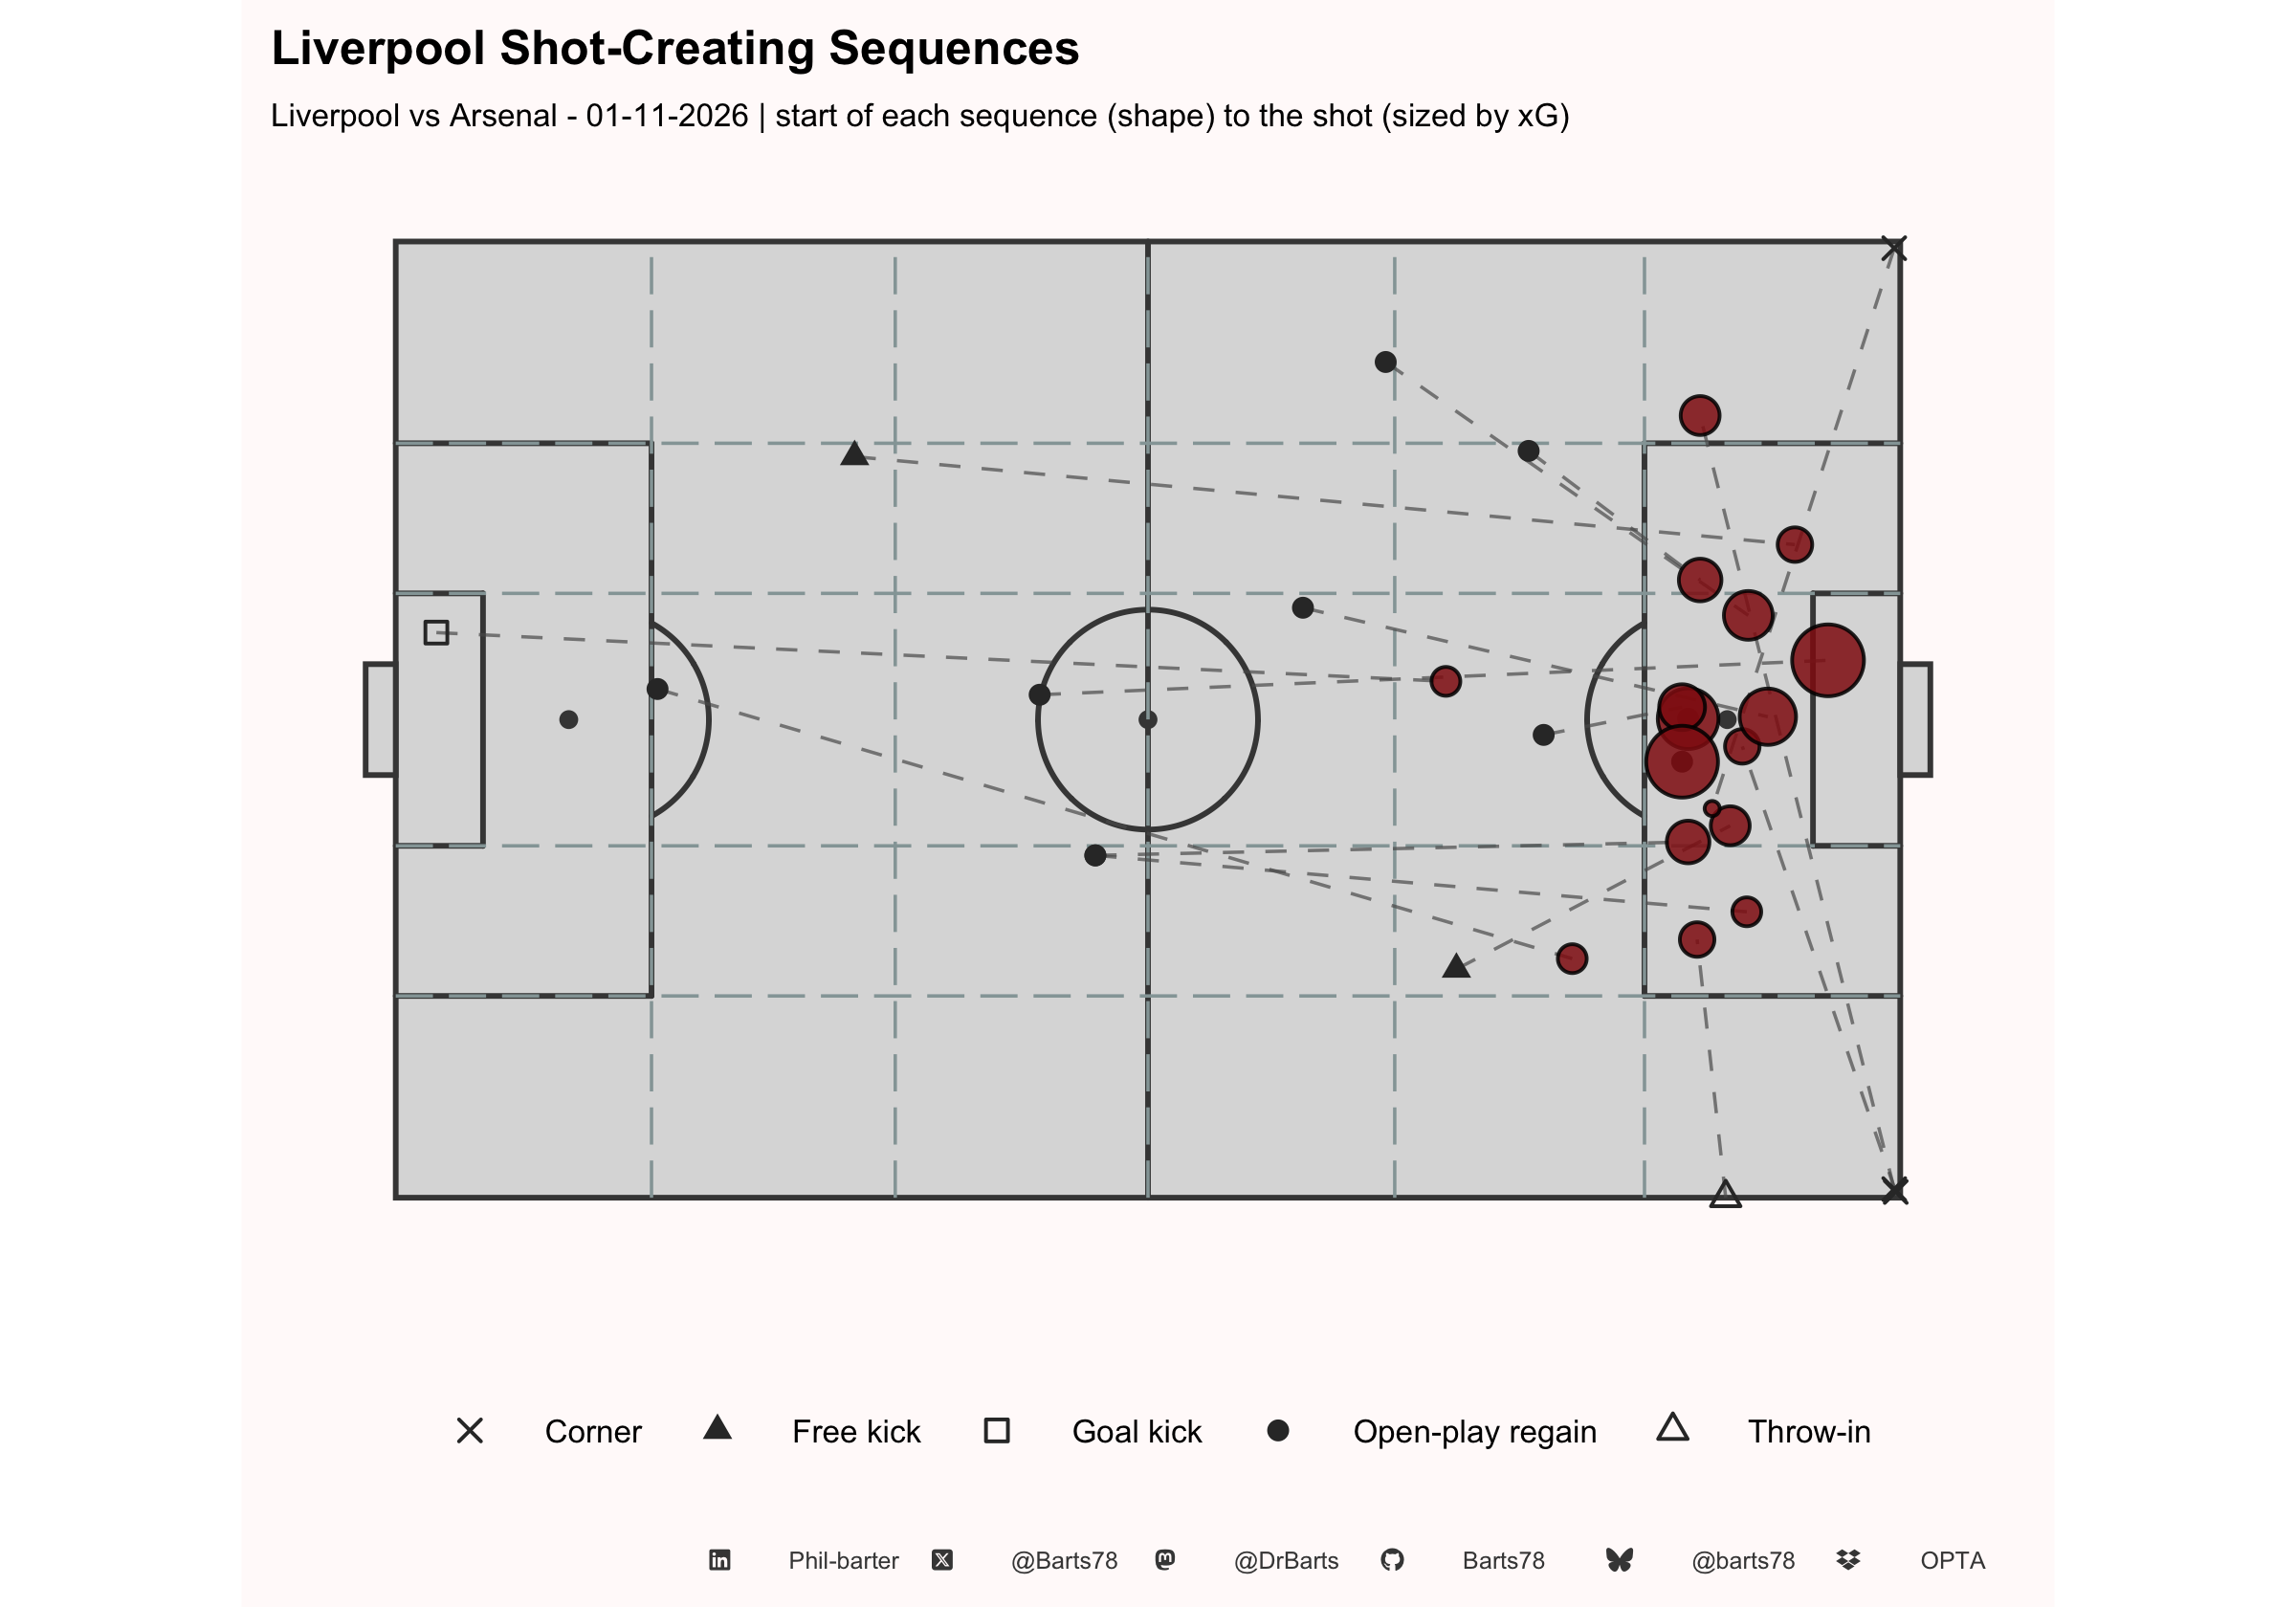
| Liverpool - Shot-Creating Sequences | |||||||||
| Liverpool vs Arsenal - 01-11-2026 | |||||||||
| Min | Shooter | Result | xG | Situation | Started by | Started from | Start zone | Passes | Duration (s) |
|---|---|---|---|---|---|---|---|---|---|
| 27' | Gakpo | Blocked | 0.04 | Set piece | Wirtz | Free kick | Att third, Right half-space | 4 | 13 |
| 27' | van Dijk | Off target | 0.03 | Set piece | Gakpo | Corner | Att third, Right wing | 1 | 3 |
| 28' | Araujo | Blocked | 0.01 | Set piece | Gakpo | Corner | Att third, Left wing | 5 | 15 |
| 31' | Kerkez | Off target | 0.12 | Open play | Kerkez | Open-play regain | Att third, Central | 0 | 0 |
| 33' | Mac Allister | Off target | 0.02 | Open play | Mac Allister | Open-play regain | Def third, Central | 3 | 18 |
| 36' | Isak | Off target | 0.05 | Open play | Nyoni | Open-play regain | Att third, Left half-space | 3 | 11 |
| 39' | Wirtz | Post | 0.04 | Set piece | Gakpo | Corner | Att third, Right wing | 3 | 89 |
| 43' | Mac Allister | Off target | 0.10 | Open play | Jacquet | Open-play regain | Mid third, Central | 3 | 10 |
| 54' | Wirtz | Blocked | 0.06 | Open play | Nyoni | Open-play regain | Att third, Central | 1 | 2 |
| 56' | Isak | Off target | 0.03 | Open play | Nyoni | Free kick | Def third, Left half-space | 4 | 15 |
| 66' | Wirtz | Blocked | 0.18 | Open play | Wirtz | Open-play regain | Att third, Central | 0 | 0 |
| 75' | van Dijk | Blocked | 0.02 | Open play | van Dijk | Goal kick | Def third, Central | 21 | 56 |
| 77' | Araujo | Blocked | 0.18 | Open play | Mac Allister | Open-play regain | Mid third, Central | 13 | 47 |
| 87' | Ngumoha | Blocked | 0.03 | Open play | Ngumoha | Throw-in | Att third, Right wing | 7 | 28 |
| 90+1' | Muñoz | Blocked | 0.02 | Open play | Mac Allister | Open-play regain | Mid third, Right half-space | 7 | 16 |
| 90+1' | Ngumoha | Blocked | 0.05 | Open play | Mac Allister | Open-play regain | Mid third, Right half-space | 7 | 19 |
| 90+2' | Barcola | Off target | 0.07 | Open play | Koumas | Open-play regain | Mid third, Left wing | 5 | 19 |
| X @Barts78 · Bluesky @barts78 · Mastodon @DrBarts · GitHub Barts78 · LinkedIn Phil-barter · Data: Opta | |||||||||
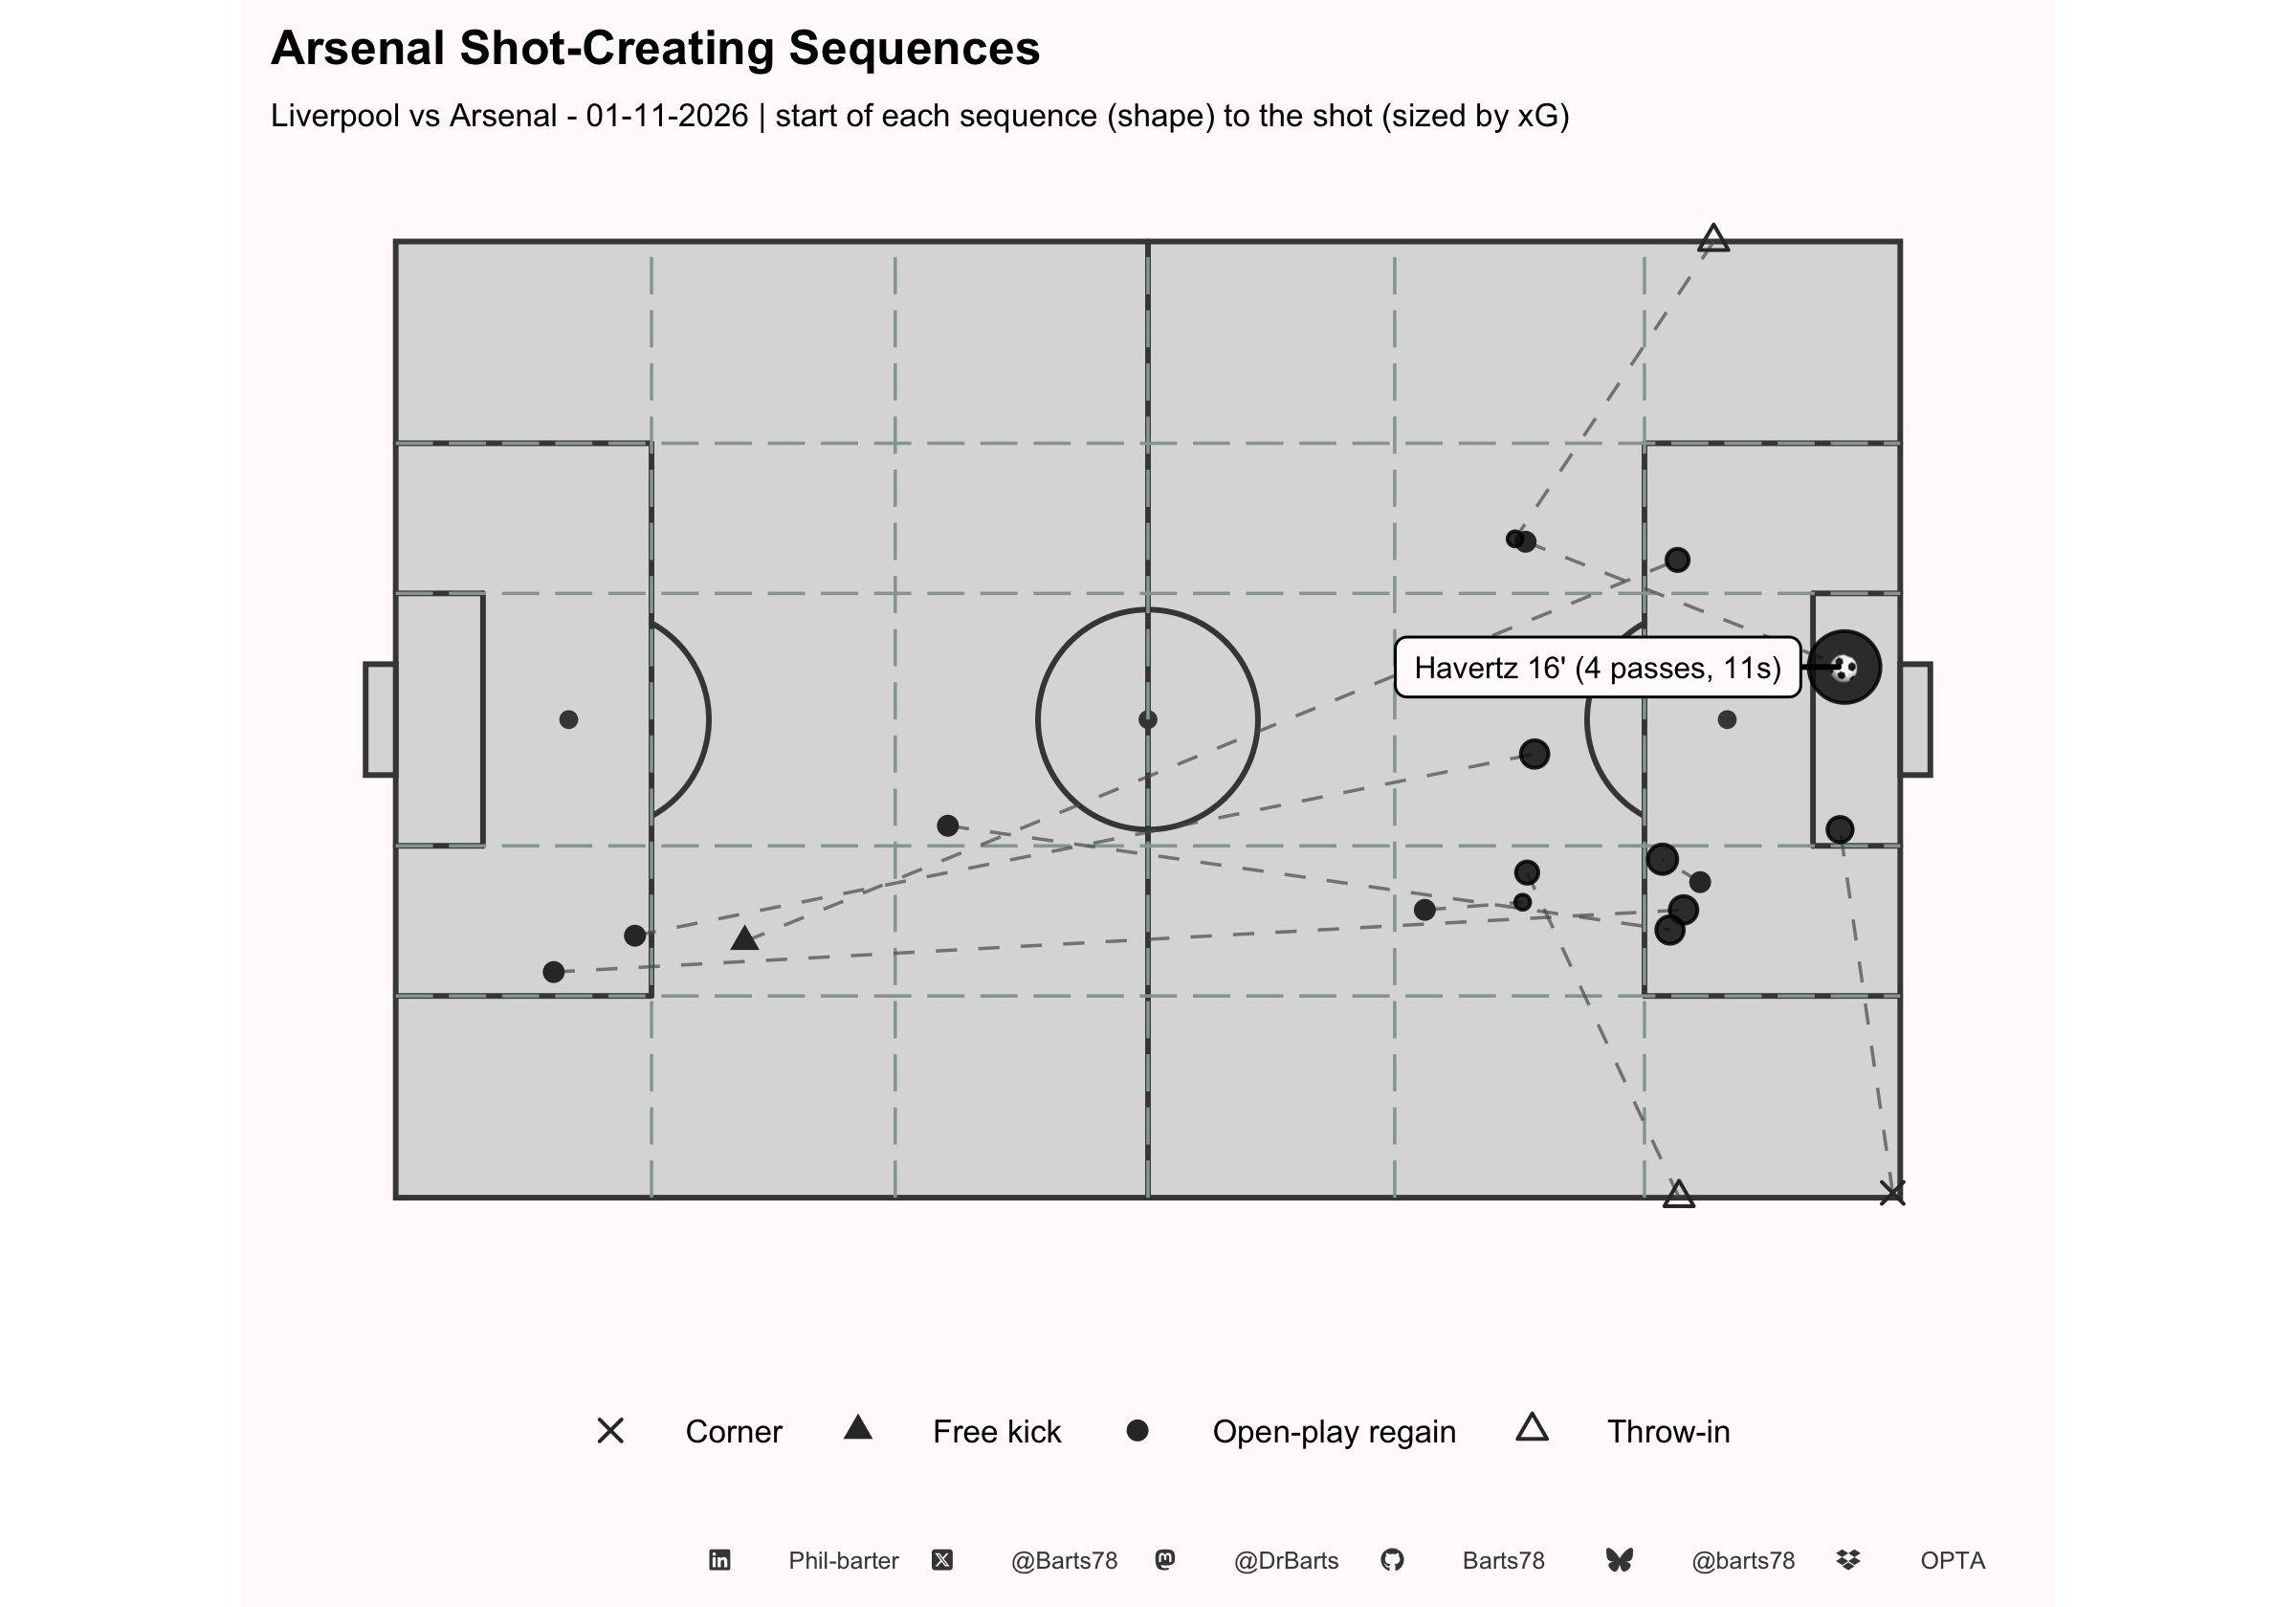
| Arsenal - Shot-Creating Sequences | |||||||||
| Liverpool vs Arsenal - 01-11-2026 | |||||||||
| Min | Shooter | Result | xG | Situation | Started by | Started from | Start zone | Passes | Duration (s) |
|---|---|---|---|---|---|---|---|---|---|
| 15' | Rice | Off target | 0.02 | Open play | Calafiori | Throw-in | Att third, Left wing | 8 | 24 |
| 16' | Havertz | Goal | 0.64 | Open play | Ødegaard | Open-play regain | Att third, Left half-space | 4 | 11 |
| 24' | Guimarães | Off target | 0.05 | Open play | Madueke | Open-play regain | Def third, Right half-space | 7 | 24 |
| 25' | Rice | Saved | 0.06 | Open play | Ødegaard | Open-play regain | Att third, Right half-space | 1 | 1 |
| 45+1' | Rice | Blocked | 0.05 | Open play | Madueke | Open-play regain | Def third, Right half-space | 14 | 47 |
| 55' | Guimarães | Off target | 0.05 | Open play | Timber | Open-play regain | Mid third, Central | 6 | 34 |
| 65' | Madueke | Blocked | 0.03 | Open play | Timber | Throw-in | Att third, Right wing | 3 | 9 |
| 71' | Timber | Blocked | 0.02 | Open play | Lewis-Skelly | Open-play regain | Att third, Right half-space | 1 | 4 |
| 73' | Tzolis | Saved | 0.03 | Open play | Konsa | Free kick | Def third, Right half-space | 11 | 32 |
| 74' | Lewis-Skelly | Off target | 0.04 | Set piece | Ødegaard | Corner | Att third, Right wing | 1 | 2 |
| X @Barts78 · Bluesky @barts78 · Mastodon @DrBarts · GitHub Barts78 · LinkedIn Phil-barter · Data: Opta | |||||||||
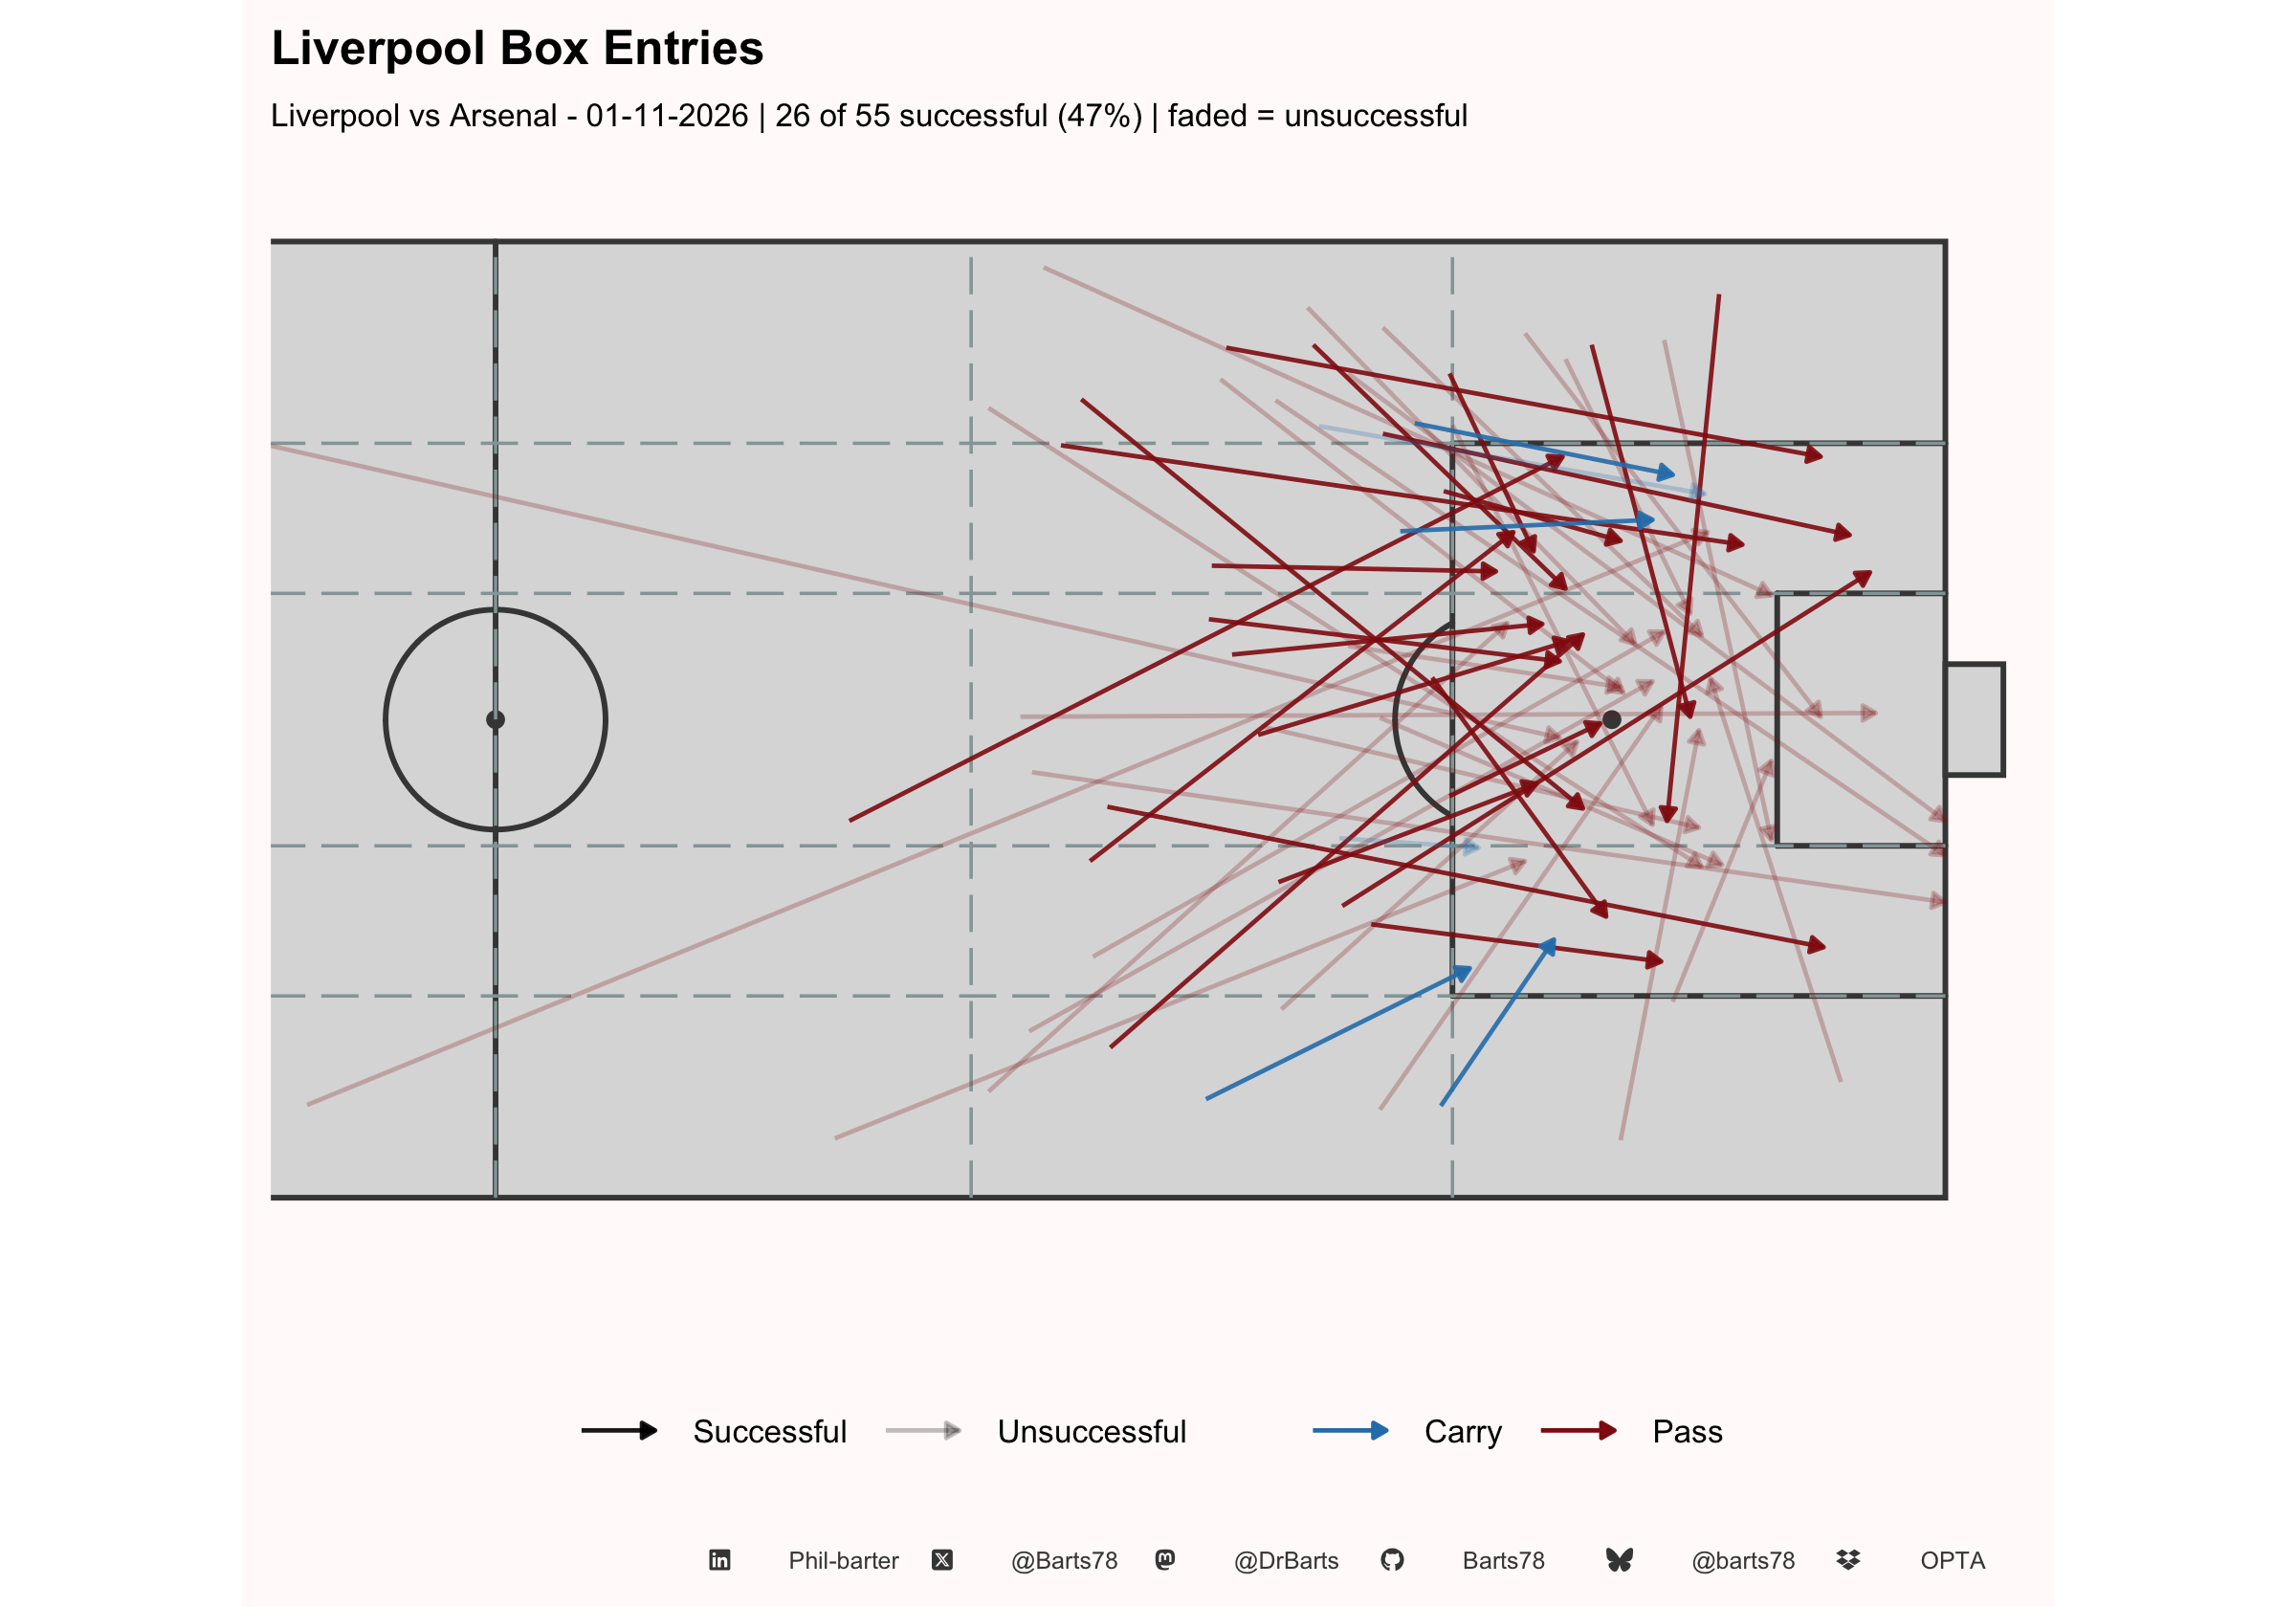
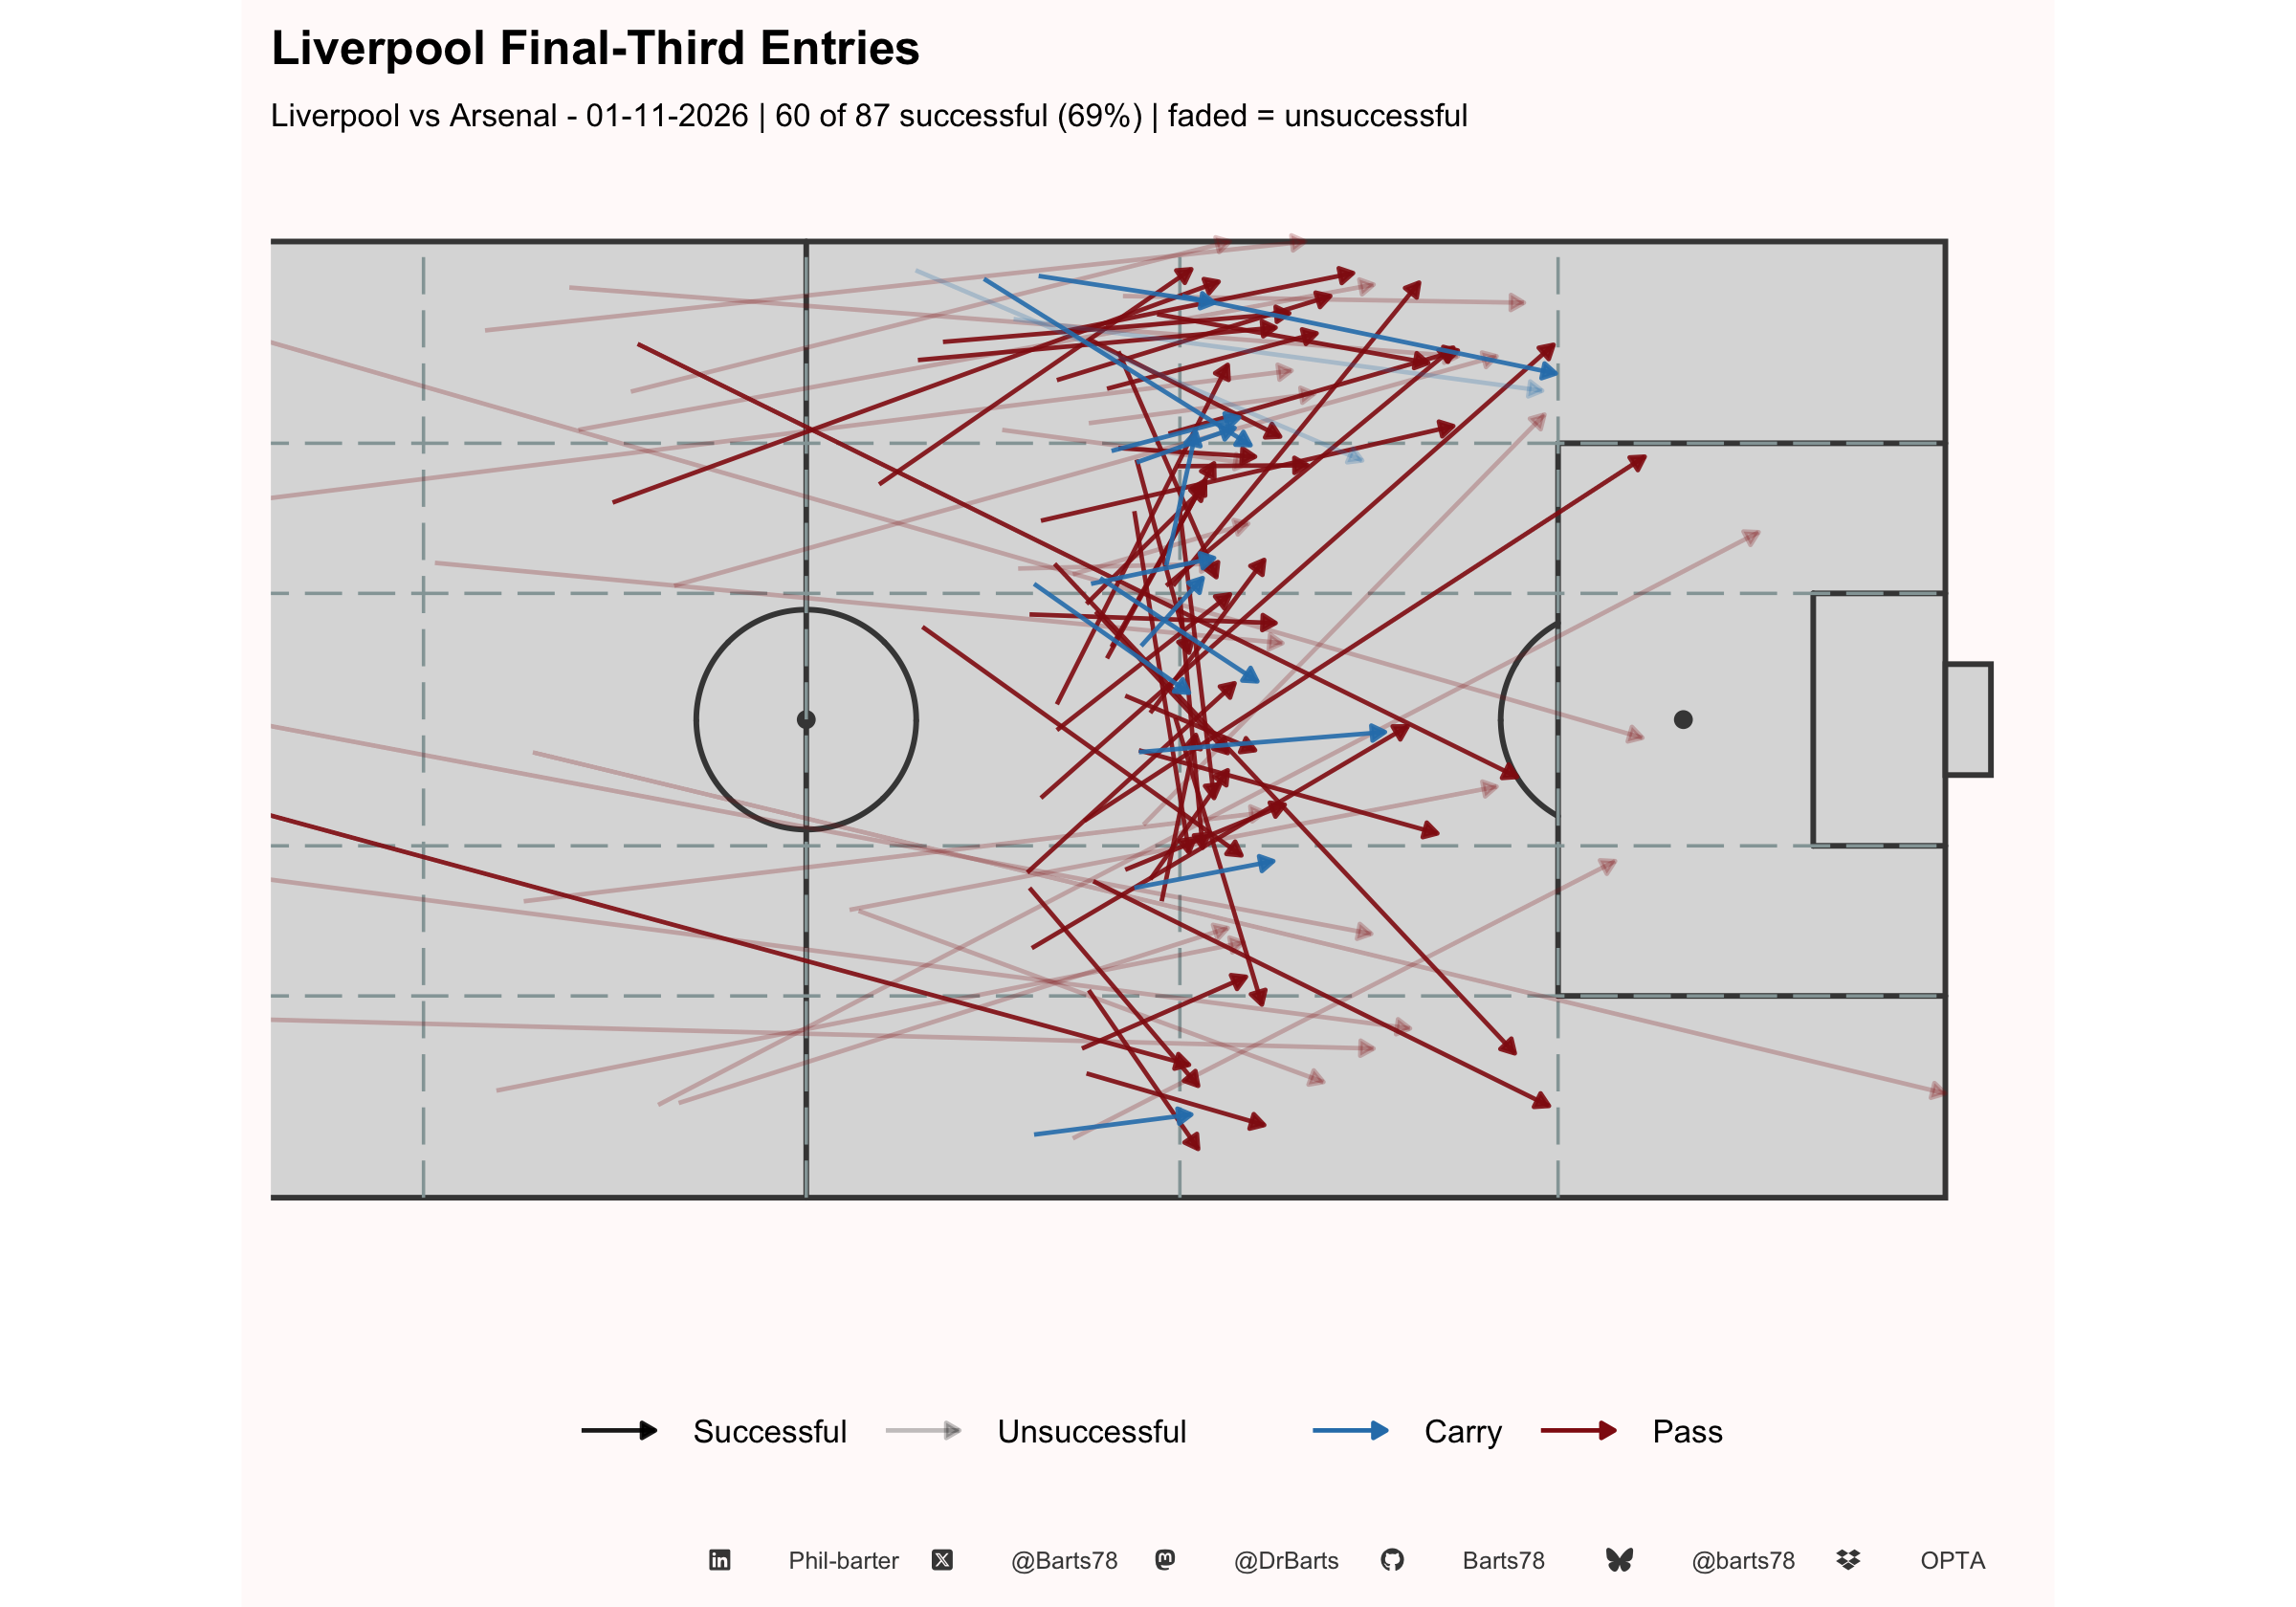
| Box and Final-Third Entries (open play) | ||||||||
| Liverpool vs Arsenal - 01-11-2026 | ||||||||
Box entries
|
Final-third entries
|
|||||||
|---|---|---|---|---|---|---|---|---|
| Passes | Carries | Total | Success % | Passes | Carries | Total | Success % | |
| Liverpool | ||||||||
| Left wing | 19 | 2 | 21 | 38% | 18 | 5 | 23 | 57% |
| Left half-space | 3 | 1 | 4 | 100% | 16 | 6 | 22 | 77% |
| Central | 12 | 1 | 13 | 54% | 19 | 2 | 21 | 86% |
| Right half-space | 5 | 0 | 5 | 80% | 12 | 1 | 13 | 69% |
| Right wing | 10 | 2 | 12 | 25% | 7 | 1 | 8 | 38% |
| Total | 49 | 6 | 55 | 47% | 72 | 15 | 87 | 69% |
| Arsenal | ||||||||
| Left wing | 4 | 4 | 8 | 38% | 8 | 5 | 13 | 62% |
| Left half-space | 2 | 0 | 2 | 50% | 5 | 1 | 6 | 67% |
| Central | 1 | 1 | 2 | 0% | 10 | 0 | 10 | 30% |
| Right half-space | 5 | 1 | 6 | 67% | 5 | 1 | 6 | 67% |
| Right wing | 1 | 1 | 2 | 100% | 4 | 3 | 7 | 71% |
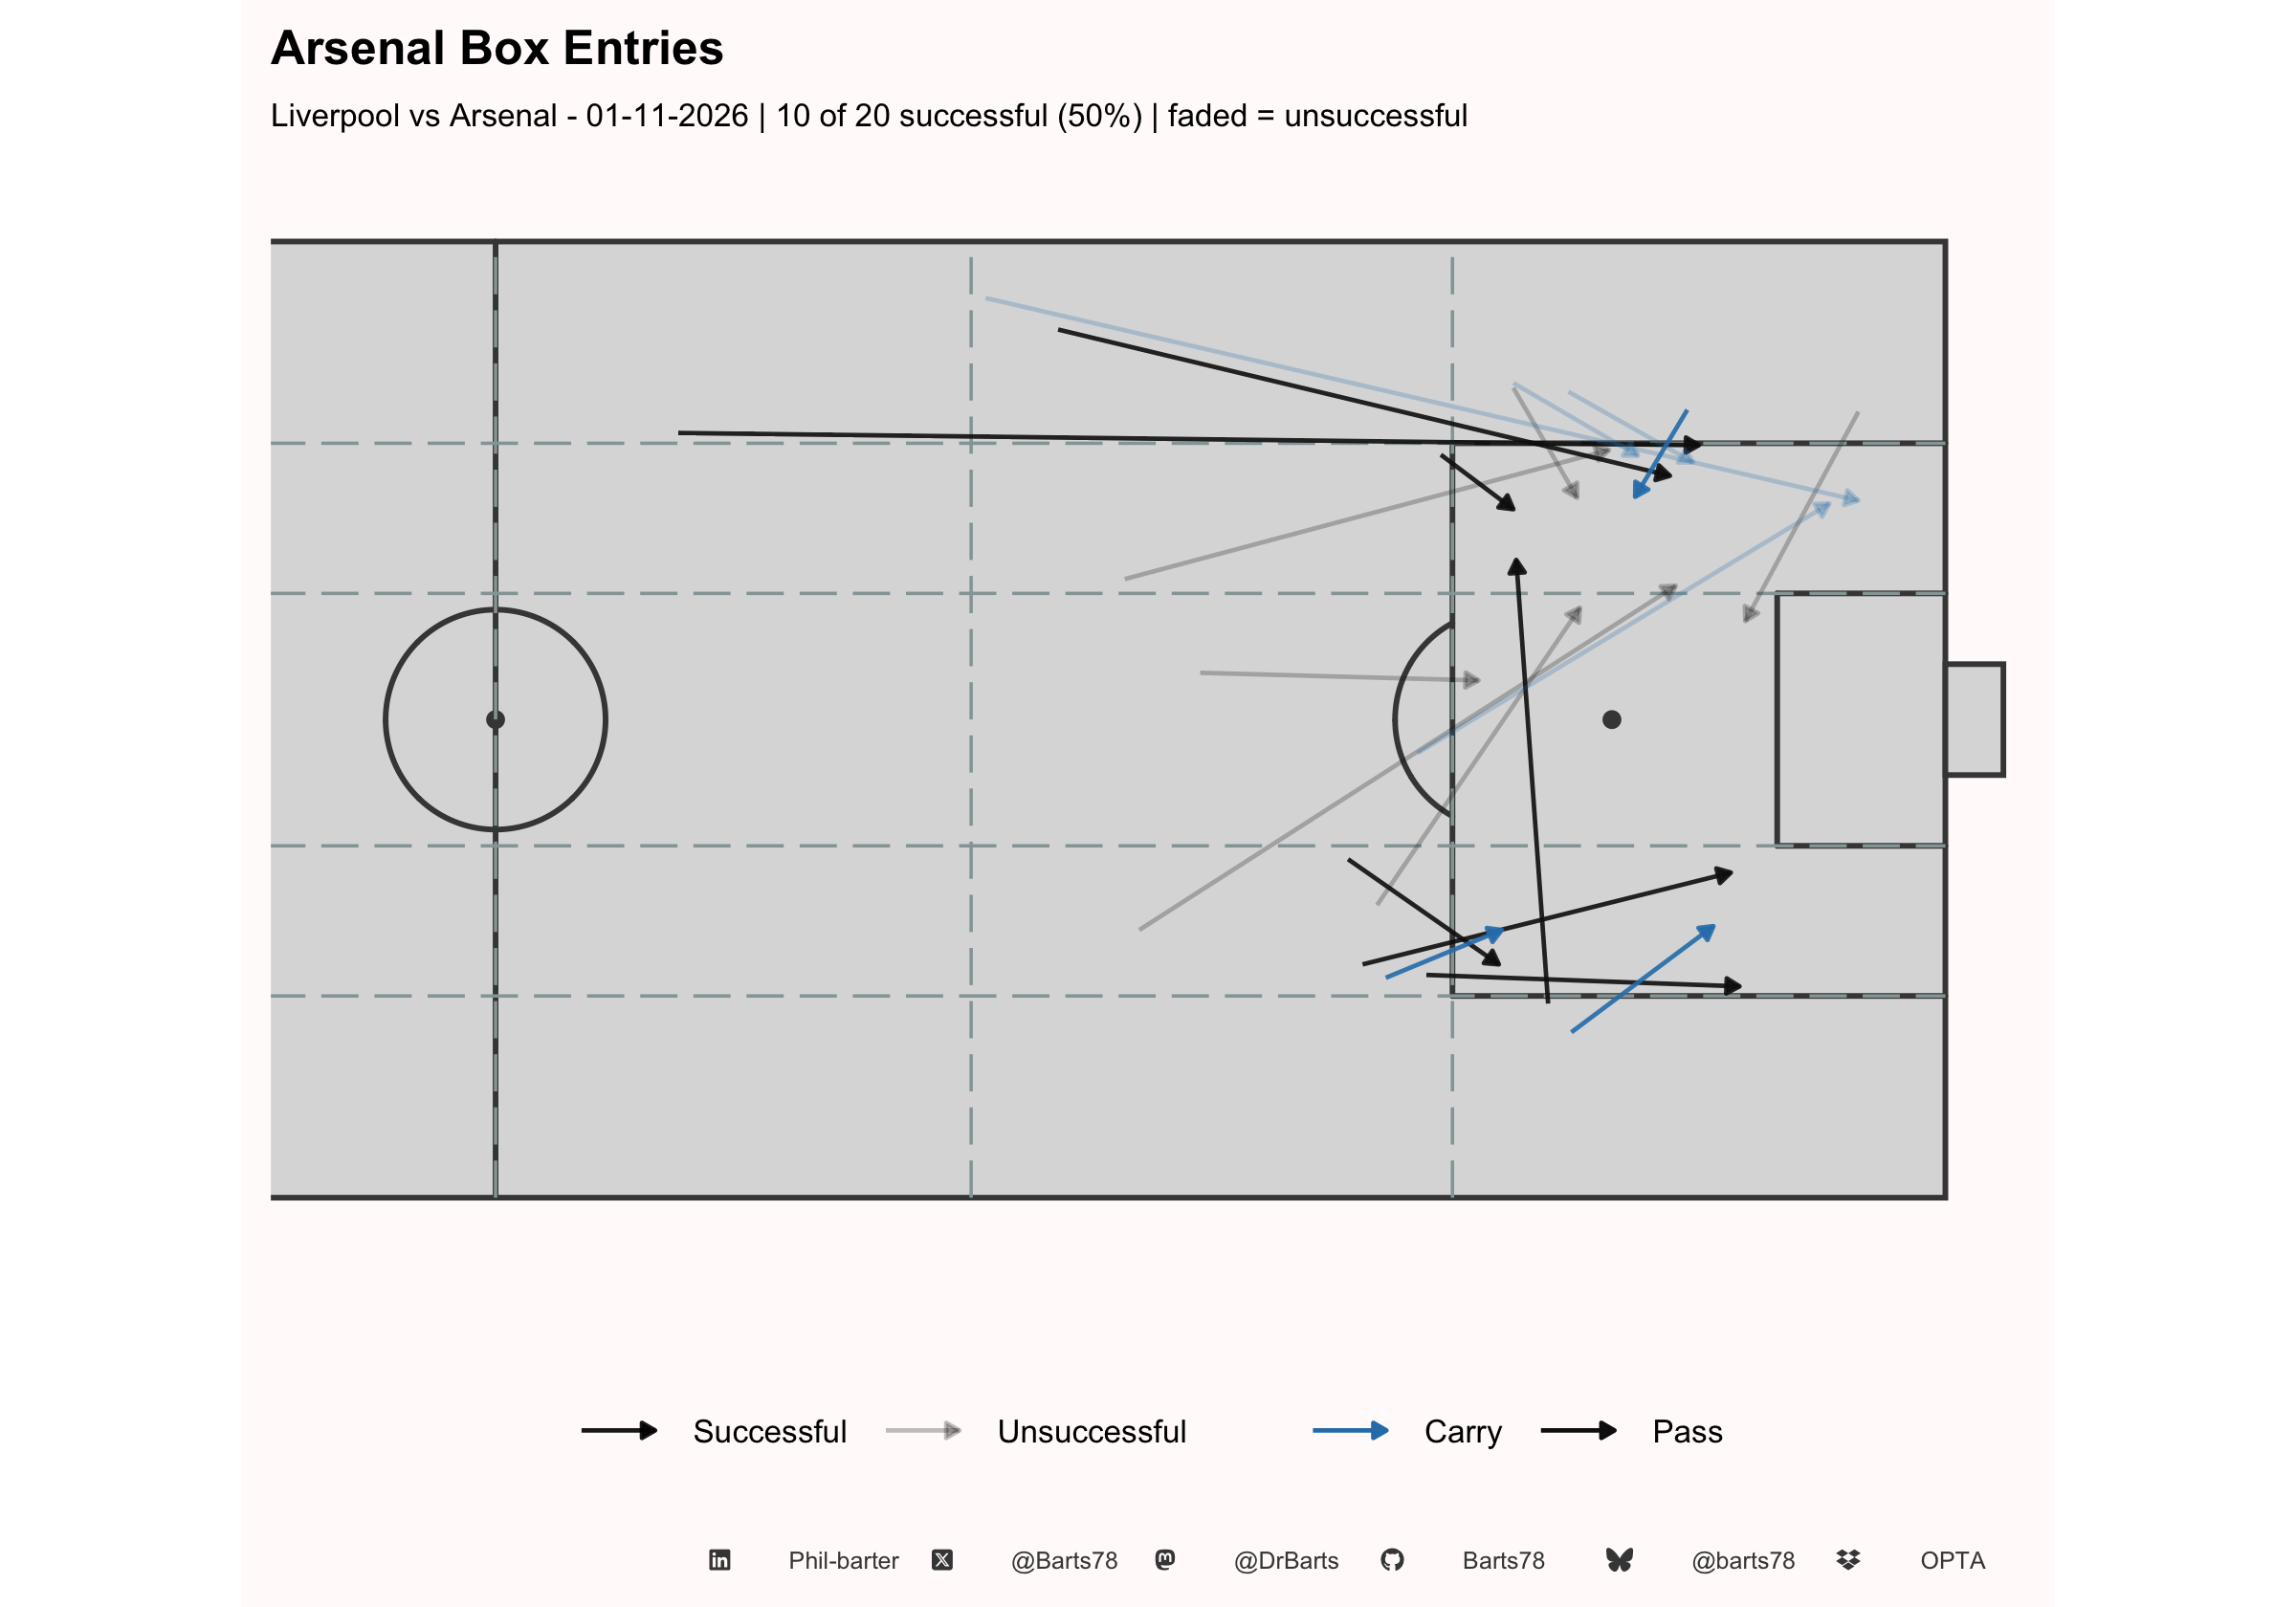
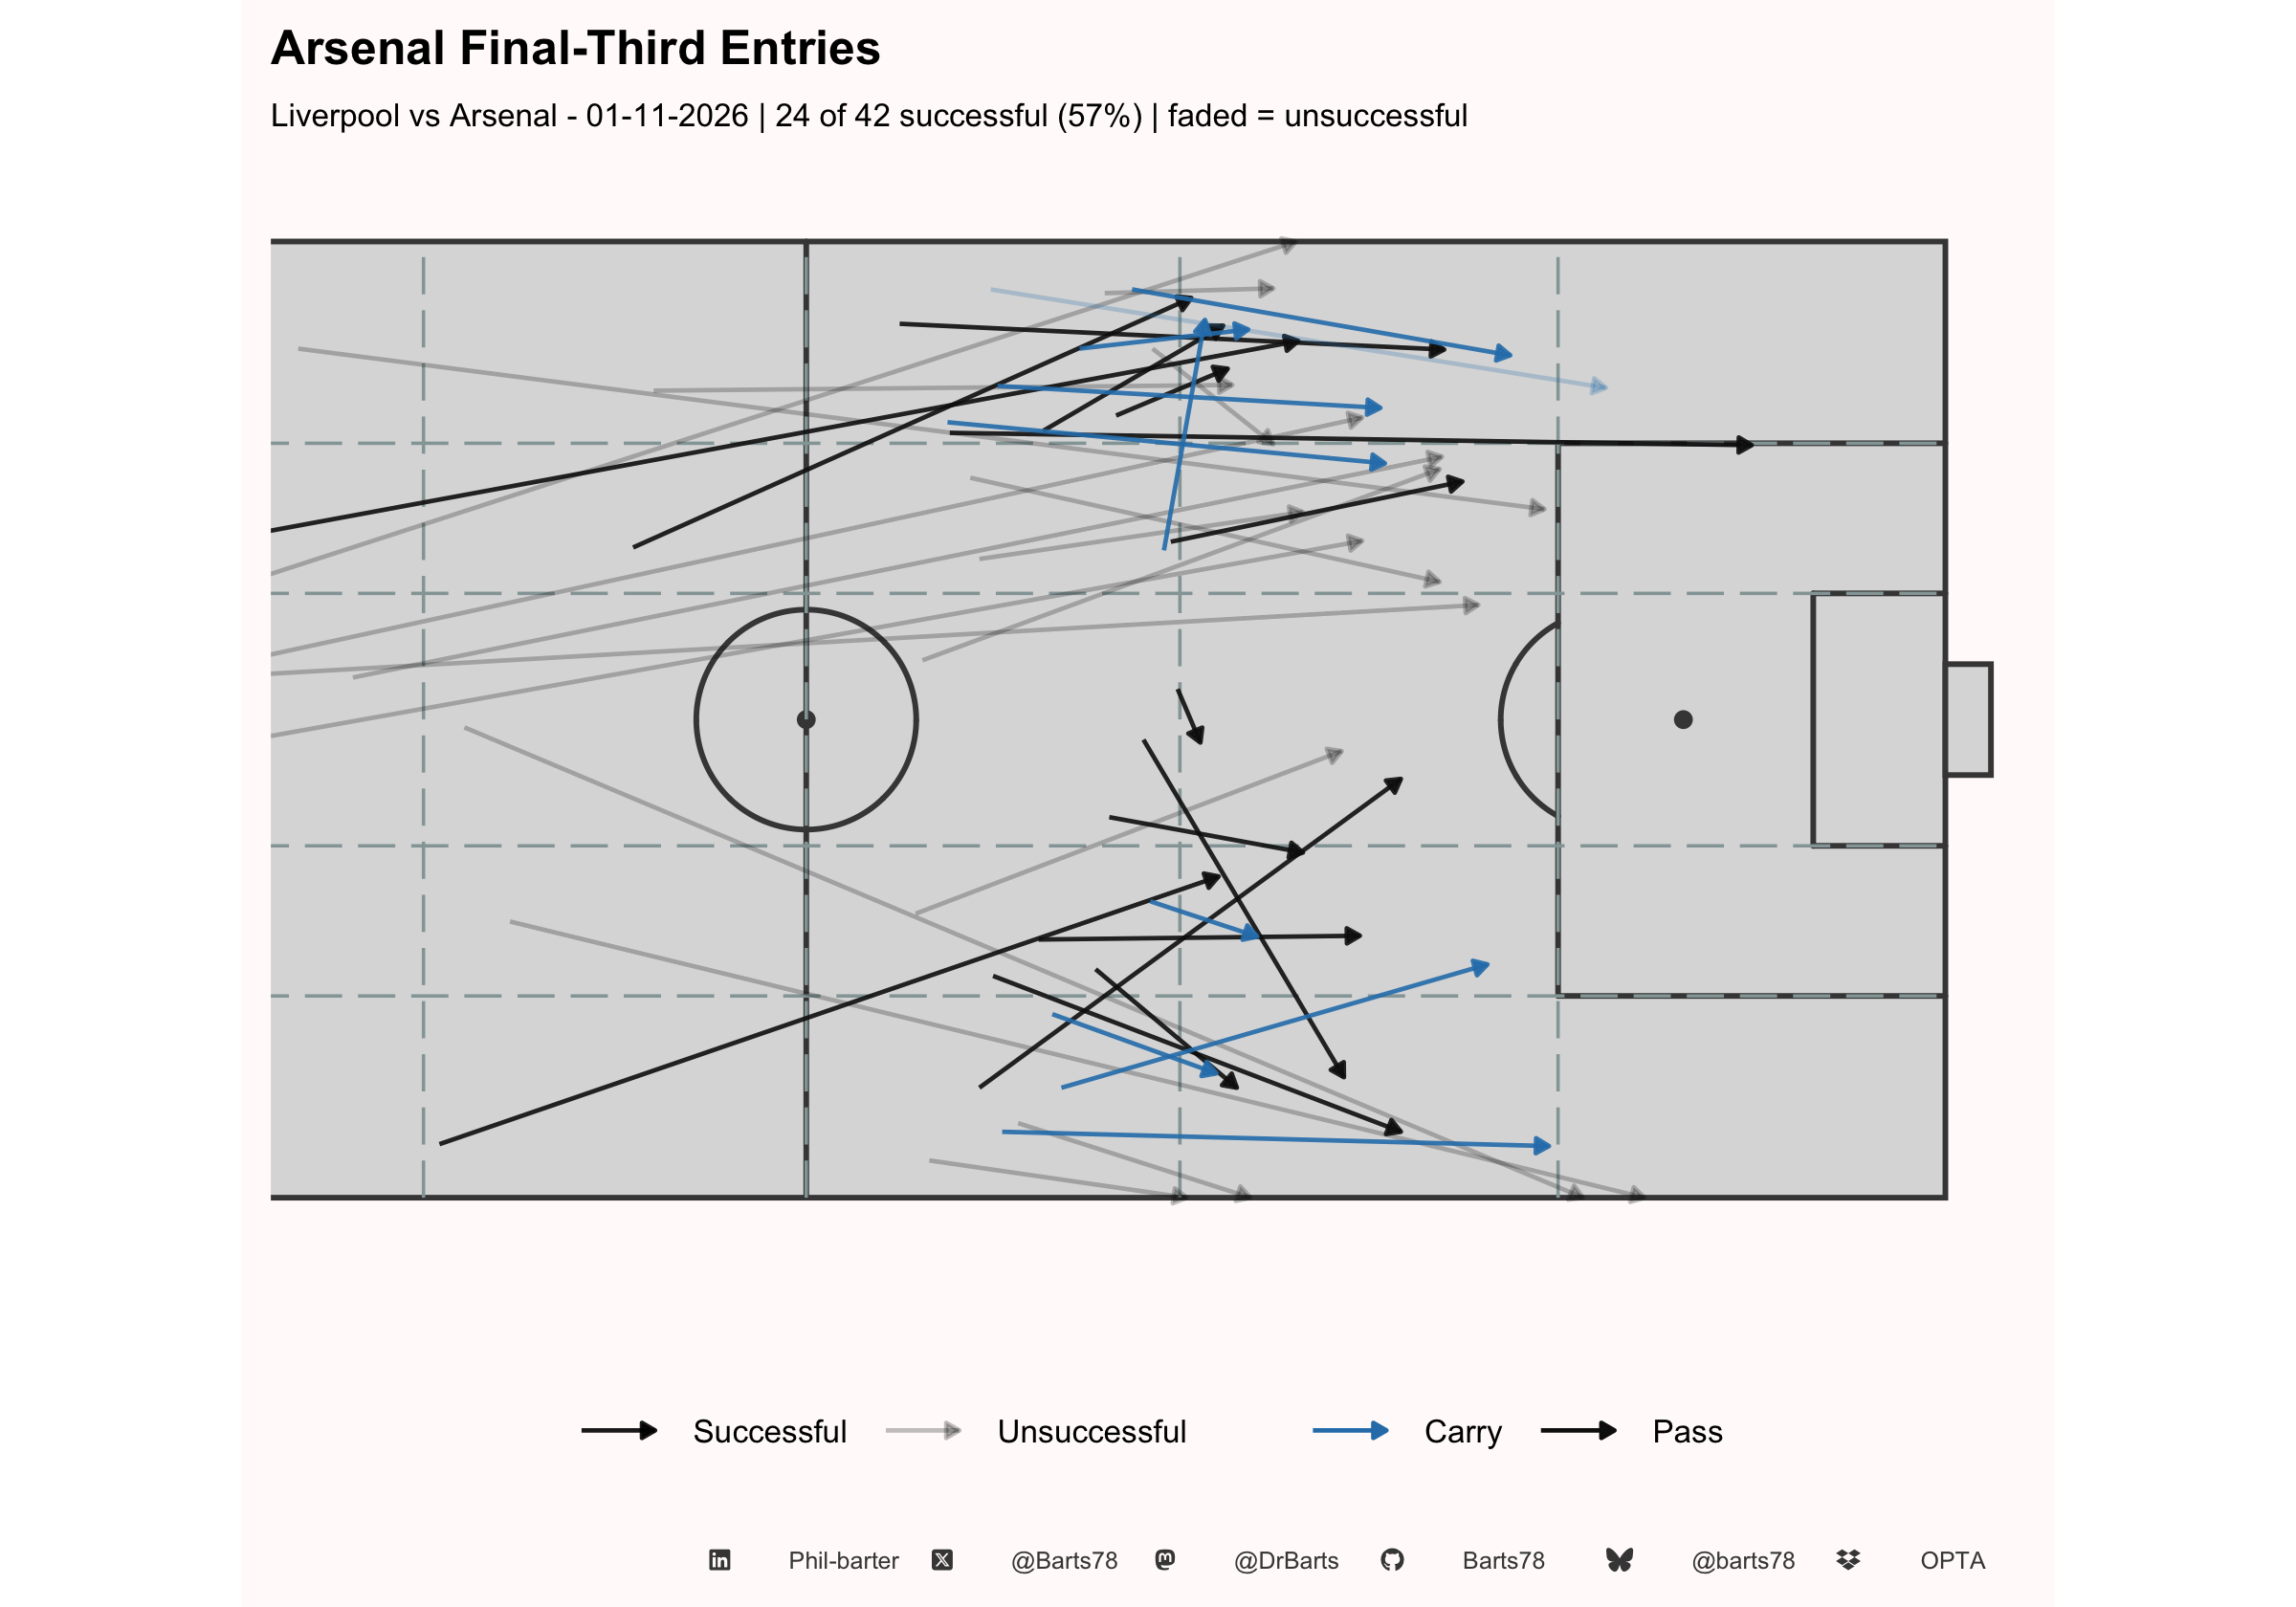
| Total | 13 | 7 | 20 | 50% | 32 | 10 | 42 | 57% |
| Channel = where the pass or carry started. Left/right from the attacking team's view. Set pieces excluded. | ||||||||
| X @Barts78 · Bluesky @barts78 · Mastodon @DrBarts · GitHub Barts78 · LinkedIn Phil-barter · Data: Opta | ||||||||
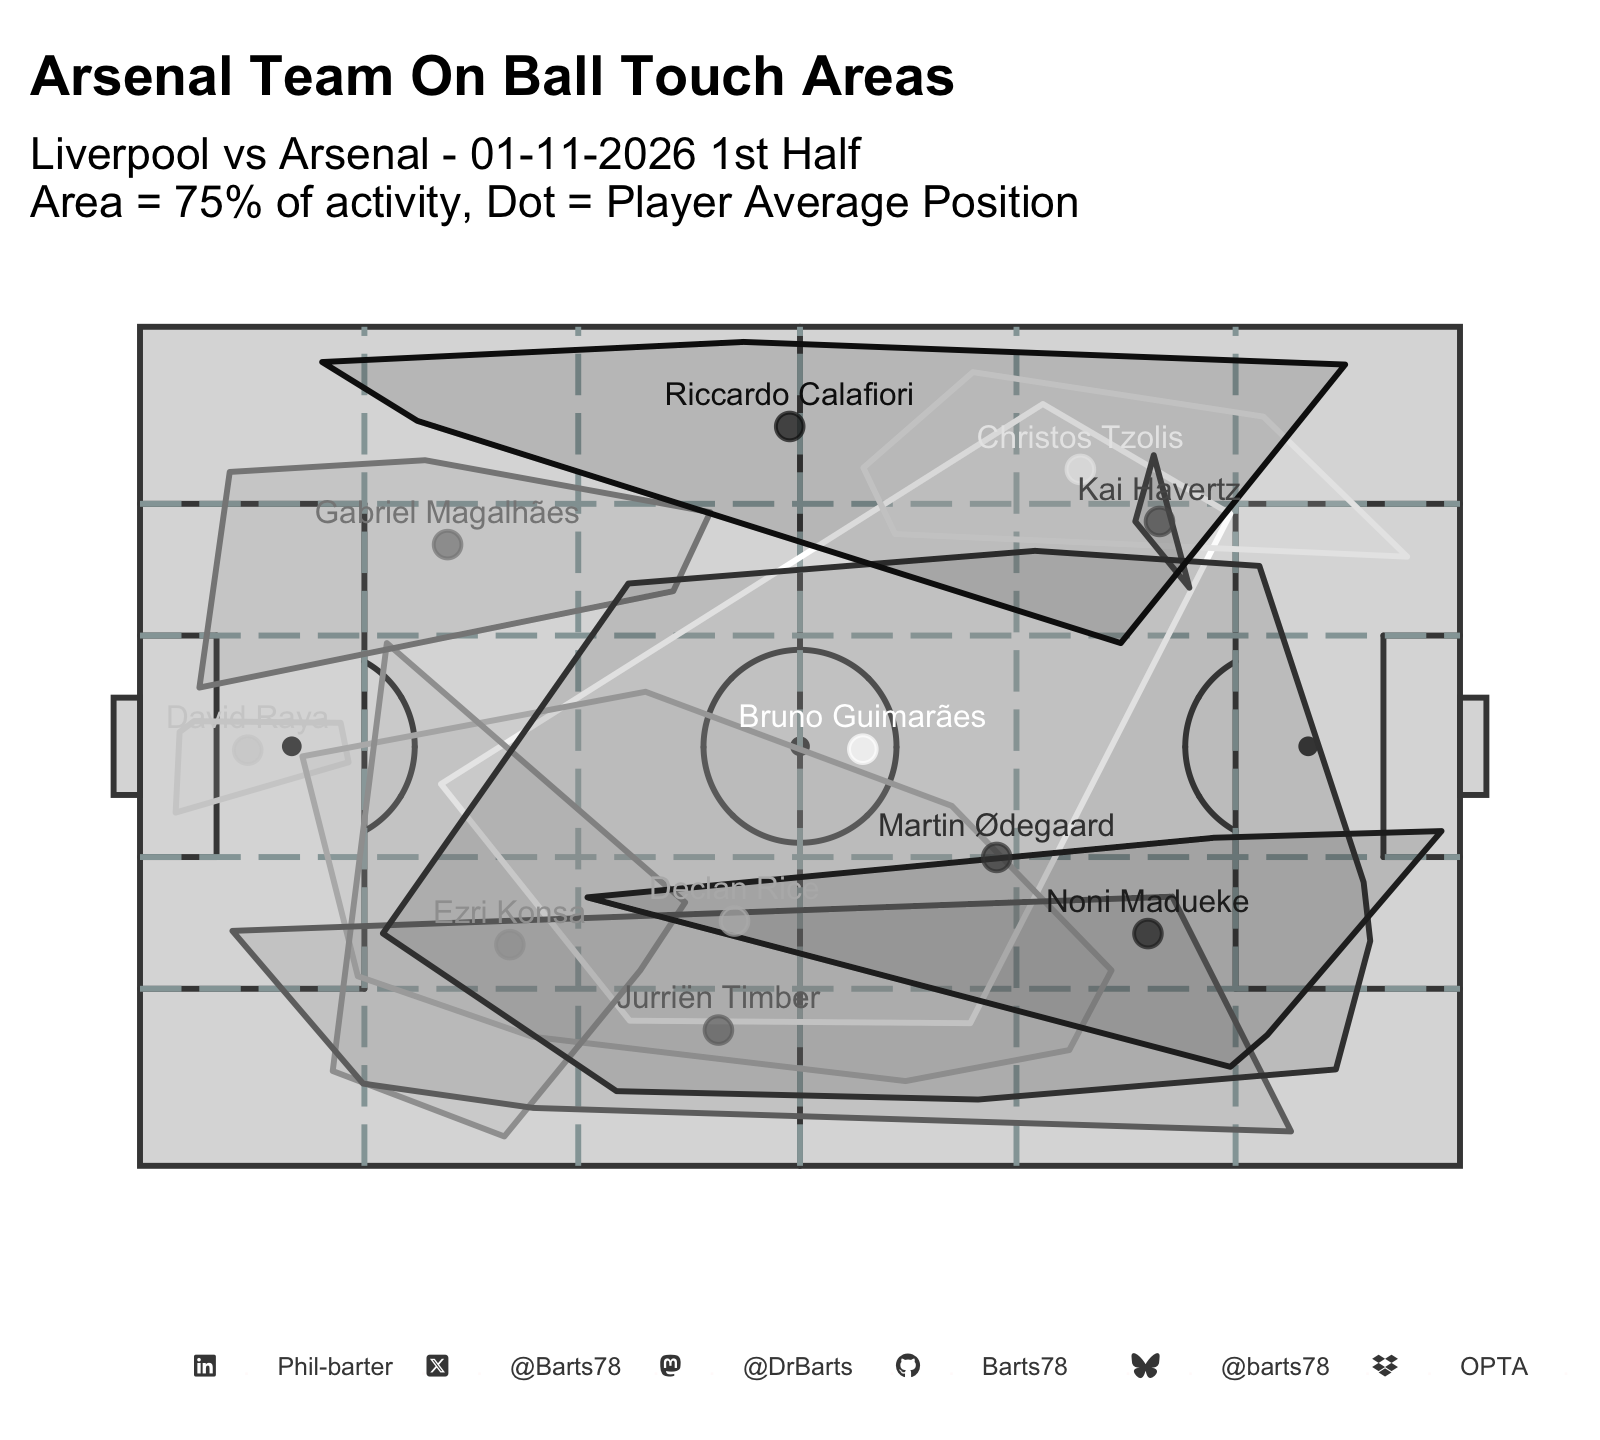
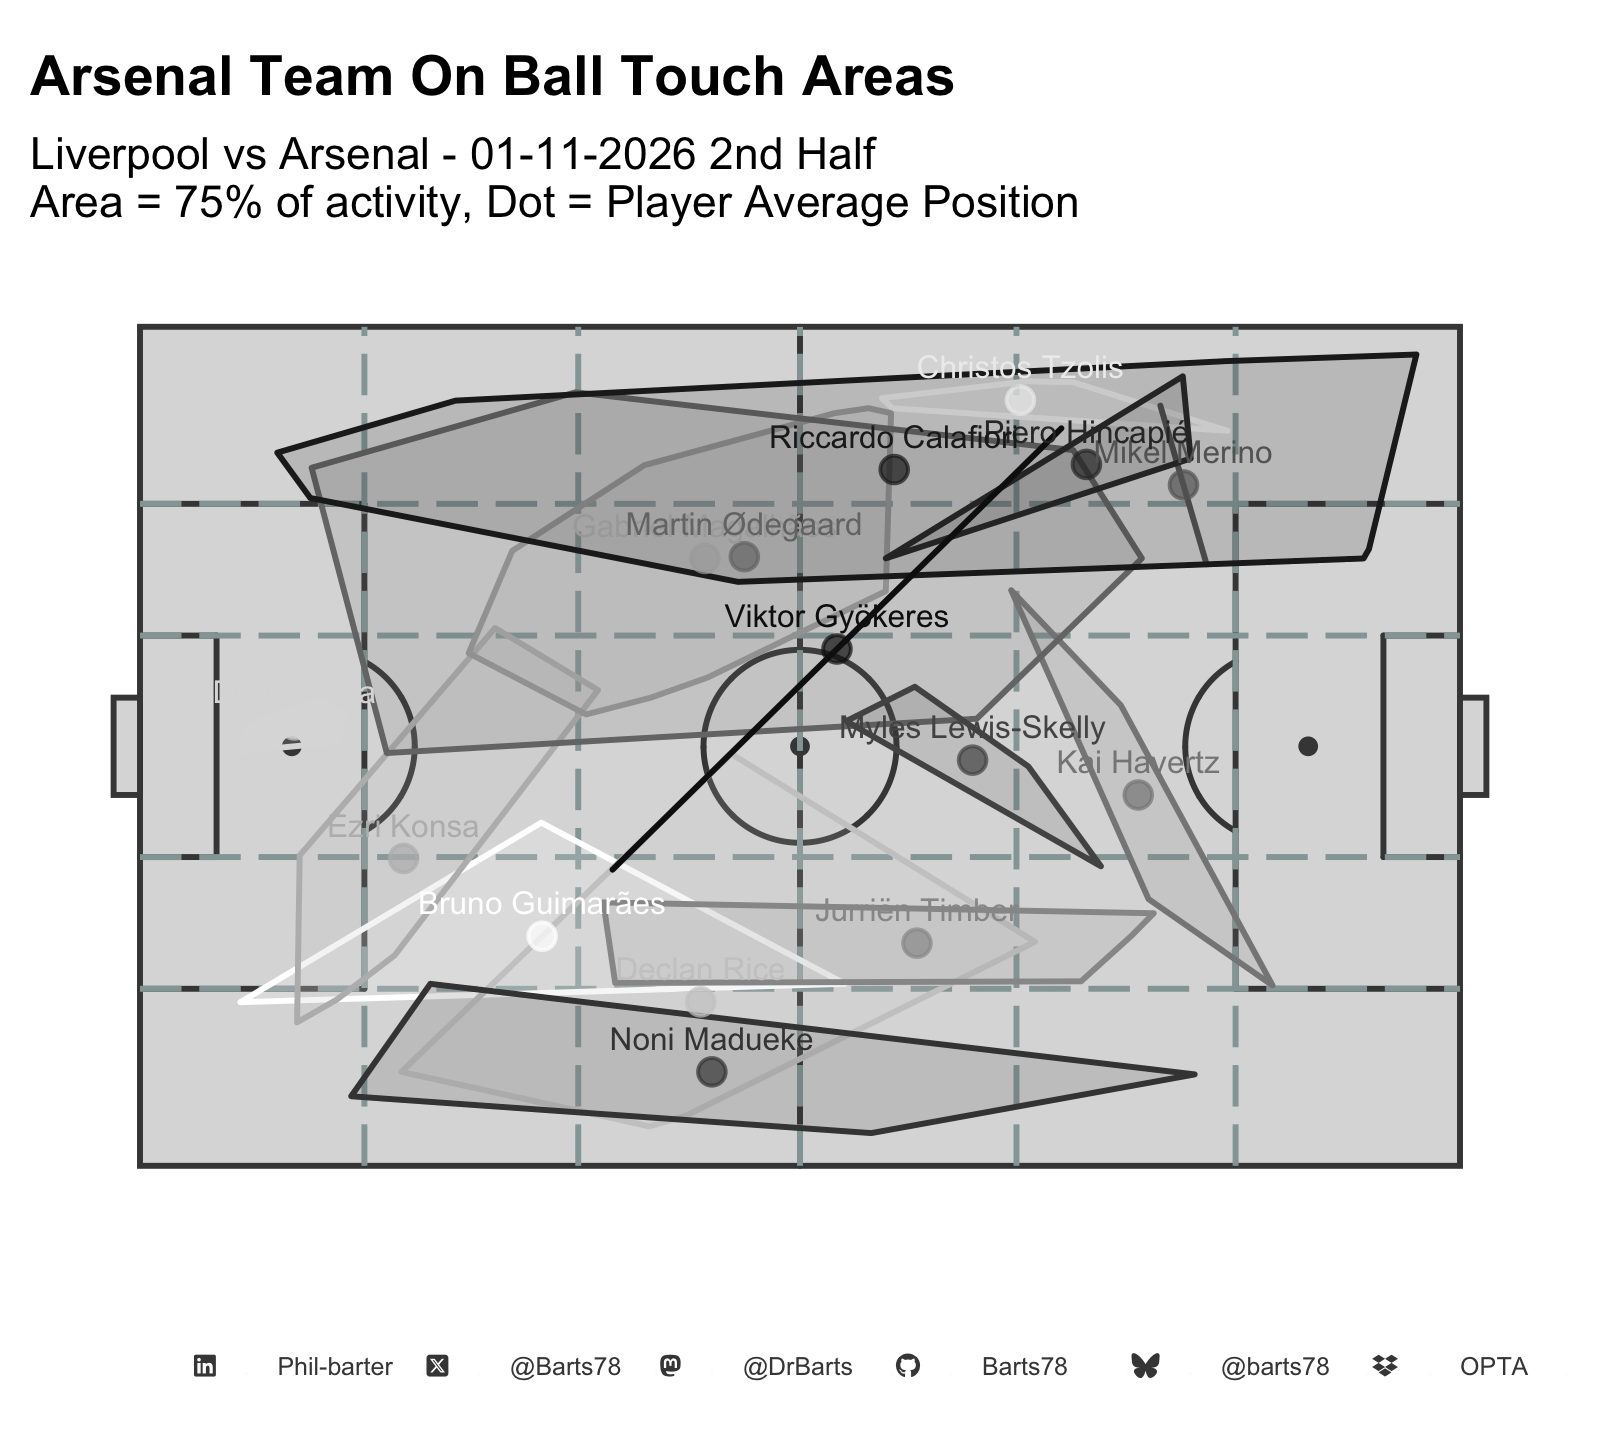
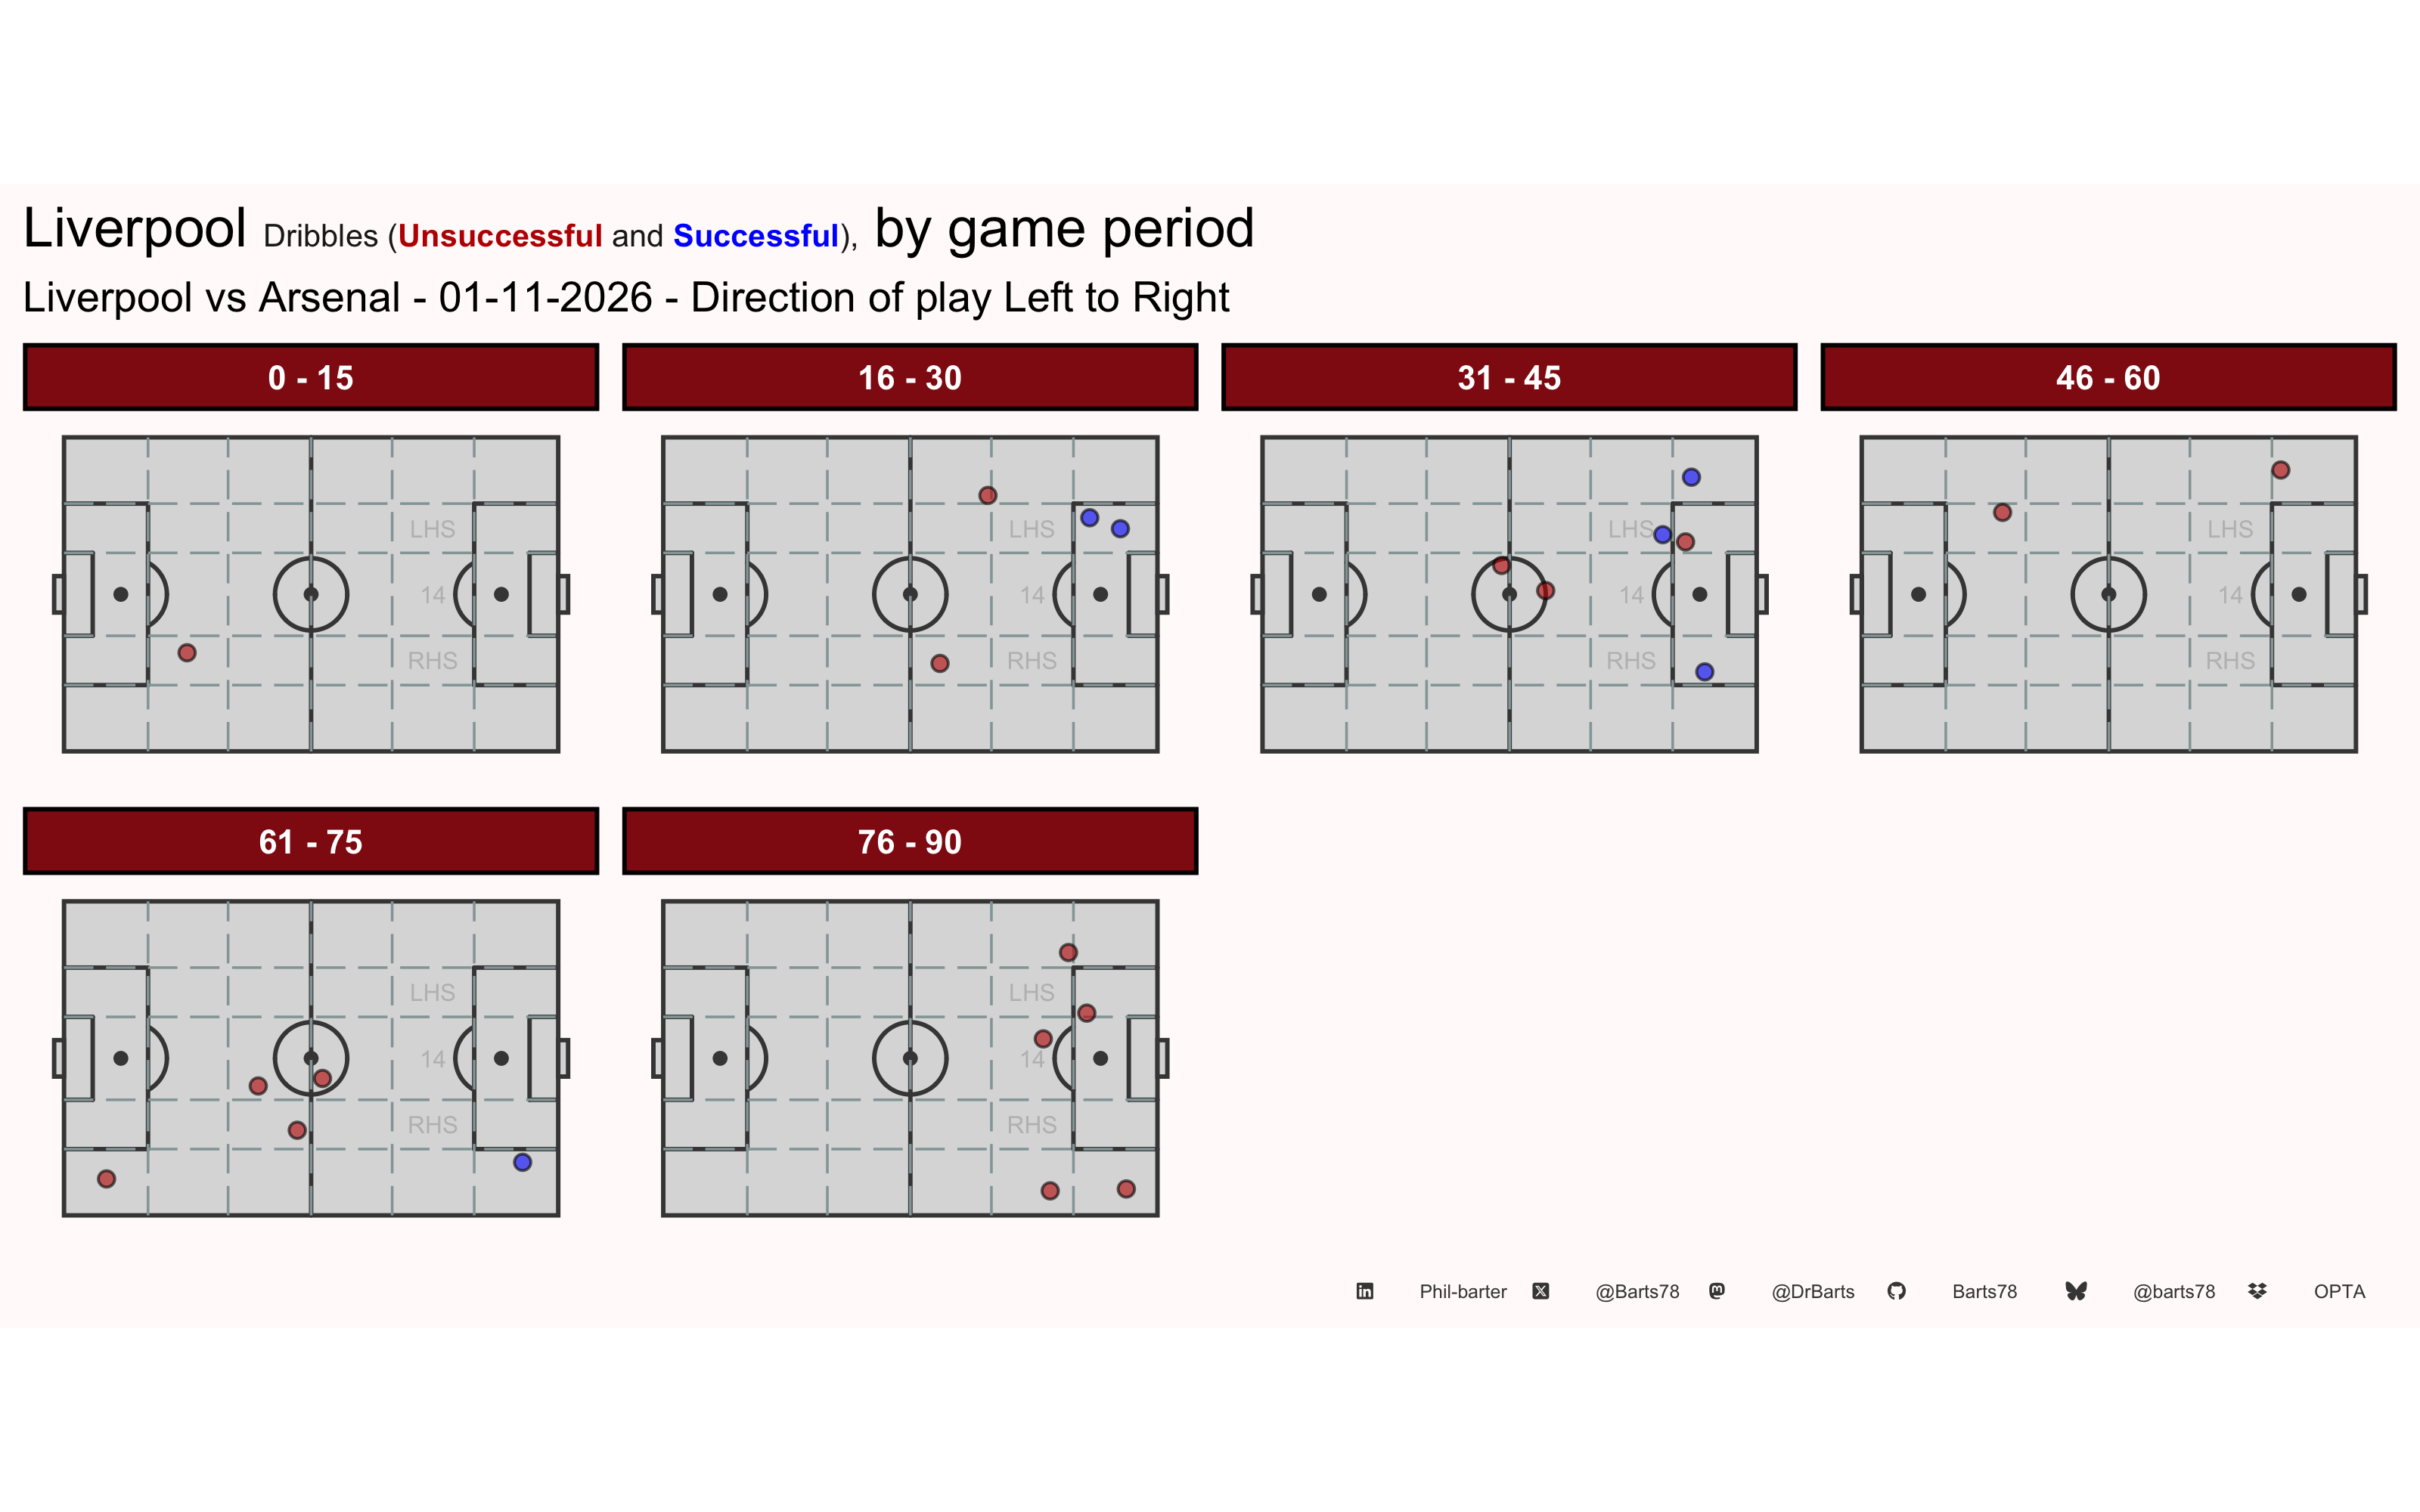
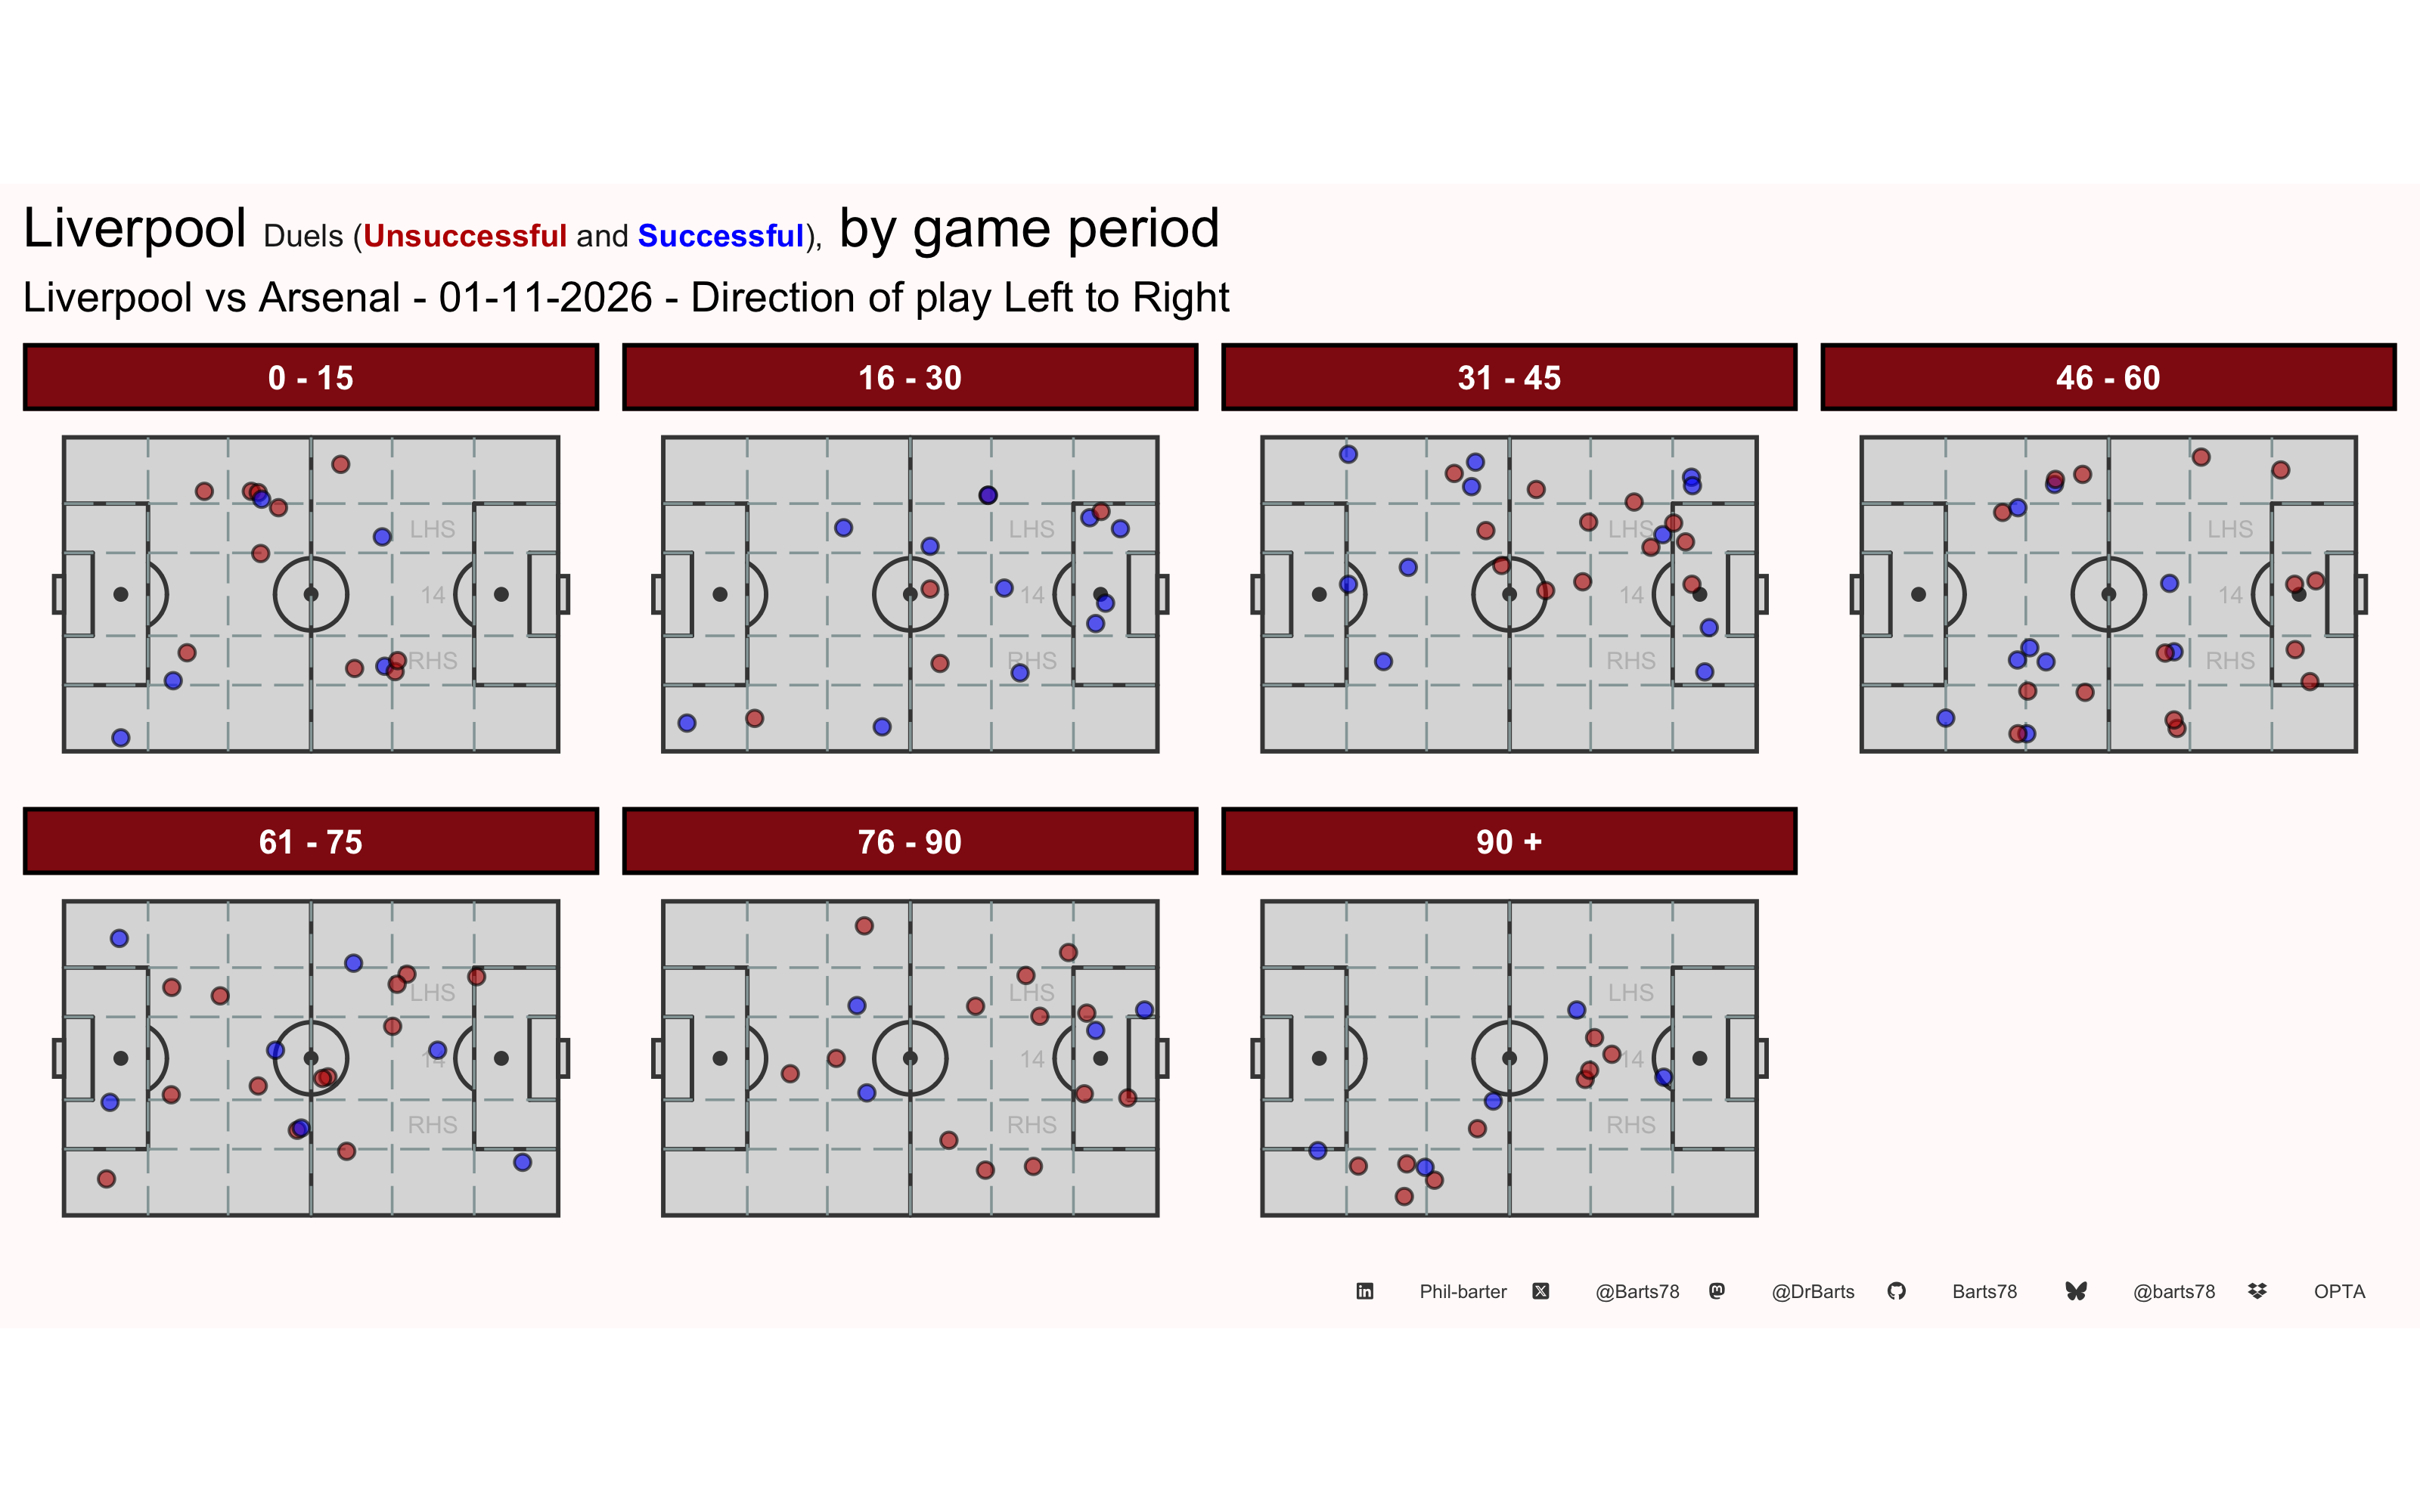
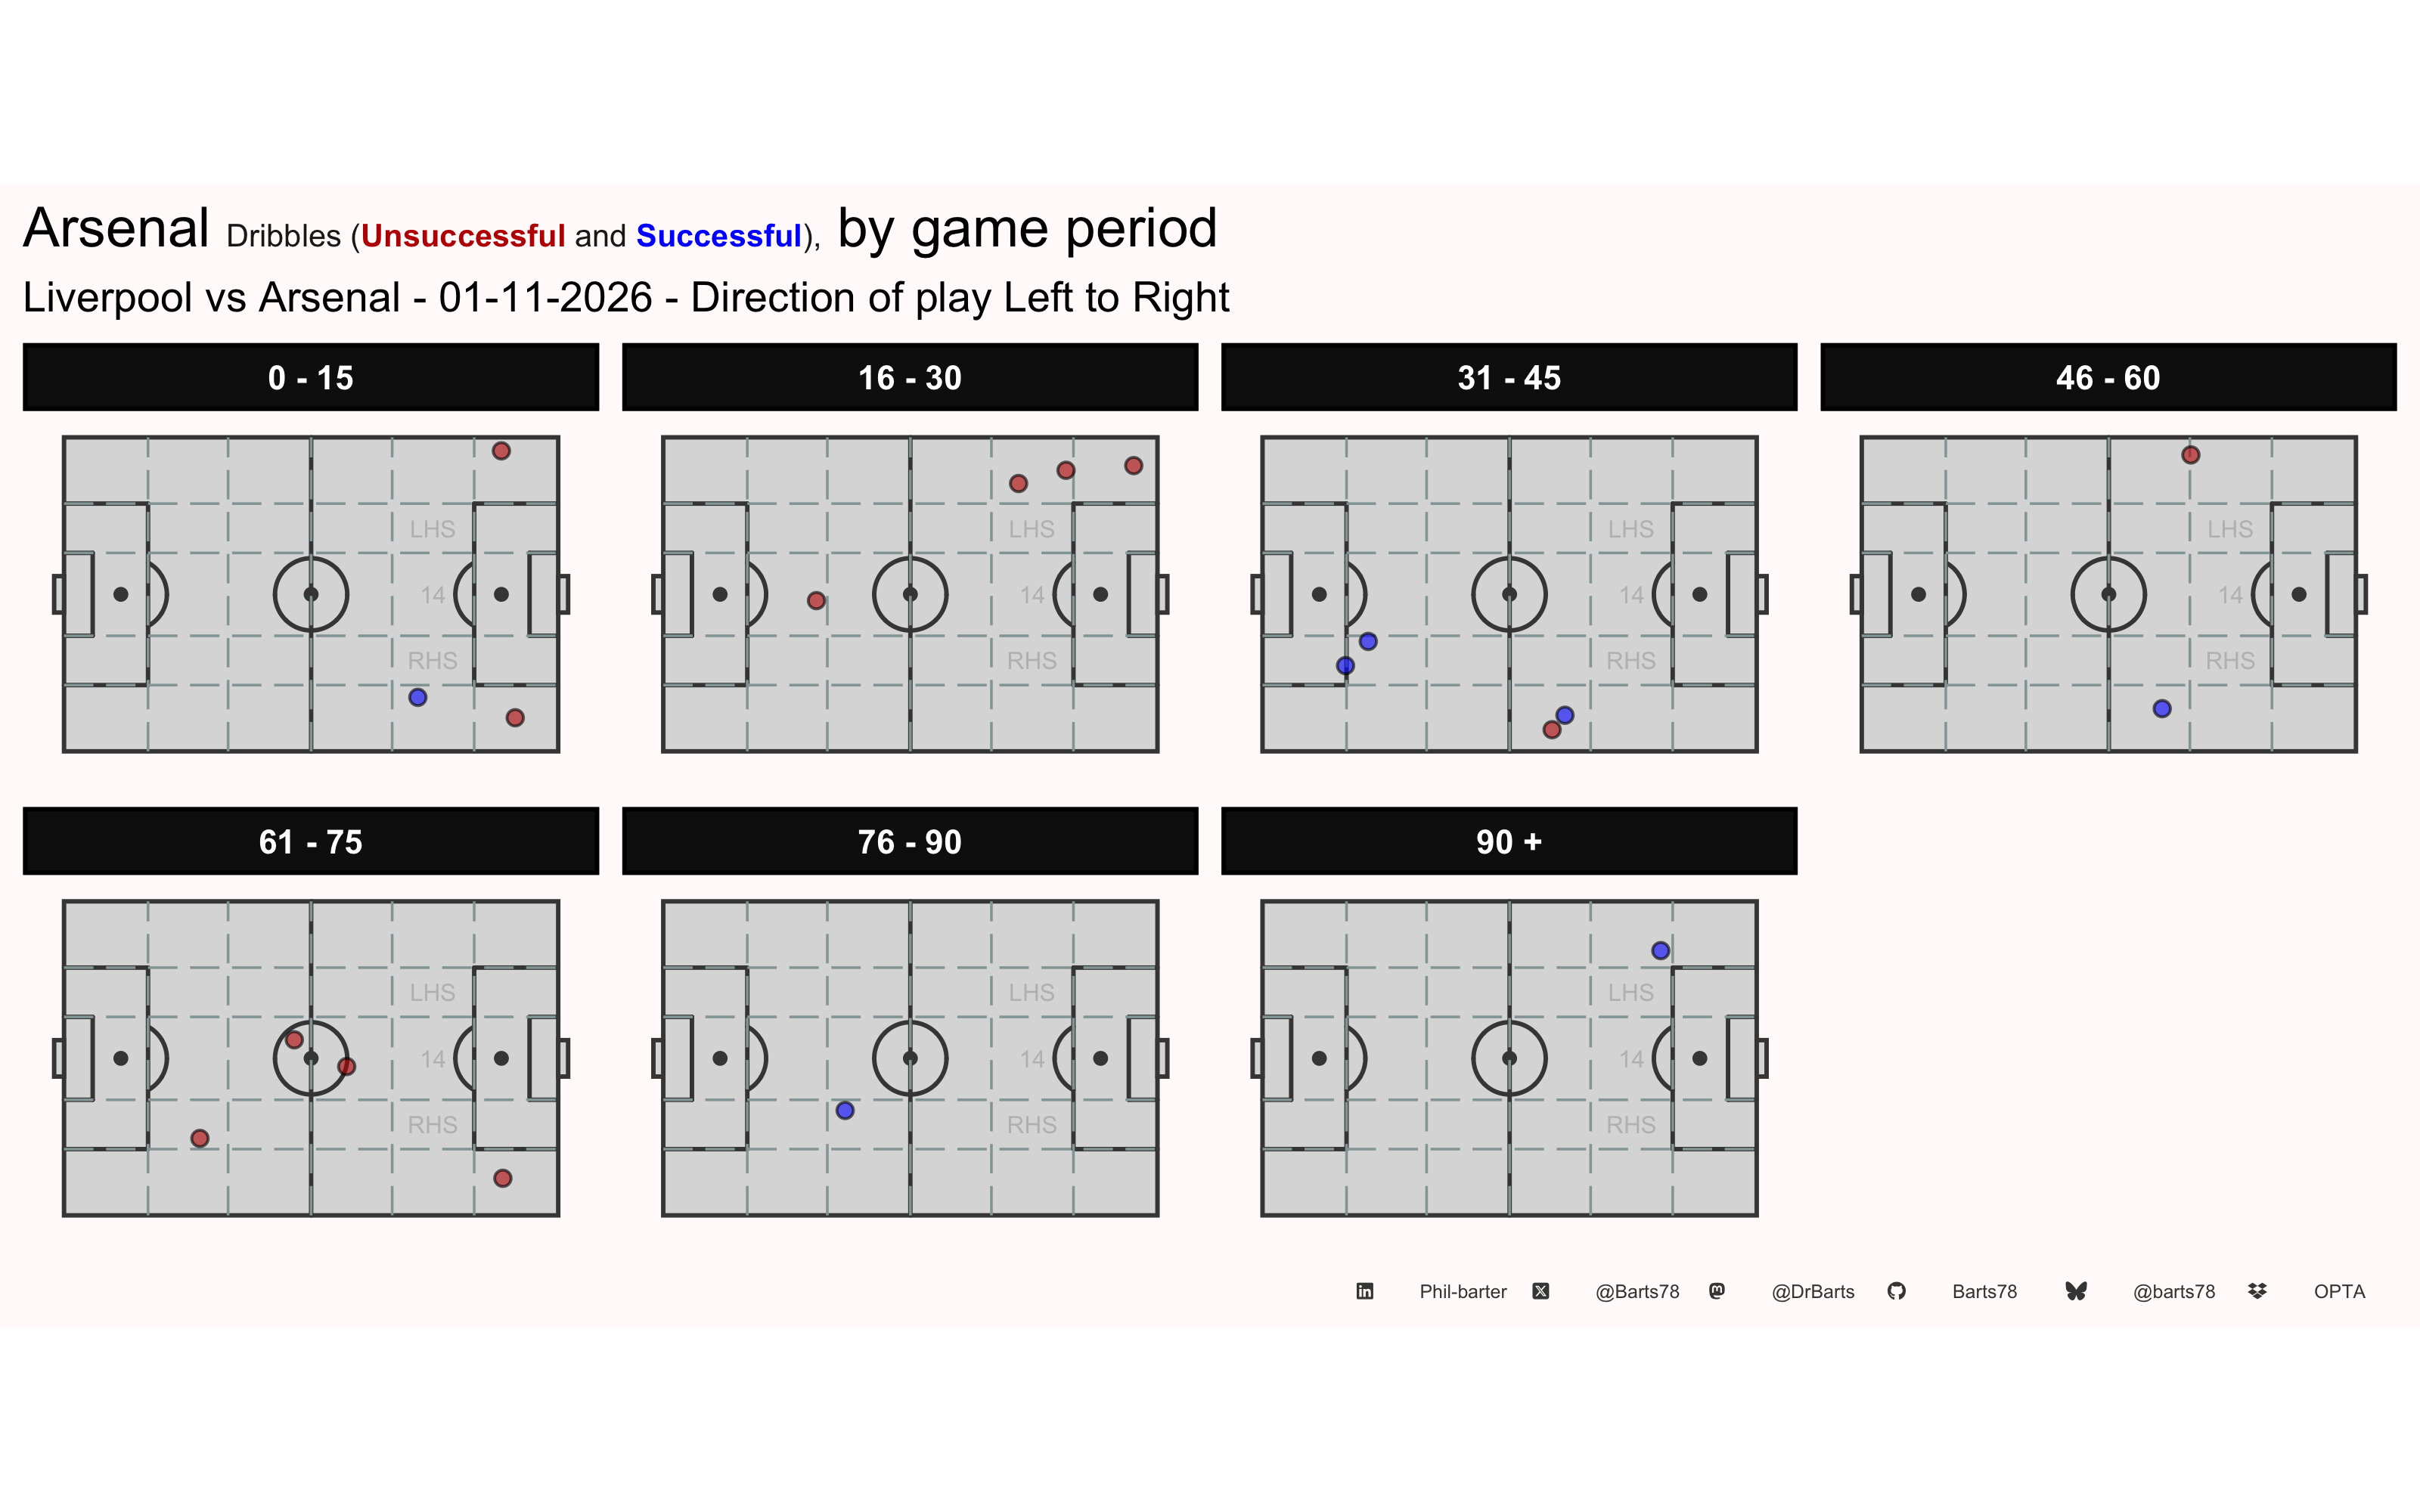
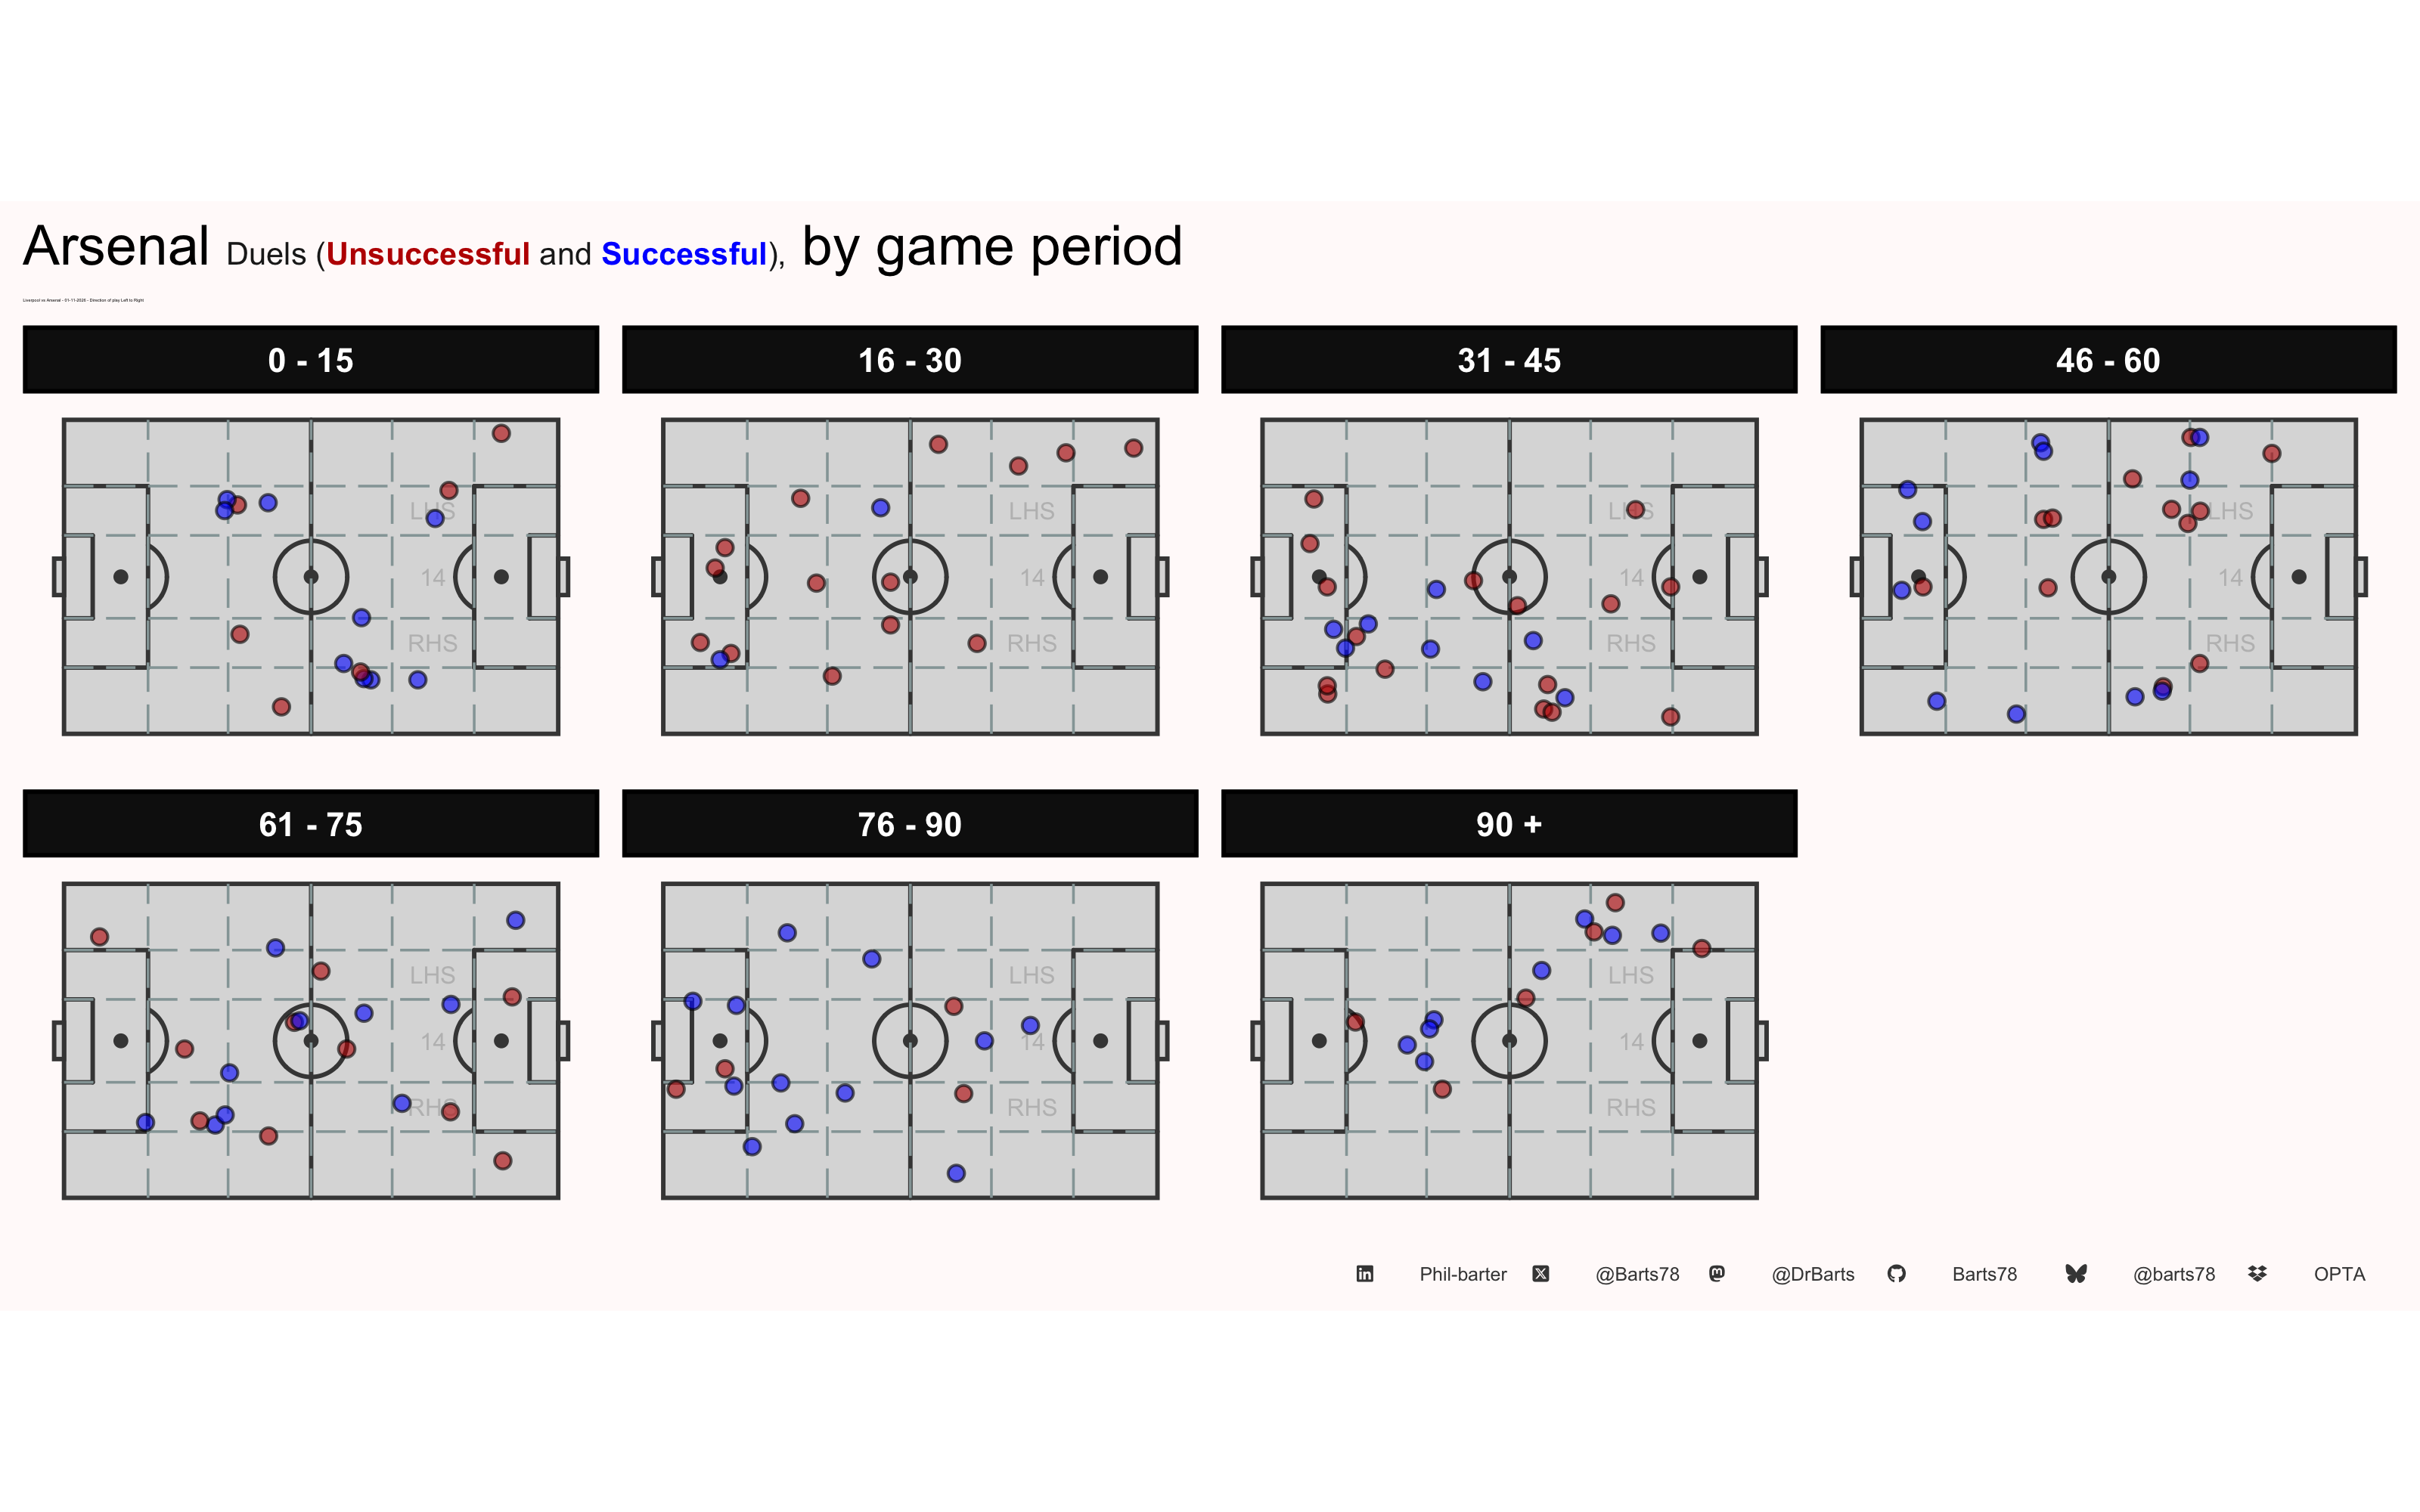
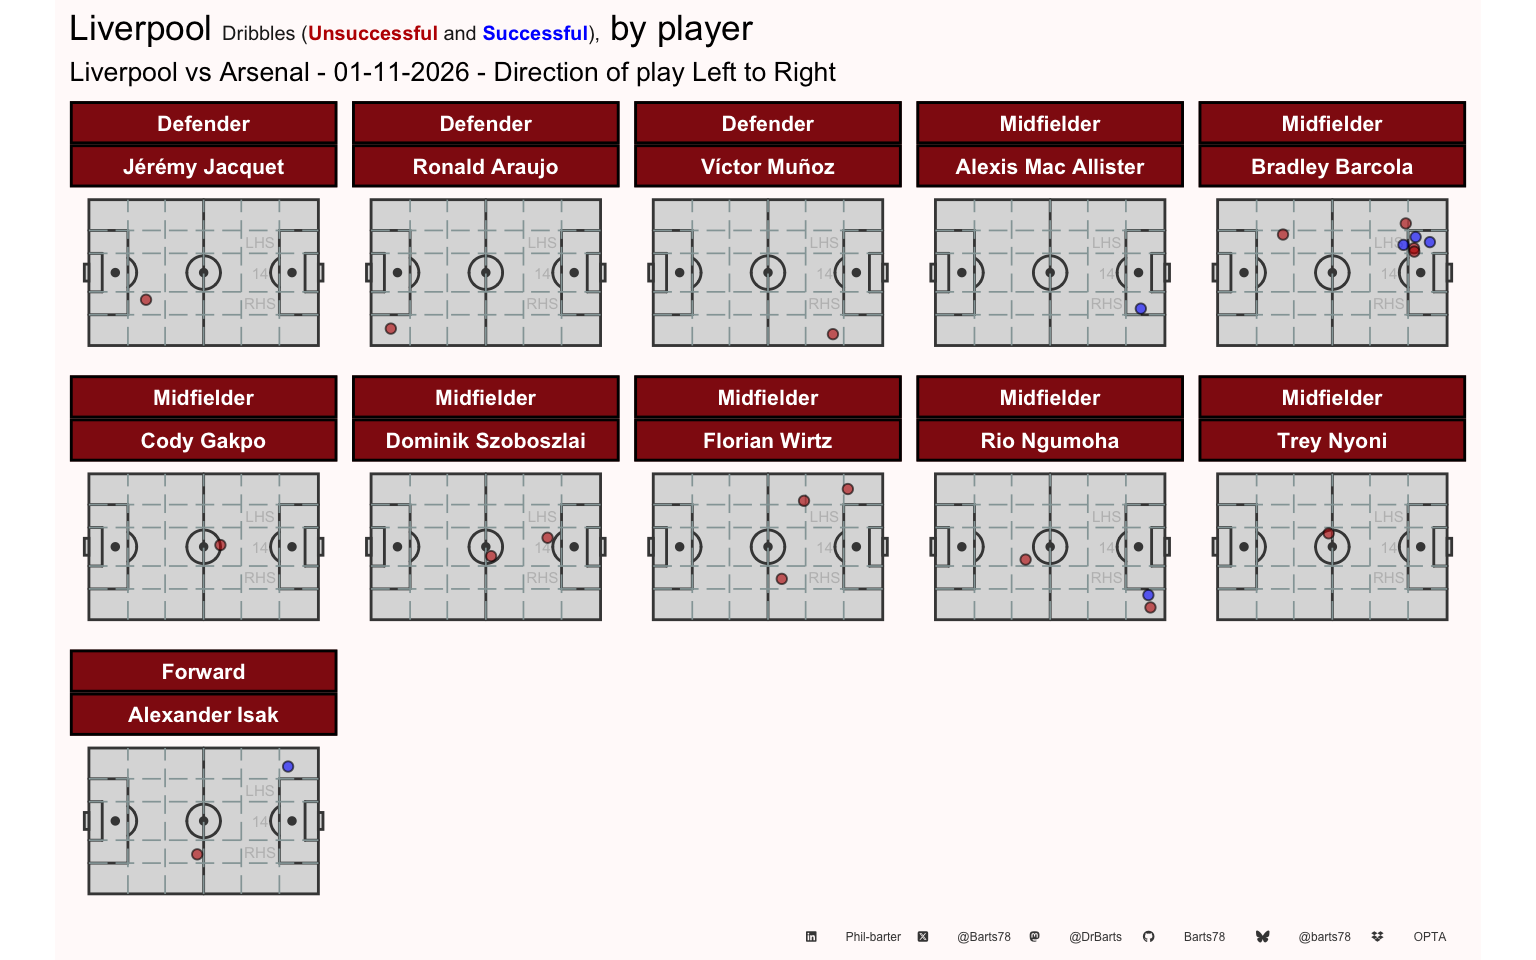
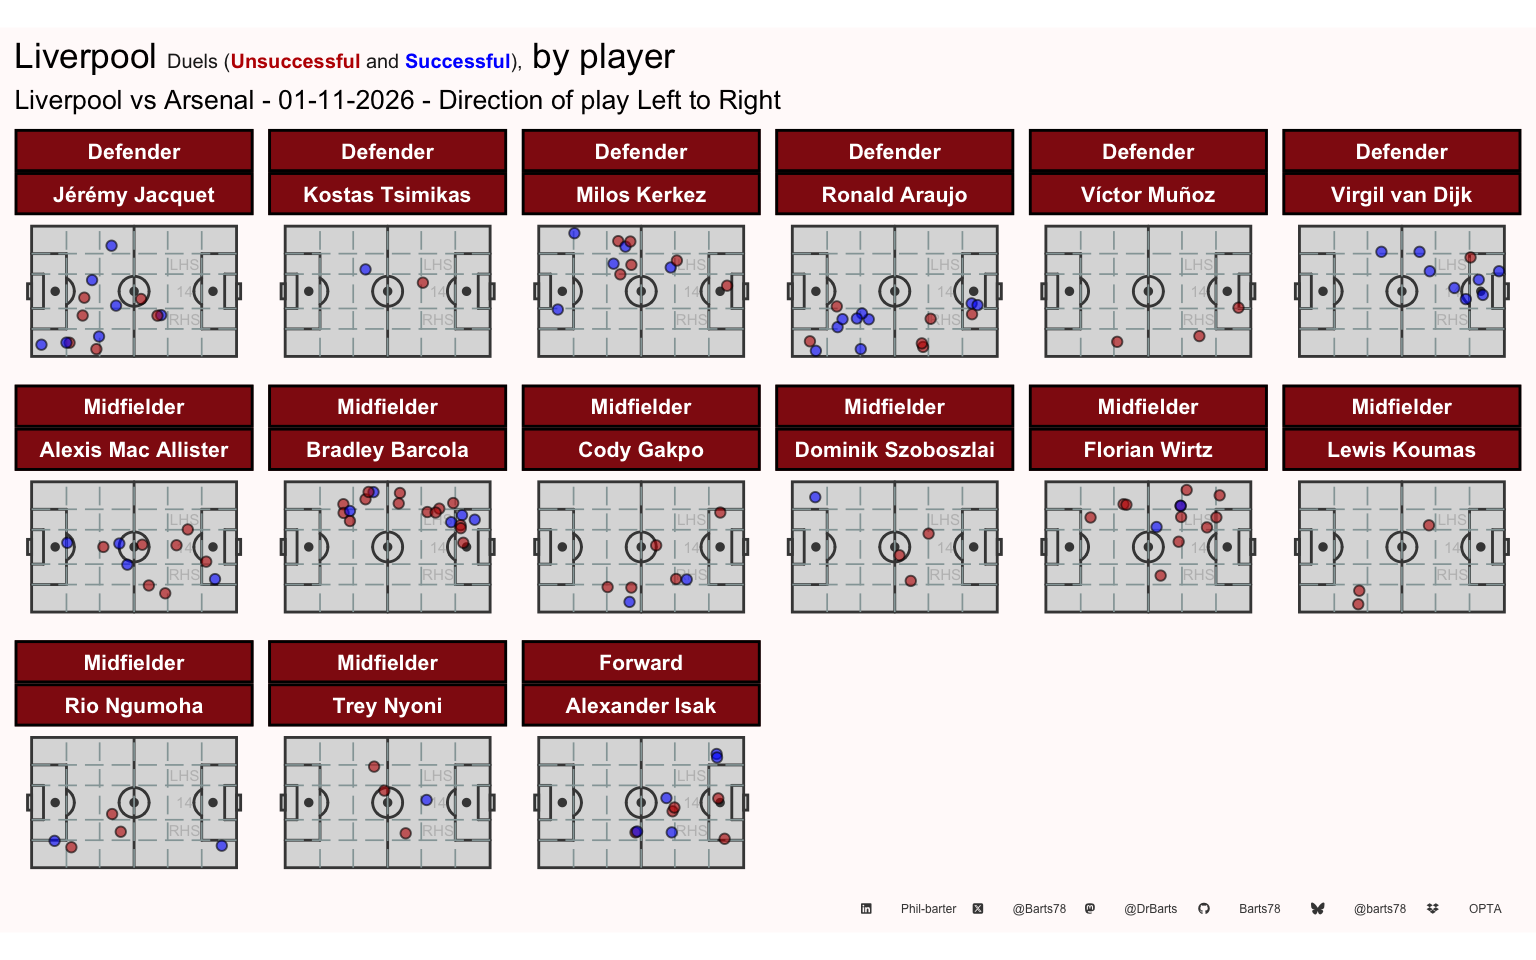
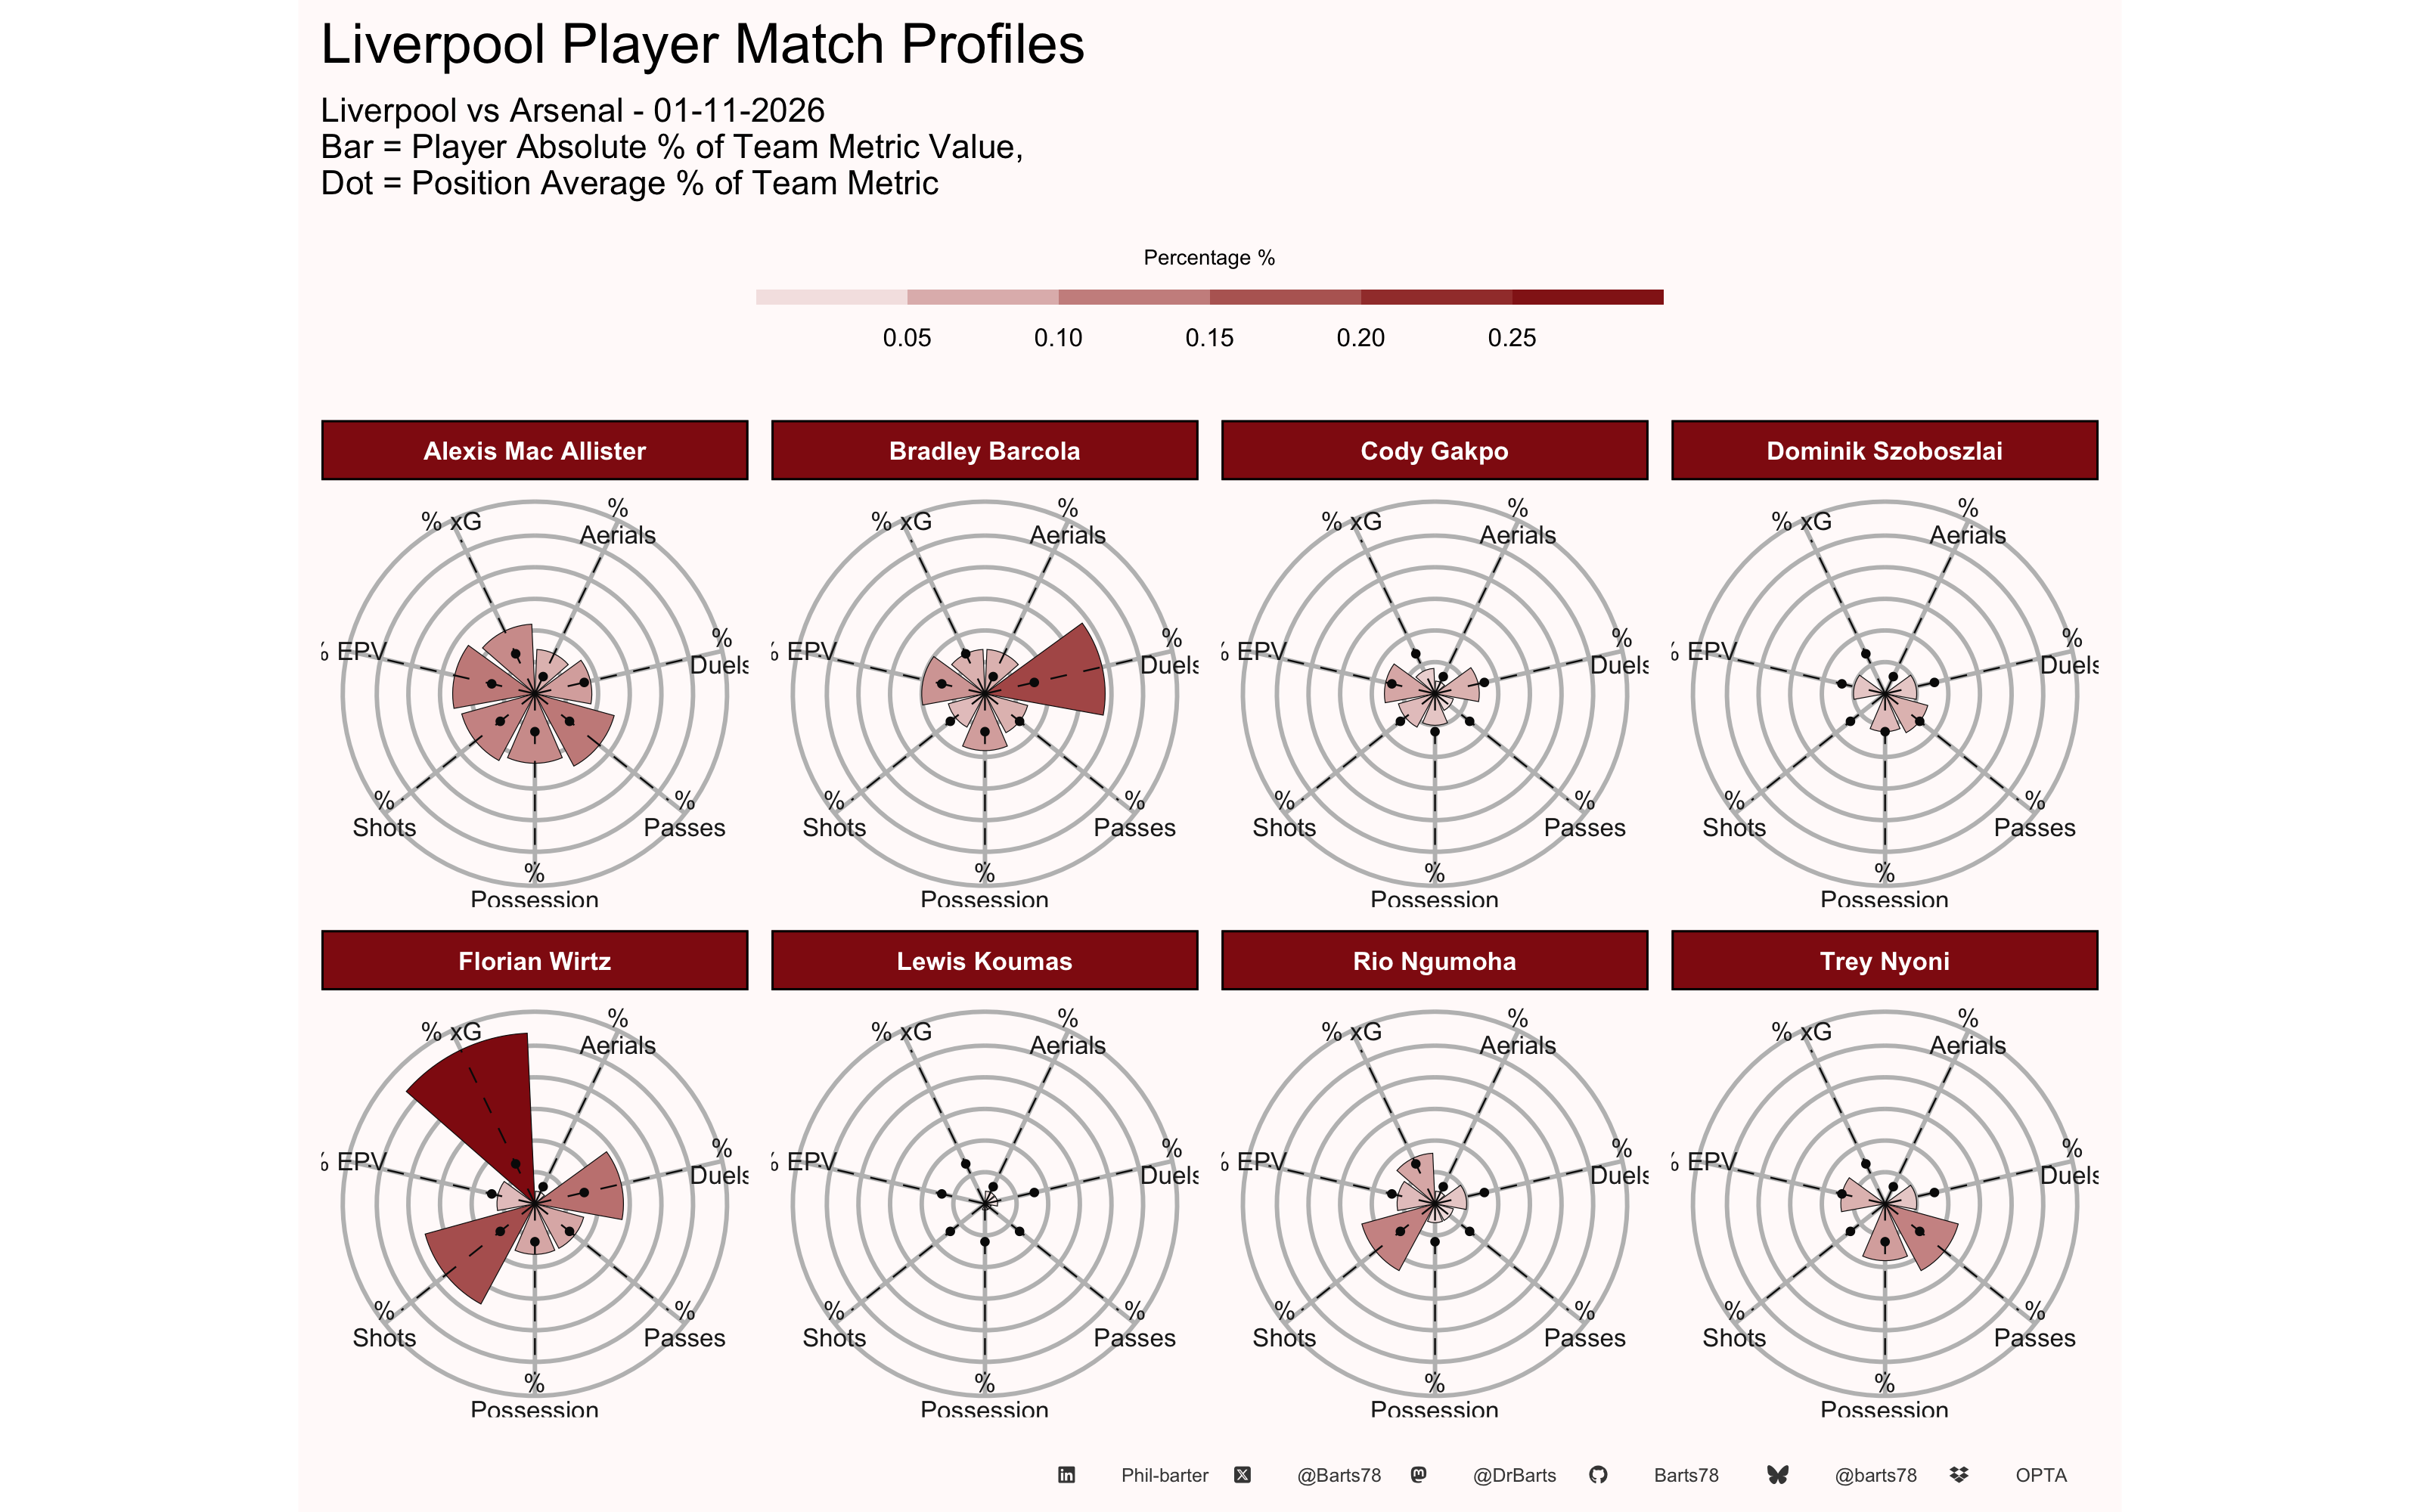
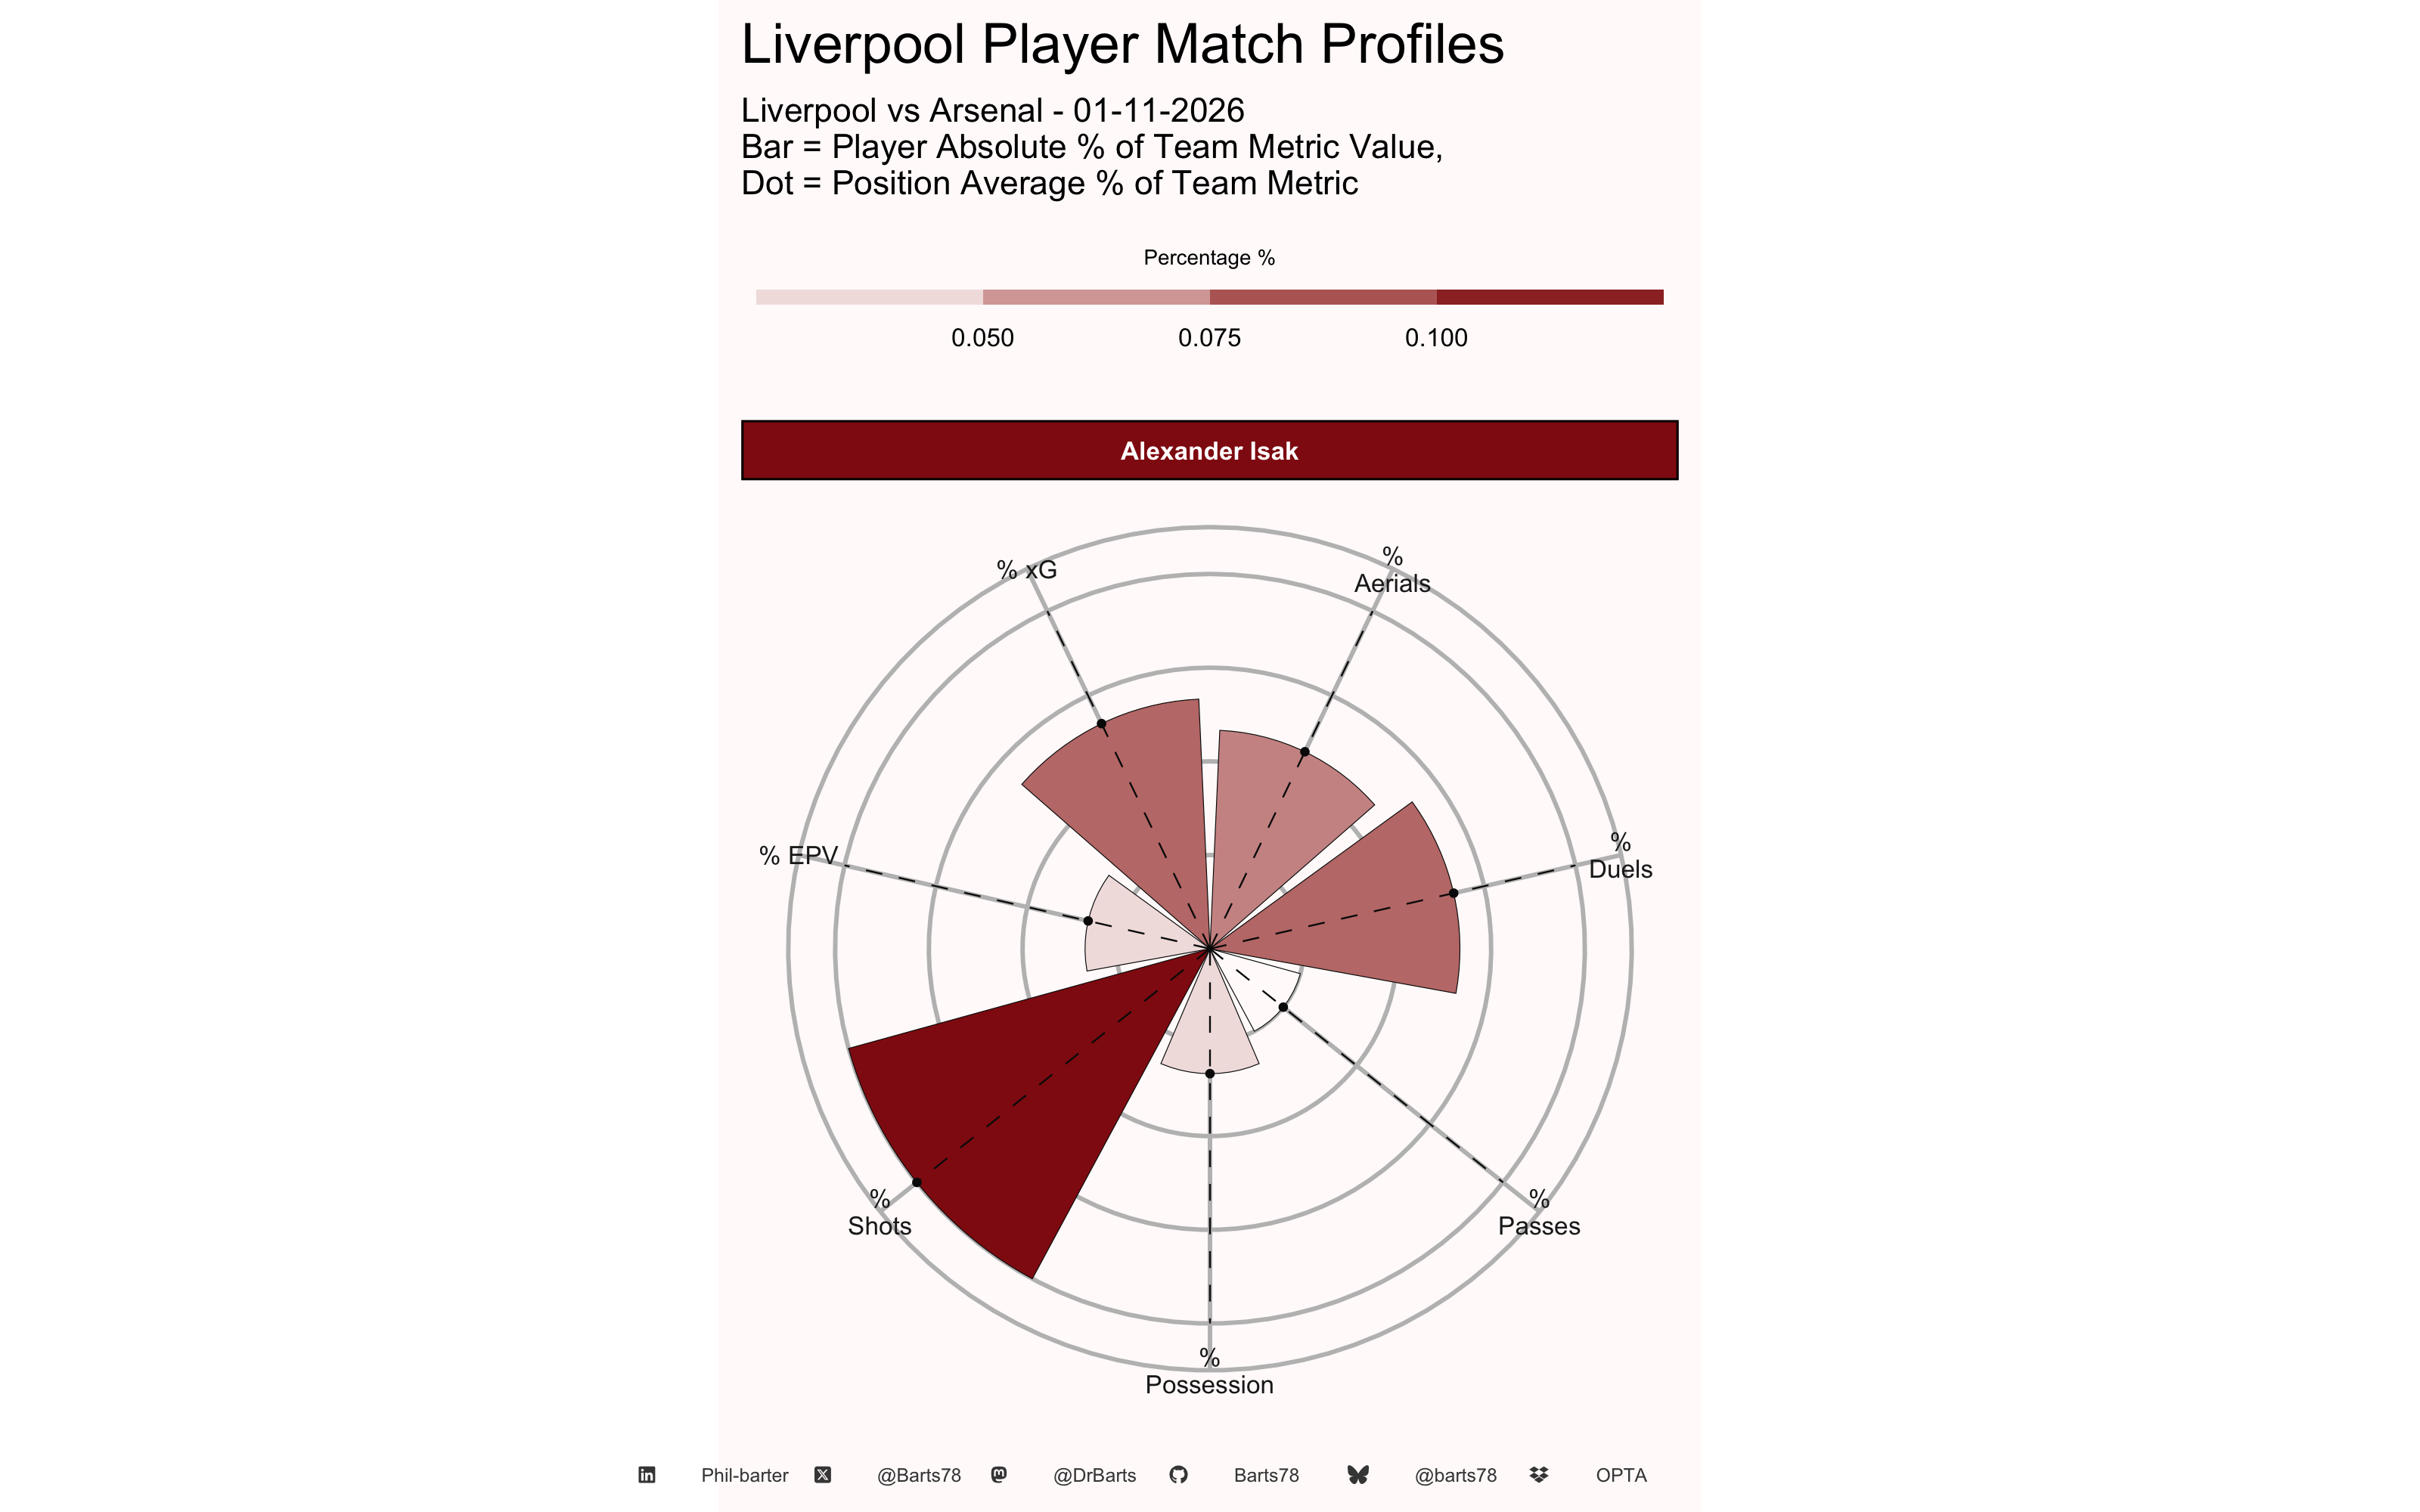
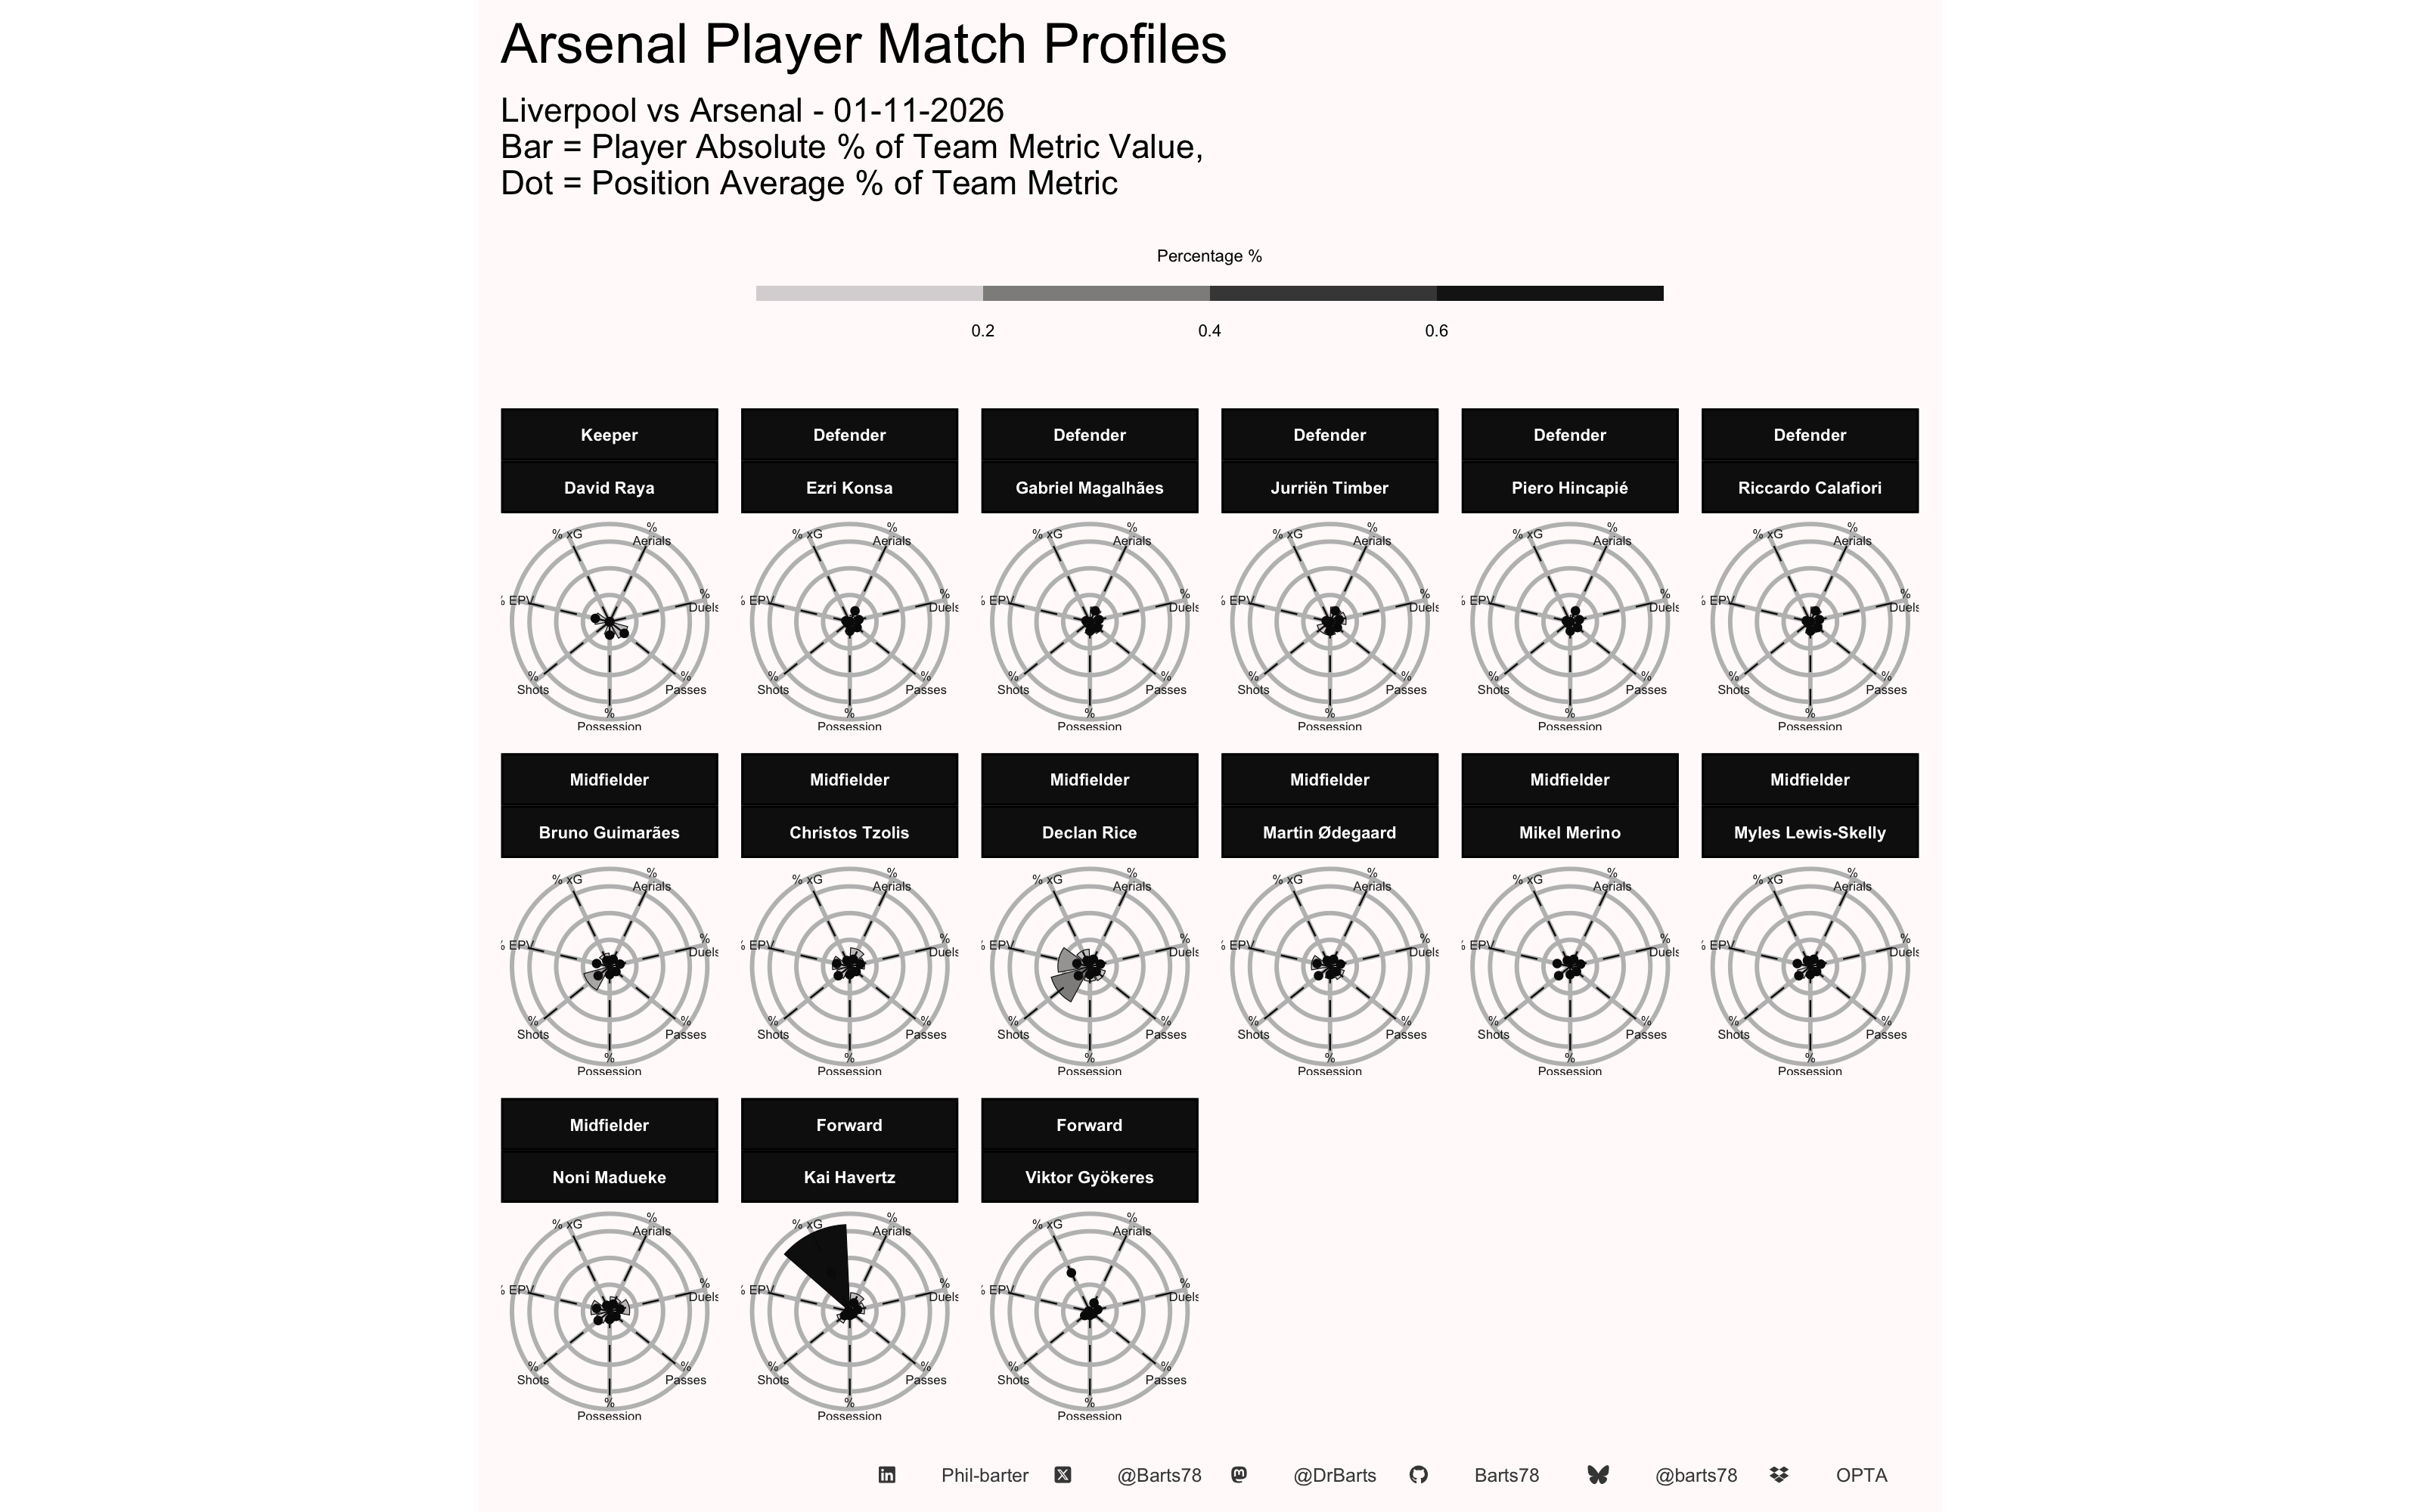
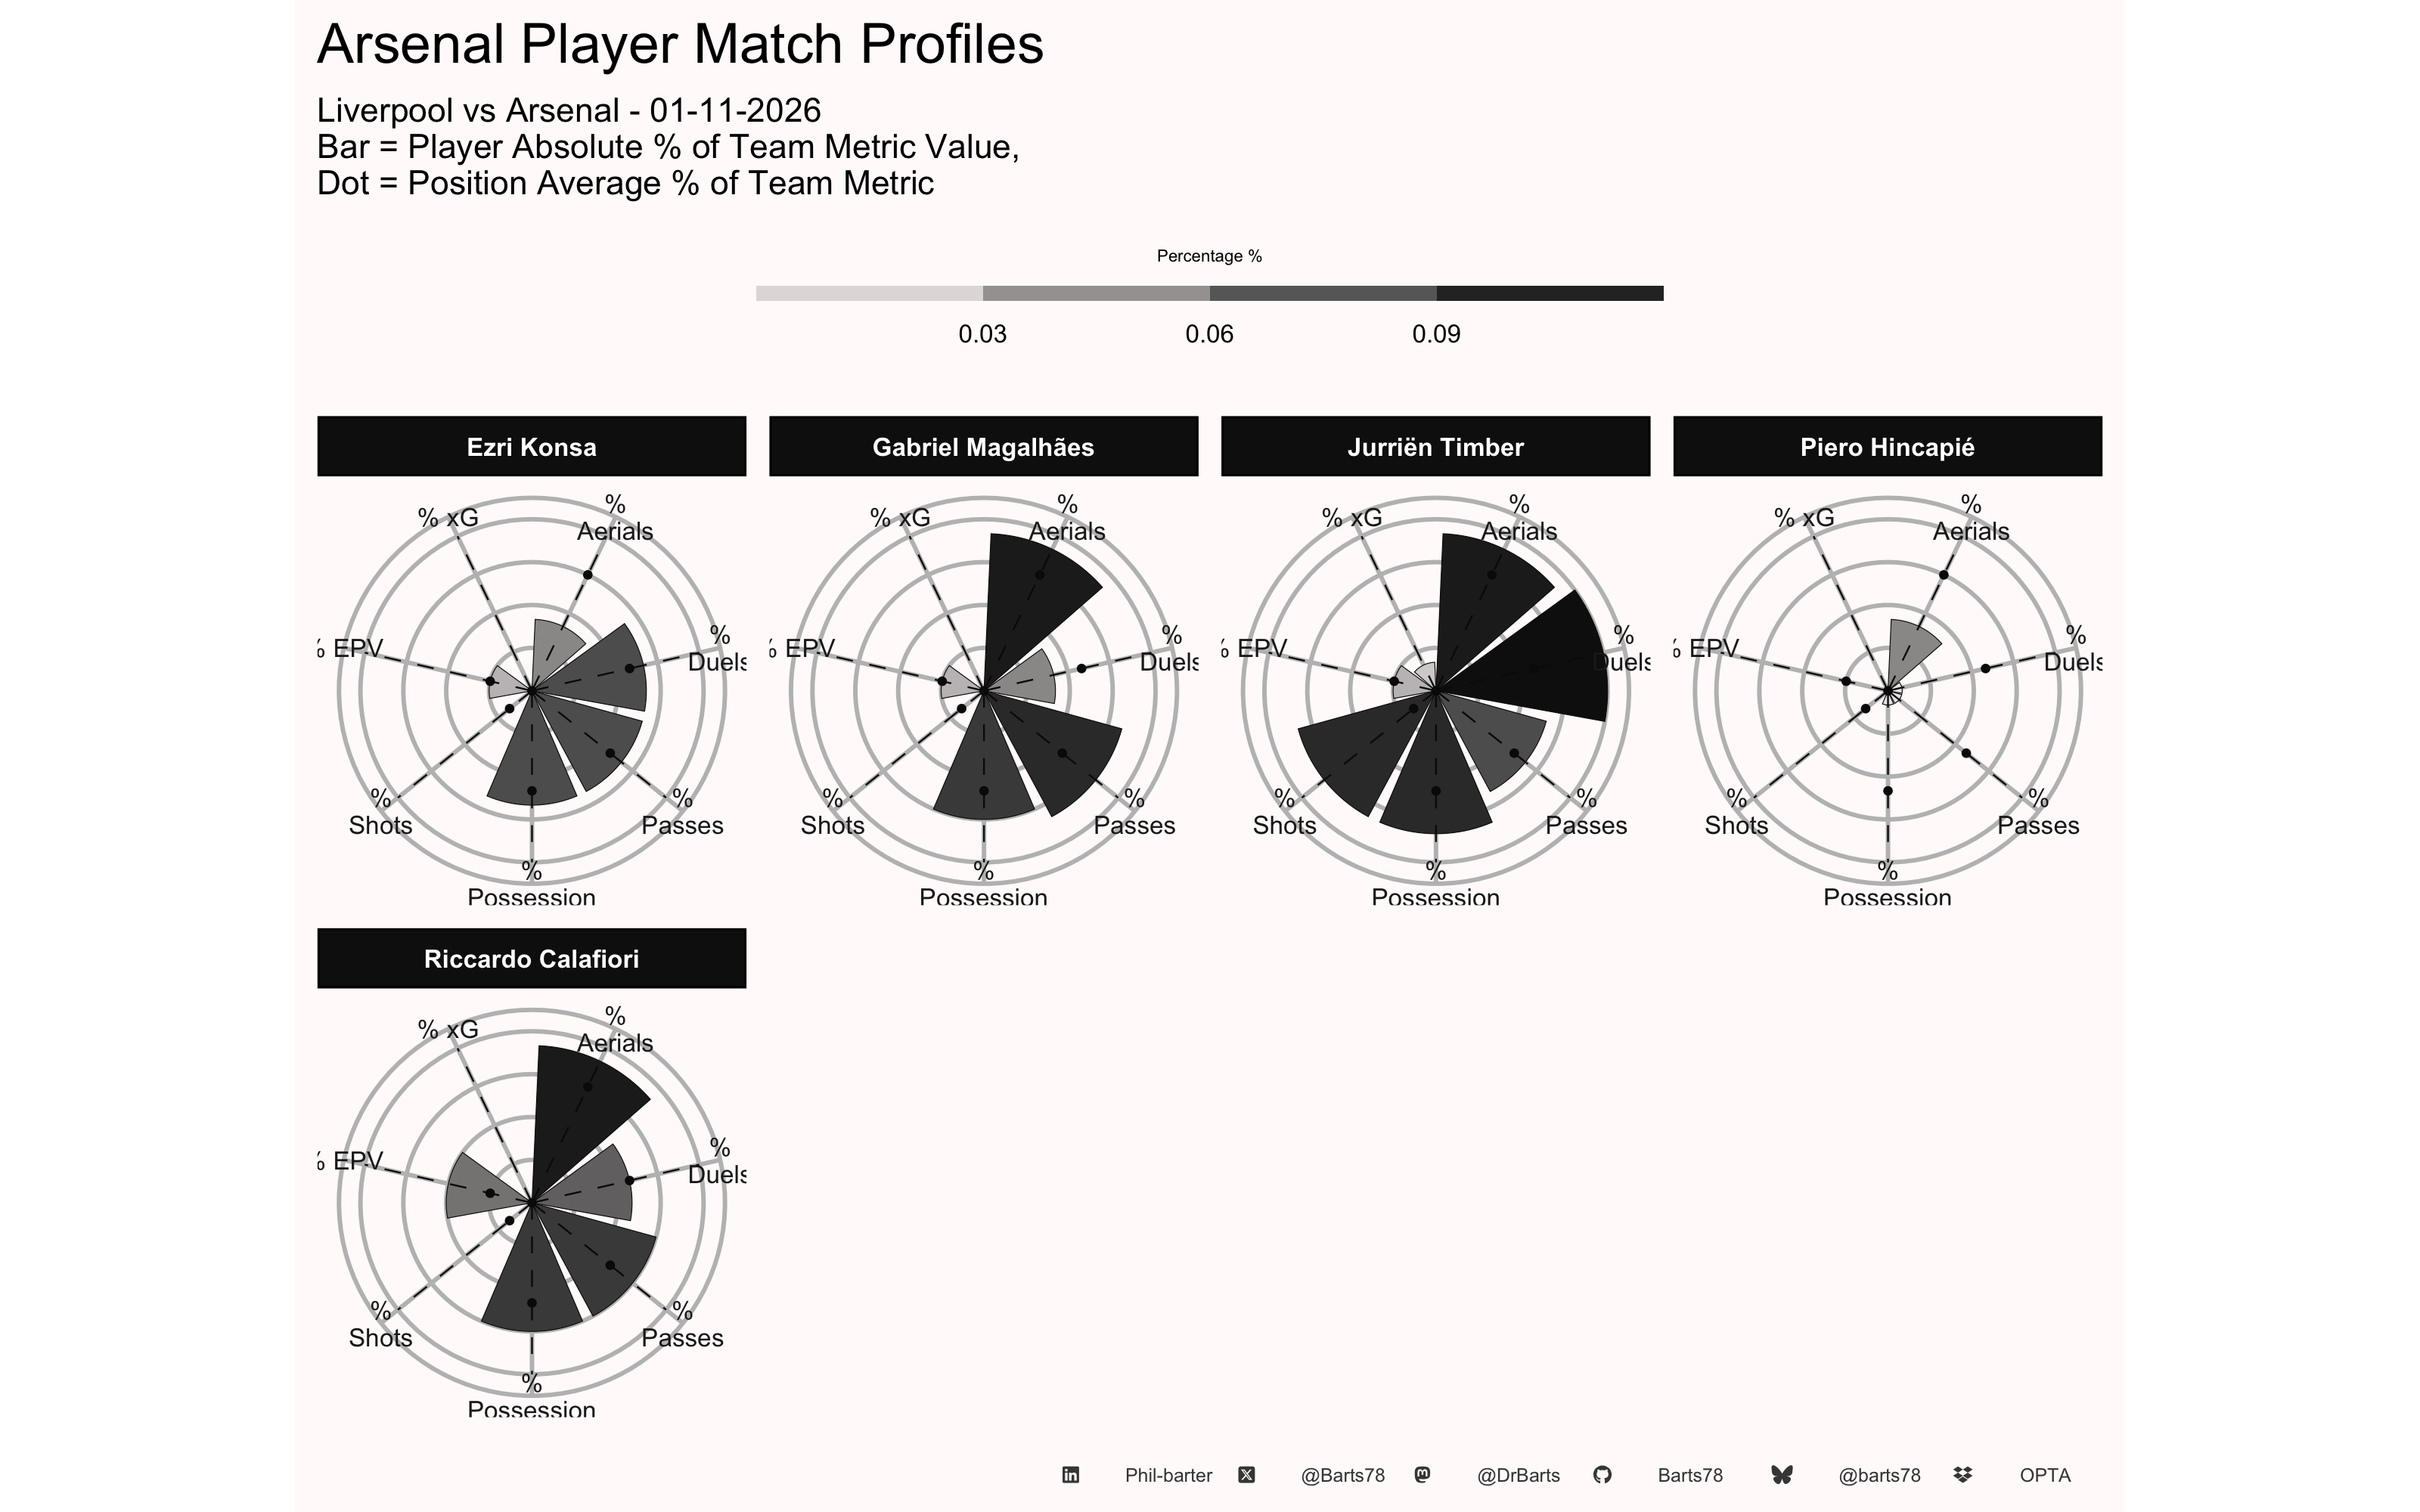
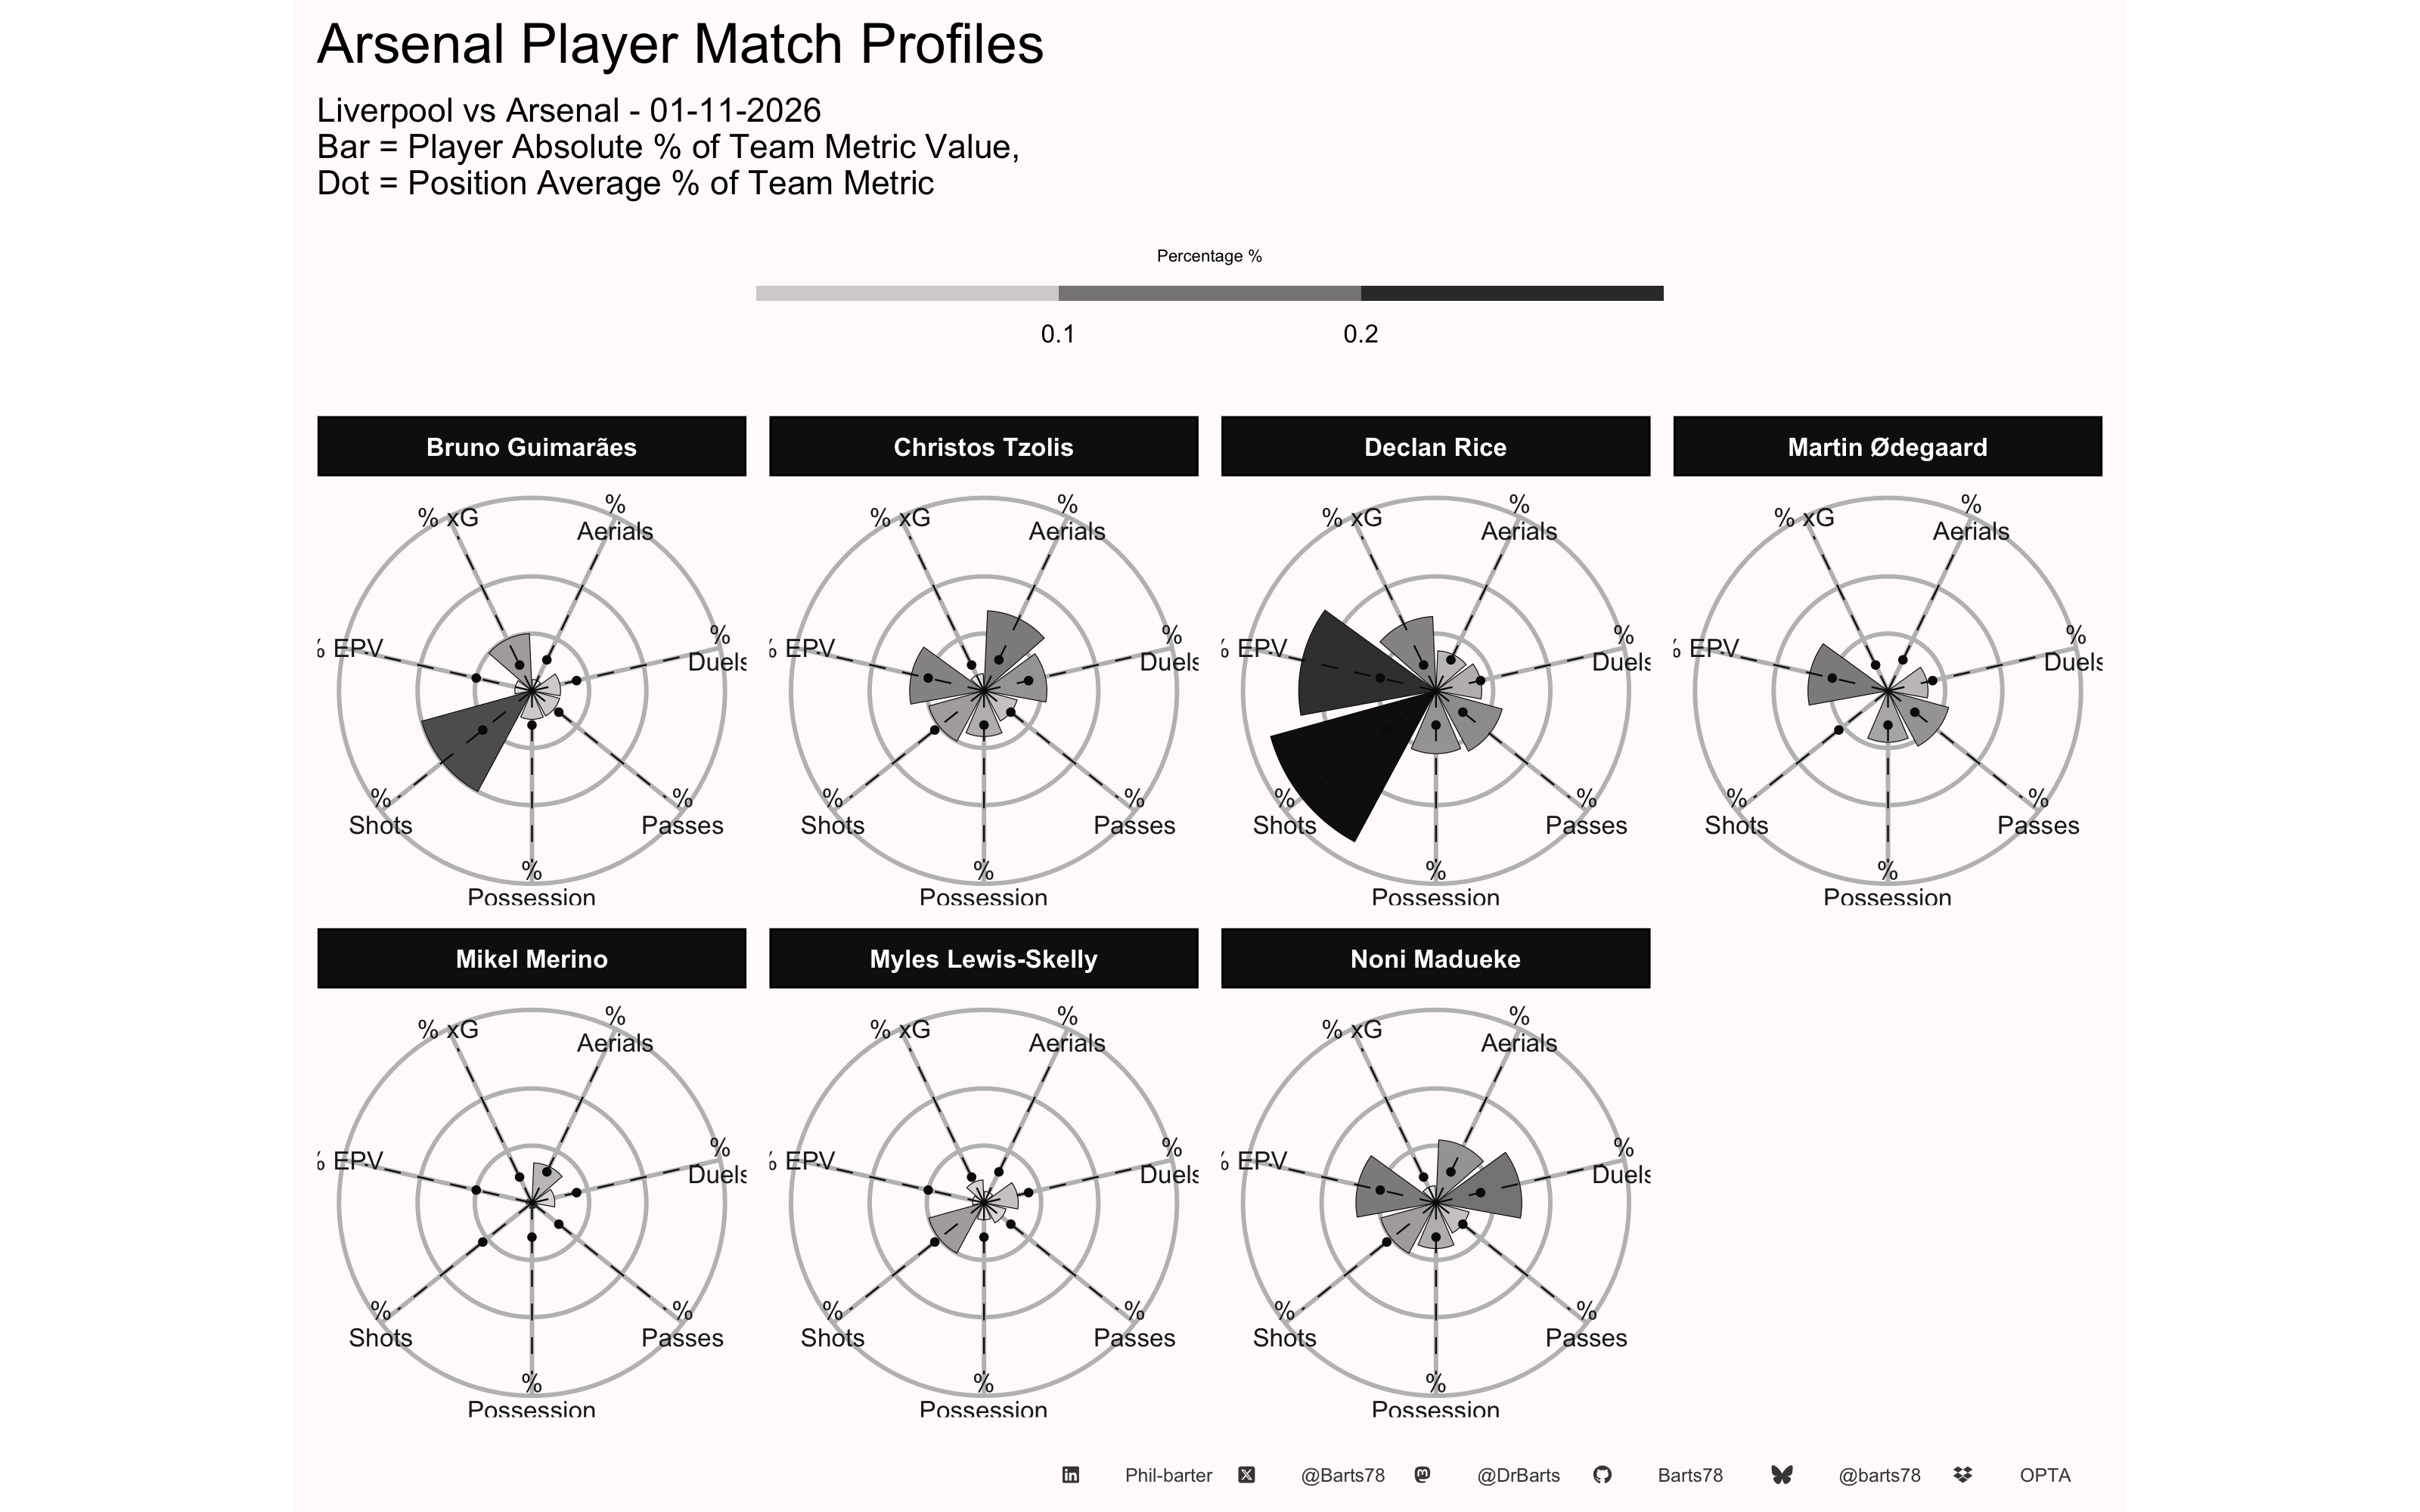
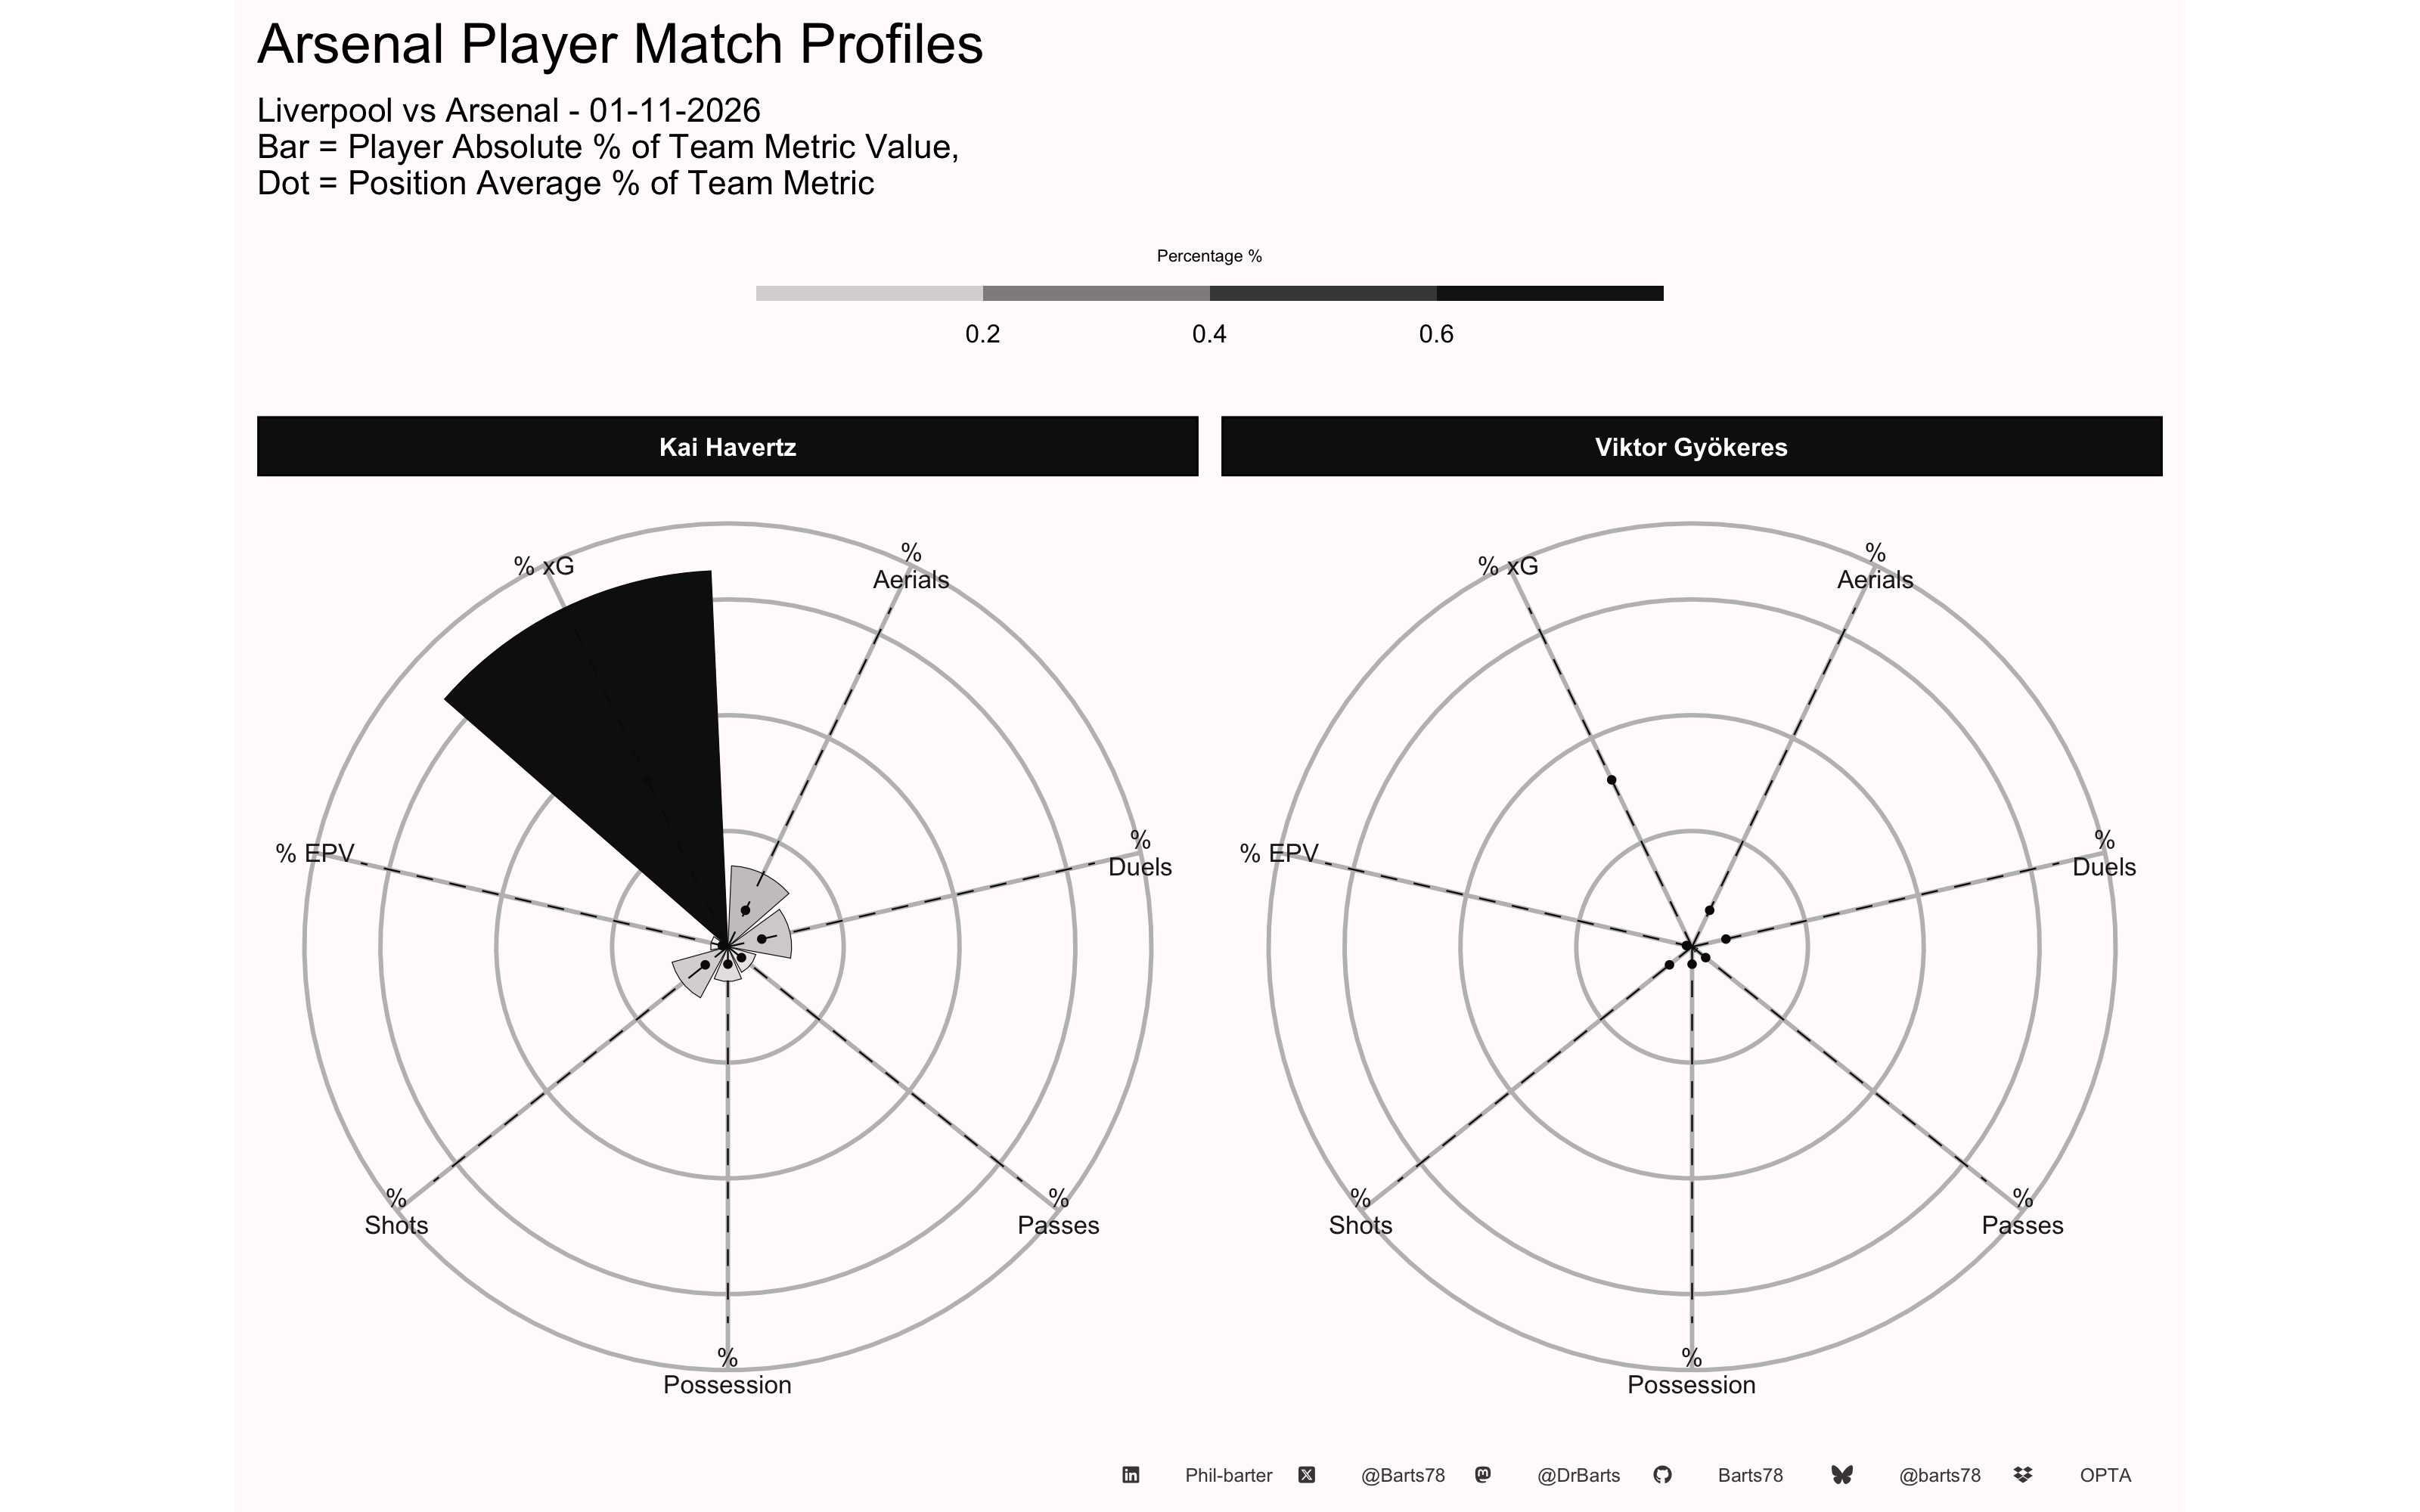
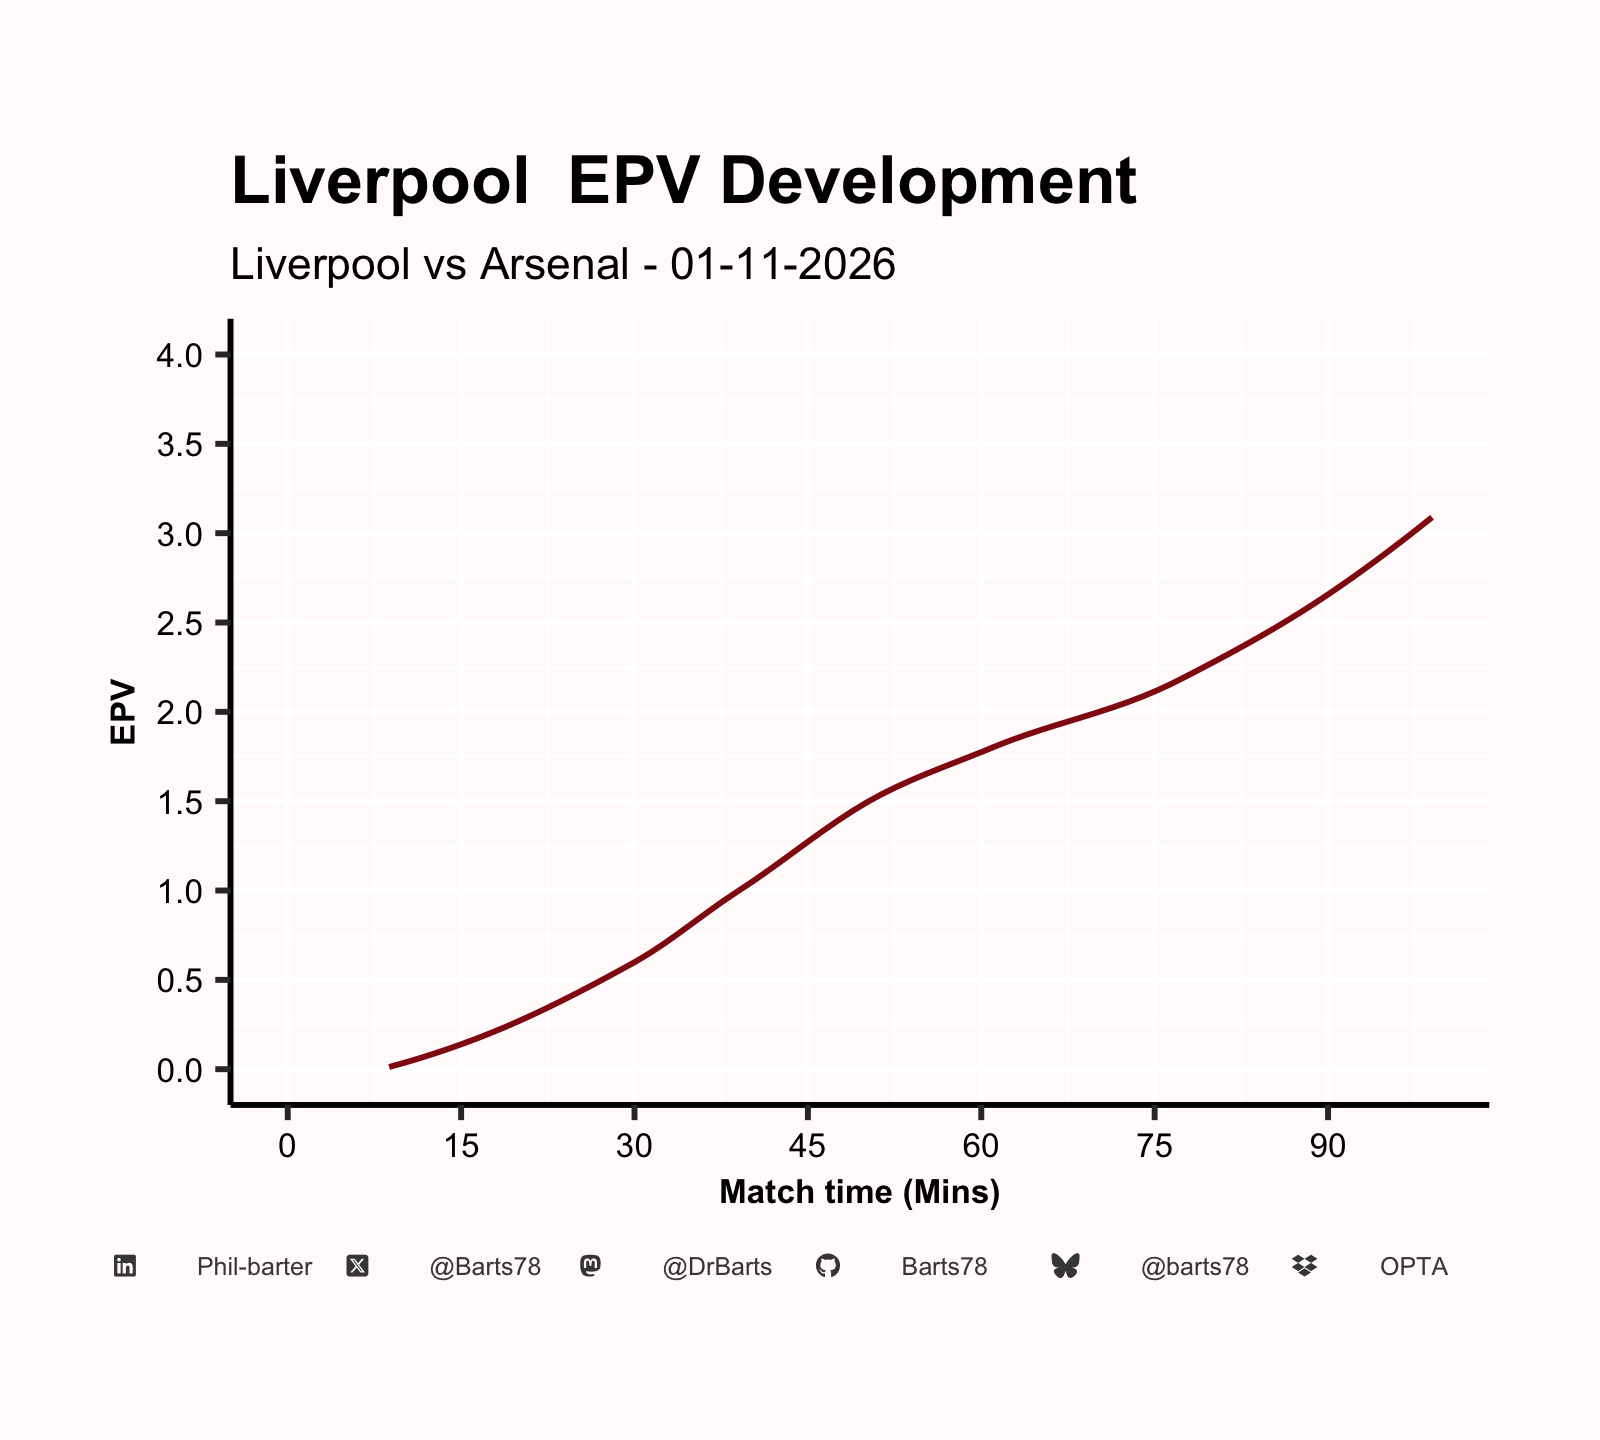
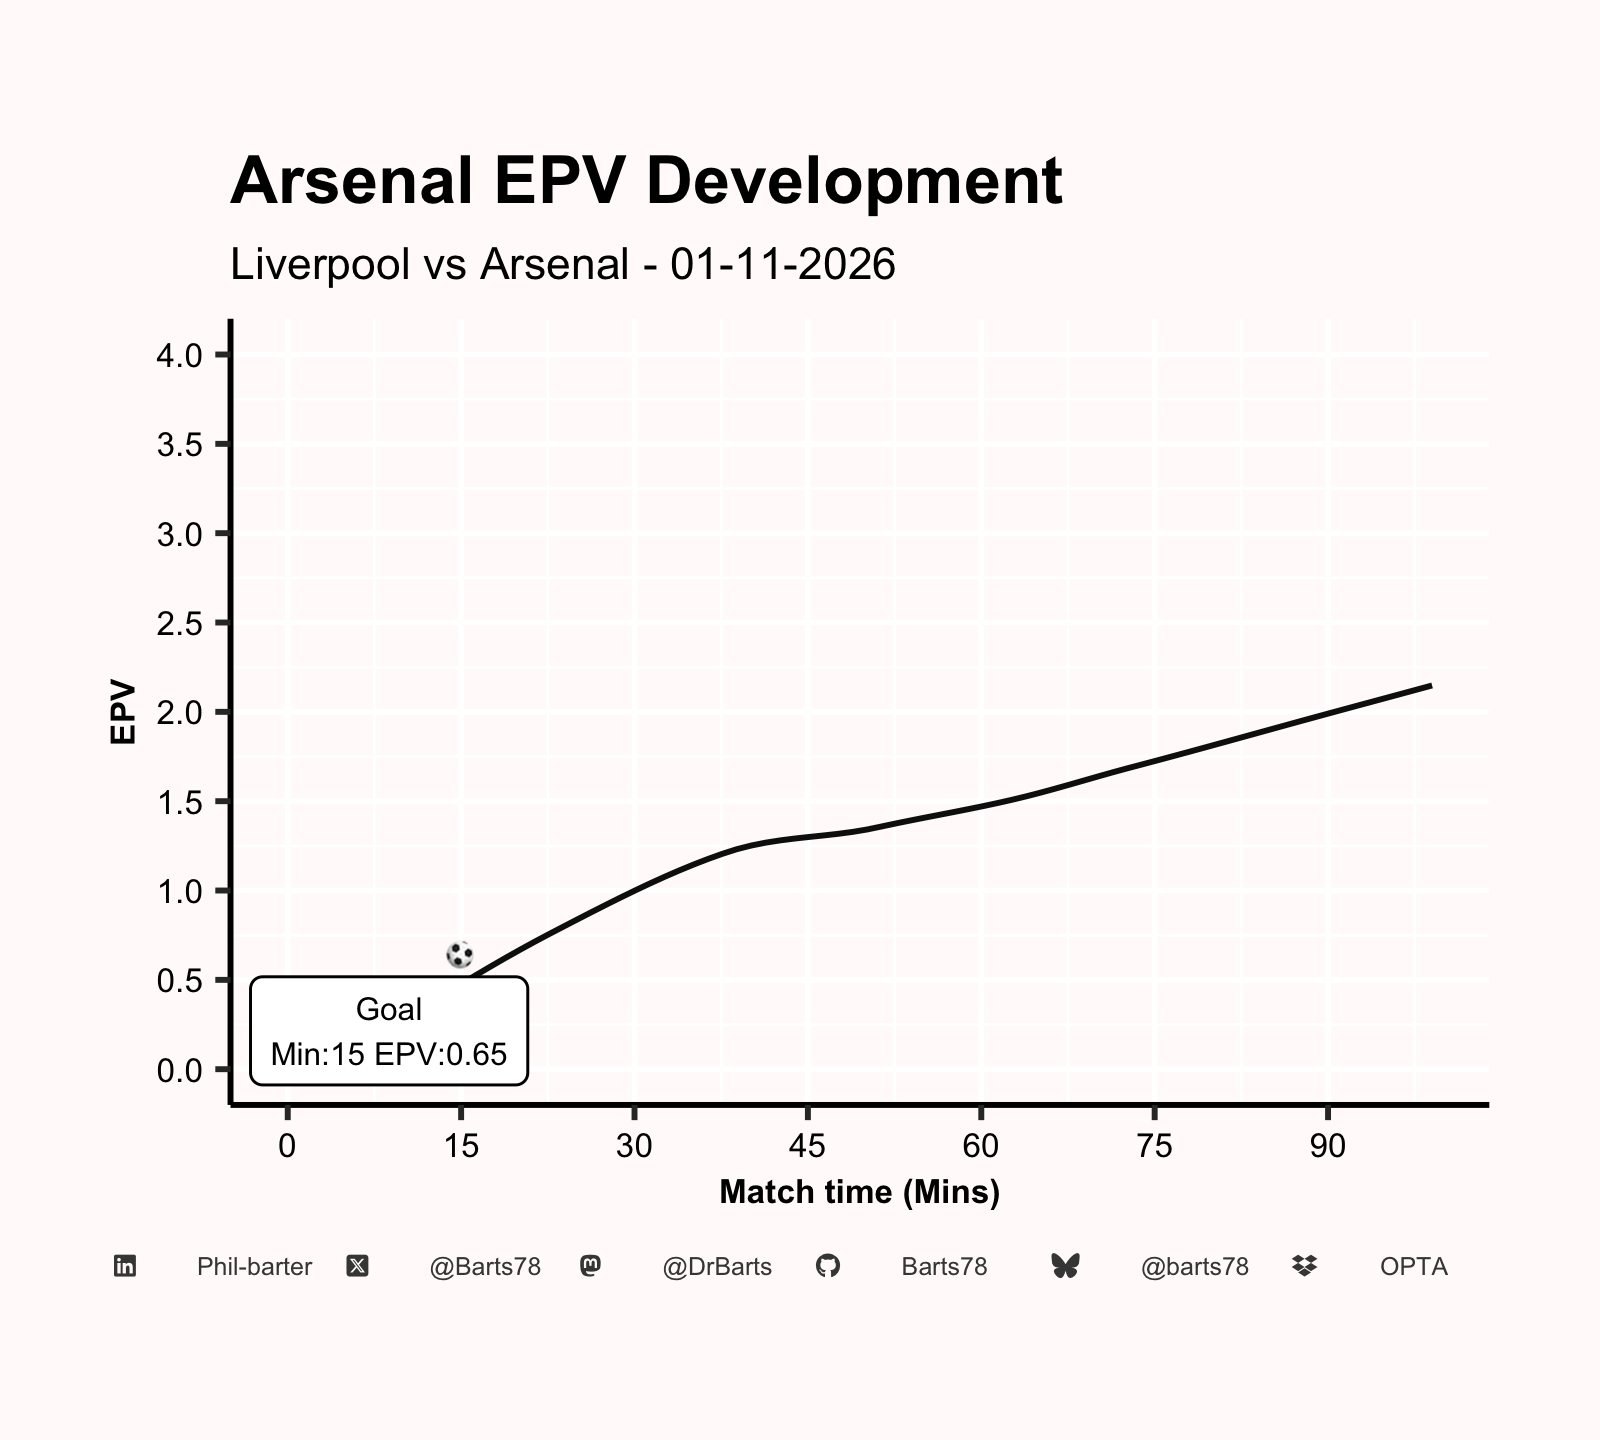
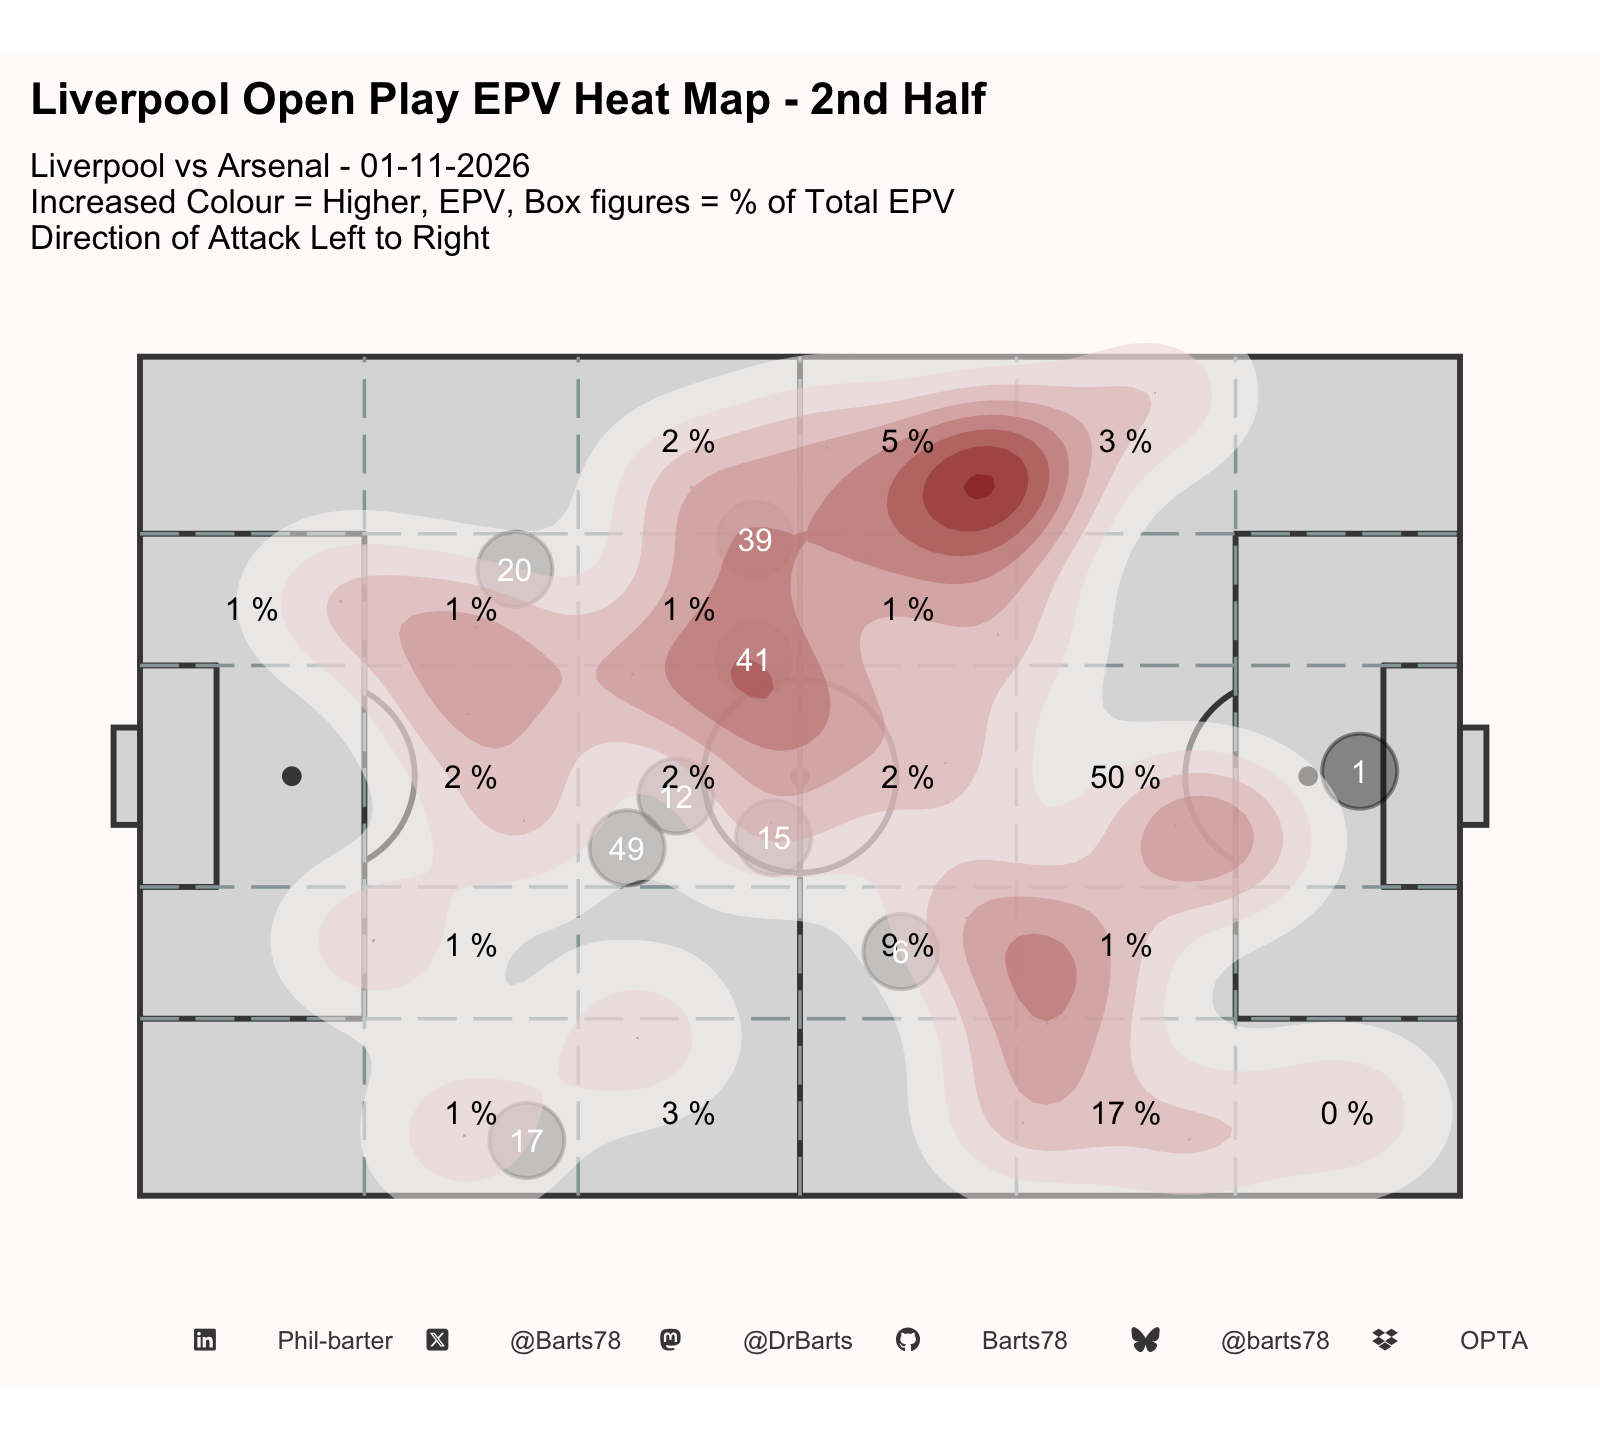
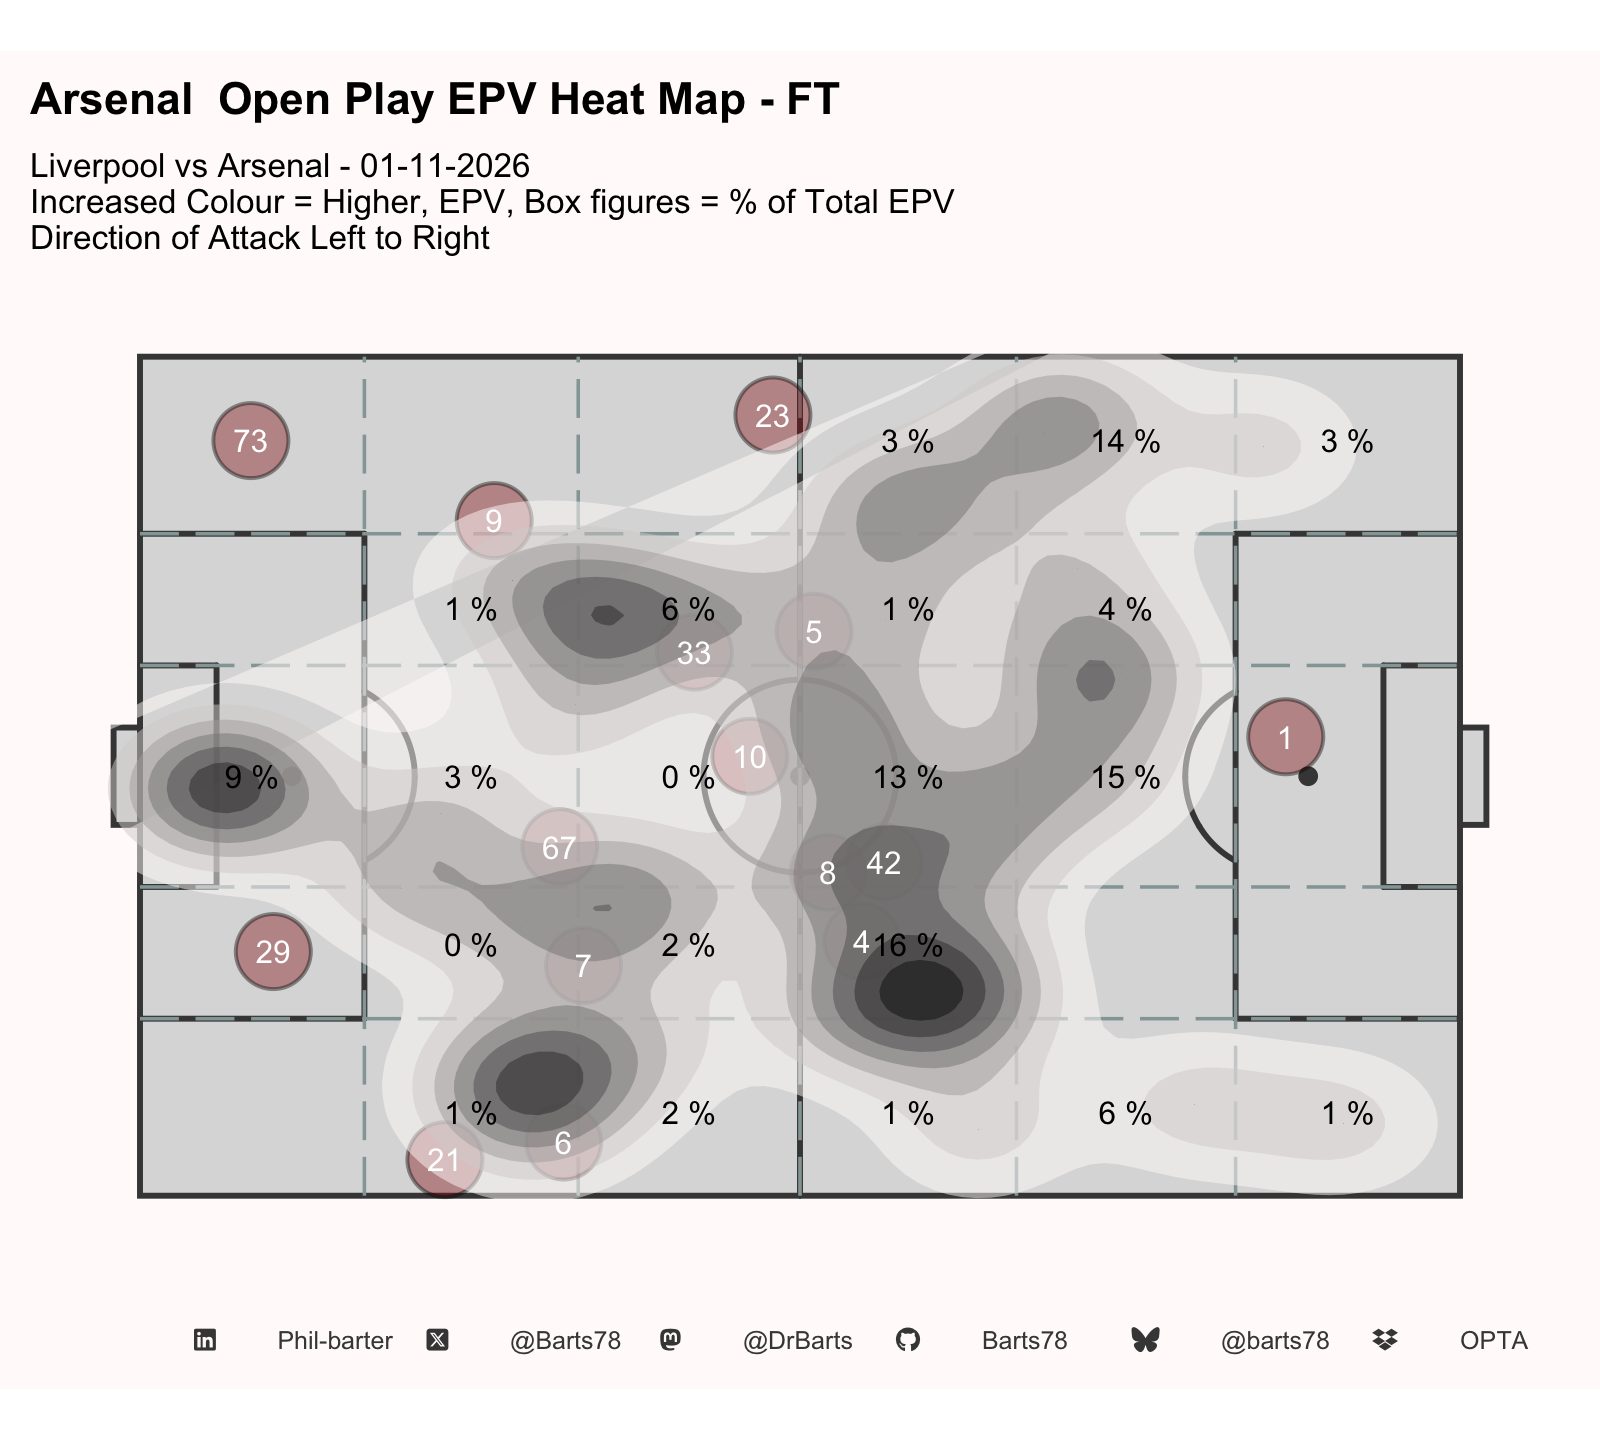
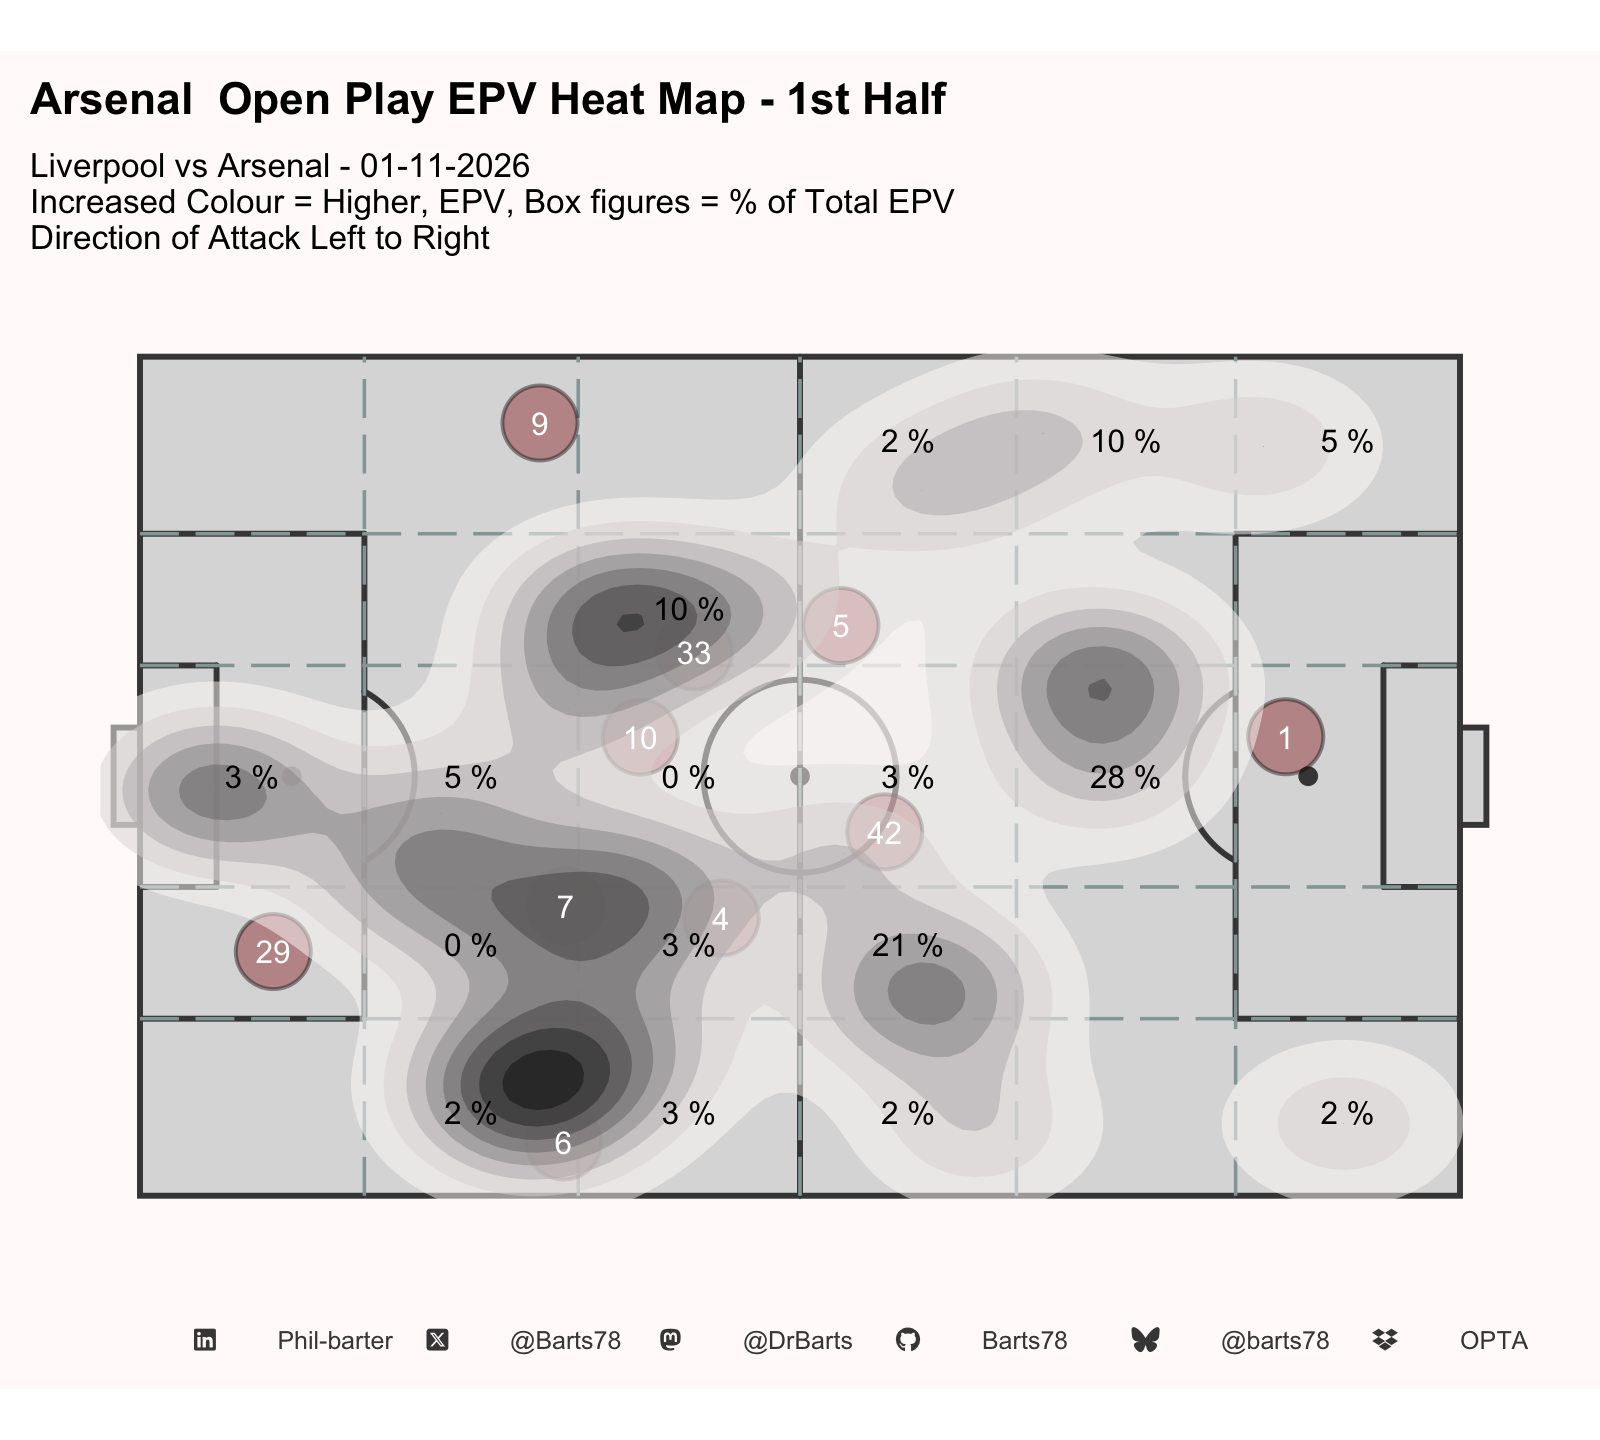
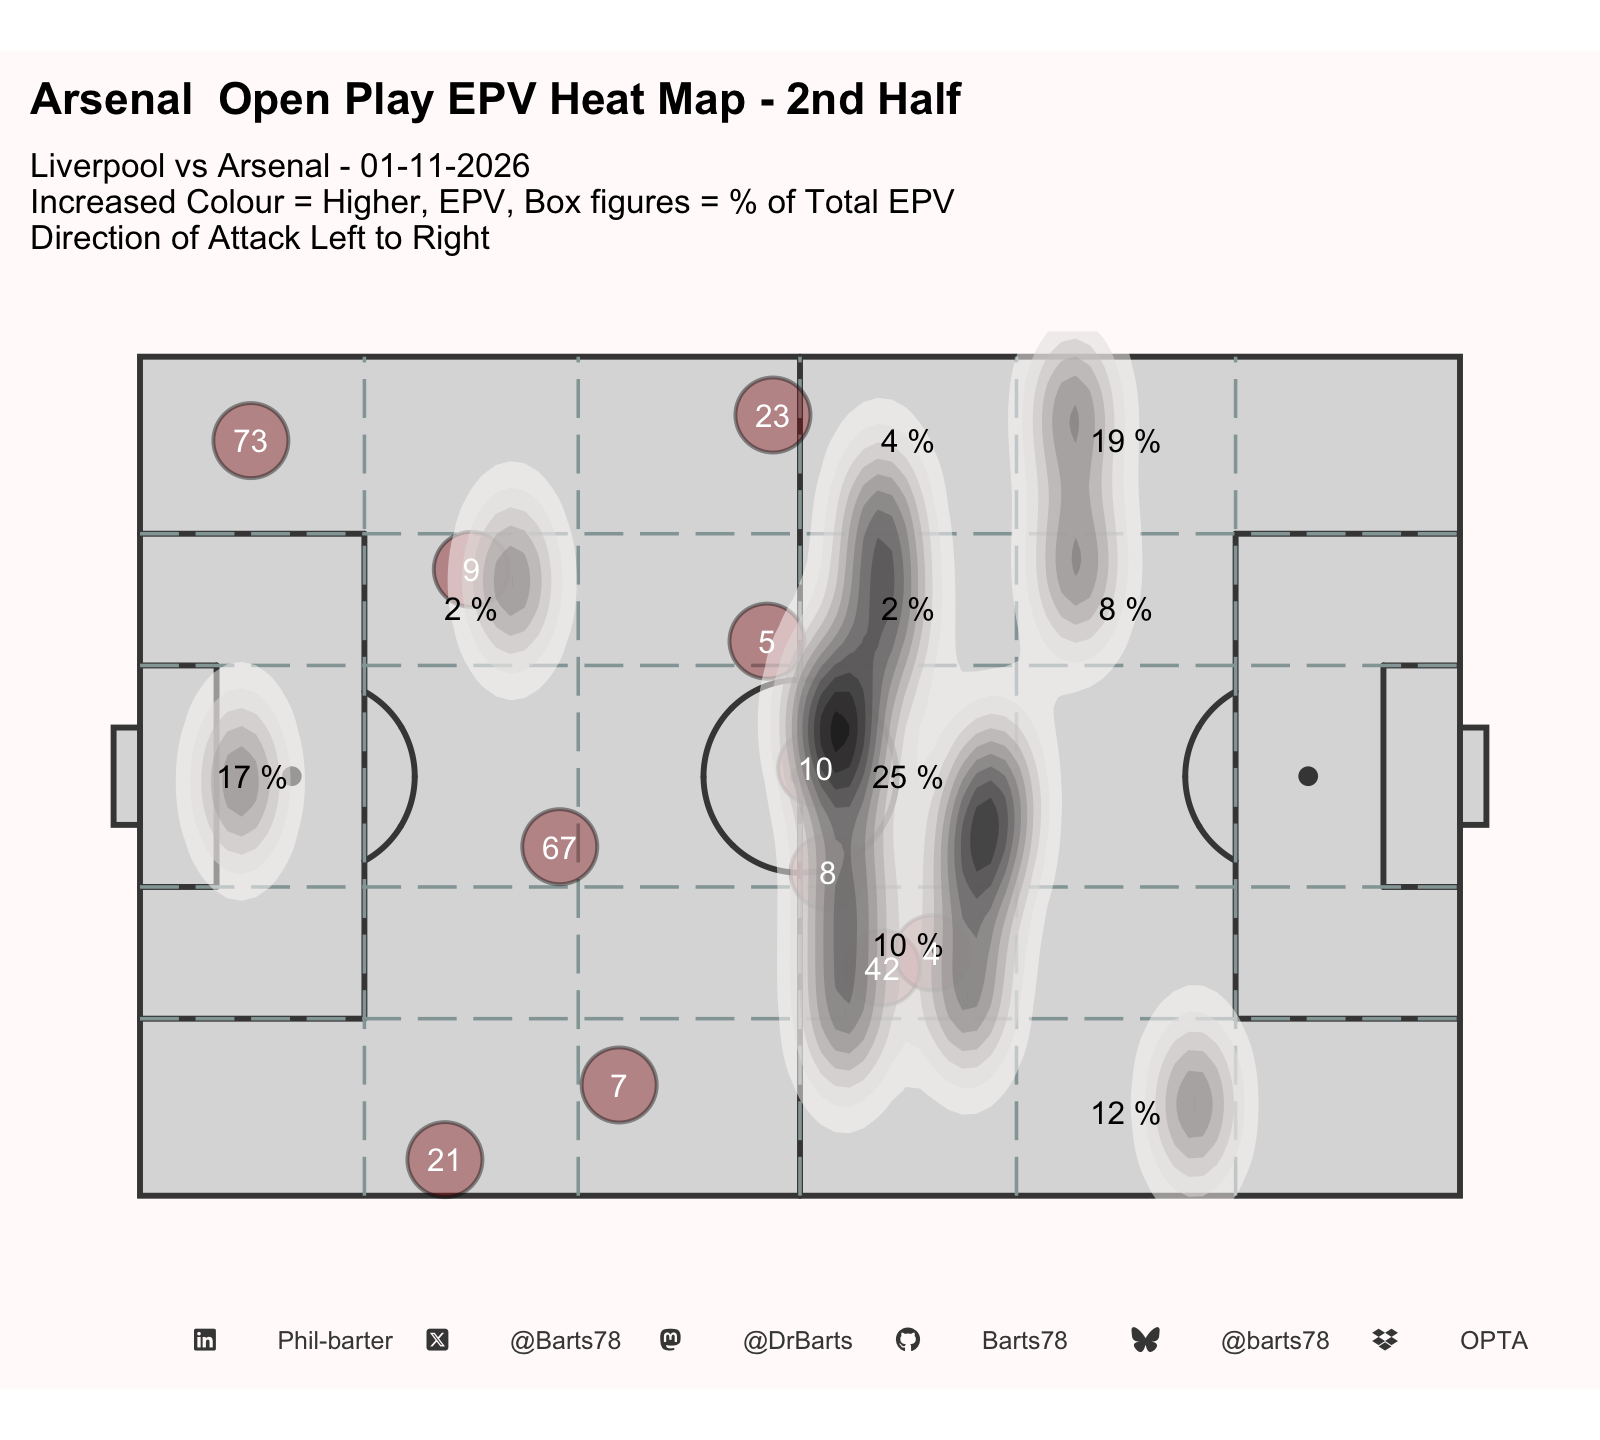
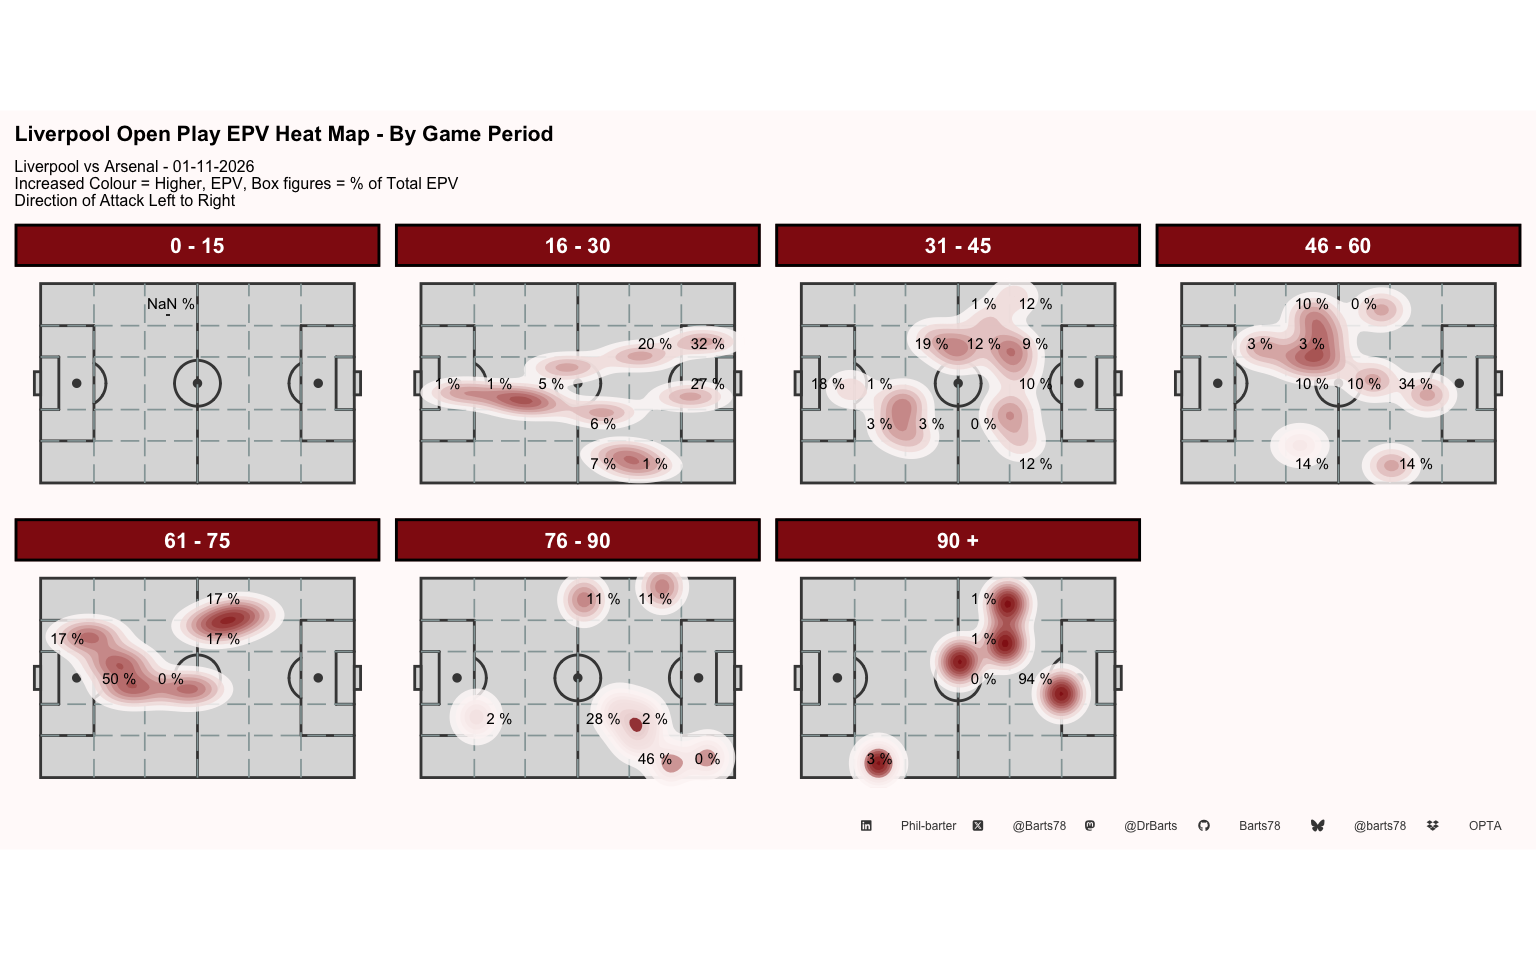
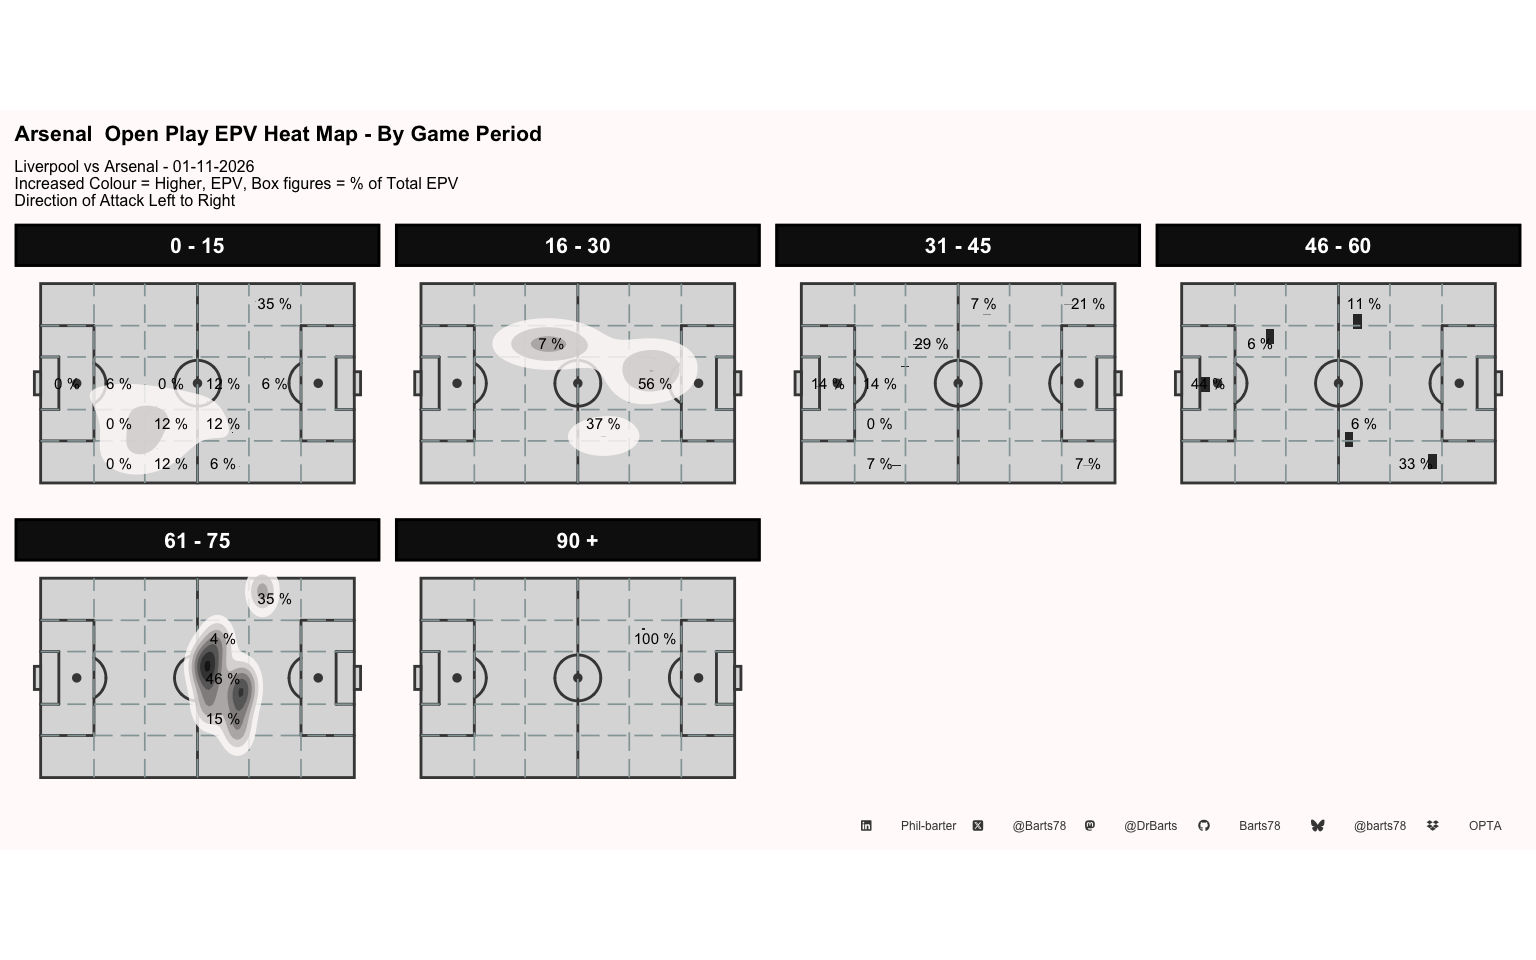
| Liverpool Open Play Threat Events | ||||||||||||
| Liverpool vs Arsenal - 01-11-2026 Top 5 Events | ||||||||||||
| Successful Passes | UnSuccessful_Passes | Long Passes | Crosses | PK Box Passes | Key Passes | Prog Passes | Final Third Passes | BCs | EPV | xT | Game Min | |
|---|---|---|---|---|---|---|---|---|---|---|---|---|
| Virgil van Dijk | ||||||||||||
| Ronald Araujo | 1 | 0 | 0 | 0 | 1 | 1 | 1 | 1 | 0 | 0.144 | 0.193 | 79 |
| Kostas Tsimikas | ||||||||||||
| Virgil van Dijk | 1 | 0 | 0 | 0 | 0 | 0 | 1 | 1 | 0 | 0.080 | 0.084 | 90 |
| Alexander Isak | ||||||||||||
| Bradley Barcola | 1 | 0 | 0 | 0 | 0 | 1 | 1 | 1 | 0 | 0.066 | 0.073 | 94 |
| Trey Nyoni | ||||||||||||
| Alexander Isak | 1 | 0 | 0 | 0 | 0 | 0 | 1 | 1 | 0 | 0.063 | 0.073 | 55 |
| Rio Ngumoha | ||||||||||||
| Virgil van Dijk | 1 | 0 | 0 | 0 | 0 | 0 | 1 | 1 | 0 | 0.061 | 0.036 | 79 |
| X @Barts78 · Bluesky @barts78 · Mastodon @DrBarts · GitHub Barts78 · LinkedIn Phil-barter · Data: Opta | ||||||||||||
| Liverpool Open Play Threat Events | ||||||||||||
| Liverpool vs Arsenal - 01-11-2026 Bottom 5 Events | ||||||||||||
| Successful Passes | UnSuccessful_Passes | Long Passes | Crosses | PK Box Passes | Key Passes | Prog Passes | Final Third Passes | BCs | EPV | xT | Game Min | |
|---|---|---|---|---|---|---|---|---|---|---|---|---|
| Virgil van Dijk | ||||||||||||
| Kostas Tsimikas | 1 | 0 | 0 | 0 | 1 | 0 | 0 | 1 | 0 | −0.070 | −0.067 | 89 |
| Bradley Barcola | ||||||||||||
| Ronald Araujo | 1 | 0 | 0 | 0 | 1 | 0 | 0 | 1 | 0 | −0.052 | −0.073 | 27 |
| Alexis Mac Allister | ||||||||||||
| Cody Gakpo | 1 | 0 | 0 | 0 | 1 | 1 | 0 | 1 | 0 | −0.024 | −0.053 | 26 |
| Dominik Szoboszlai | 1 | 0 | 0 | 0 | 1 | 0 | 0 | 1 | 0 | −0.022 | −0.020 | 80 |
| Florian Wirtz | ||||||||||||
| Cody Gakpo | 1 | 0 | 0 | 0 | 1 | 0 | 0 | 1 | 0 | −0.024 | −0.027 | 53 |
| X @Barts78 · Bluesky @barts78 · Mastodon @DrBarts · GitHub Barts78 · LinkedIn Phil-barter · Data: Opta | ||||||||||||
| Liverpool Open Play Threat Events | ||||||||
| Liverpool vs Arsenal - 01-11-2026 Top 5 Events | ||||||||
| Successful Carries | UnSuccessful_Carries | Prog Carries | Final Third Carries | BCs | EPV | xT | Game Min | |
|---|---|---|---|---|---|---|---|---|
| Alexander Isak | ||||||||
| Bradley Barcola | 1 | 0 | 0 | 1 | 0 | 0.066 | 0.073 | 94 |
| Bradley Barcola | ||||||||
| Cody Gakpo | 1 | 0 | 0 | 1 | 0 | 0.028 | 0.053 | 28 |
| Florian Wirtz | ||||||||
| Bradley Barcola | 1 | 0 | 0 | 1 | 0 | 0.018 | 0.004 | 28 |
| Víctor Muñoz | ||||||||
| Rio Ngumoha | 1 | 0 | 0 | 1 | 0 | 0.013 | 0.010 | 85 |
| Jérémy Jacquet | ||||||||
| Rio Ngumoha | 1 | 0 | 1 | 1 | 0 | 0.013 | 0.008 | 89 |
| X @Barts78 · Bluesky @barts78 · Mastodon @DrBarts · GitHub Barts78 · LinkedIn Phil-barter · Data: Opta | ||||||||
| Liverpool Open Play Threat Events | ||||||||
| Liverpool vs Arsenal - 01-11-2026 Bottom 5 Events | ||||||||
| Successful Carries | UnSuccessful_Carries | Prog Carries | Final Third Carries | BCs | EPV | xT | Game Min | |
|---|---|---|---|---|---|---|---|---|
| Alexis Mac Allister | ||||||||
| Cody Gakpo | 1 | 0 | 1 | 1 | 0 | −0.024 | −0.053 | 26 |
| Dominik Szoboszlai | 0 | 1 | 0 | 1 | 0 | −0.022 | −0.020 | 80 |
| Cody Gakpo | 1 | 0 | 0 | 1 | 0 | −0.010 | 0.006 | 56 |
| Ronald Araujo | ||||||||
| Alexis Mac Allister | 0 | 1 | 0 | 1 | 0 | −0.009 | 0.000 | 78 |
| Víctor Muñoz | ||||||||
| Rio Ngumoha | 0 | 1 | 0 | 1 | 0 | −0.006 | −0.003 | 85 |
| X @Barts78 · Bluesky @barts78 · Mastodon @DrBarts · GitHub Barts78 · LinkedIn Phil-barter · Data: Opta | ||||||||
| Arsenal Open Play Threat Events | ||||||||||||
| Liverpool vs Arsenal - 01-11-2026 Top 5 Events | ||||||||||||
| Successful Passes | UnSuccessful_Passes | Long Passes | Crosses | PK Box Passes | Key Passes | Prog Passes | Final Third Passes | BCs | EPV | xT | Game Min | |
|---|---|---|---|---|---|---|---|---|---|---|---|---|
| Noni Madueke | ||||||||||||
| Jurriën Timber | 1 | 0 | 0 | 0 | 1 | 1 | 1 | 1 | 0 | 0.123 | 0.000 | 24 |
| Martin Ødegaard | 1 | 0 | 0 | 0 | 0 | 0 | 1 | 1 | 0 | 0.046 | 0.035 | 32 |
| Martin Ødegaard | ||||||||||||
| Bruno Guimarães | 1 | 0 | 0 | 0 | 1 | 0 | 1 | 1 | 0 | 0.041 | 0.044 | 32 |
| Riccardo Calafiori | 1 | 0 | 1 | 0 | 0 | 0 | 1 | 0 | 0 | 0.030 | 0.025 | 75 |
| David Raya | ||||||||||||
| Riccardo Calafiori | 1 | 0 | 1 | 0 | 0 | 0 | 0 | 0 | 0 | 0.034 | 0.027 | 87 |
| X @Barts78 · Bluesky @barts78 · Mastodon @DrBarts · GitHub Barts78 · LinkedIn Phil-barter · Data: Opta | ||||||||||||
| Arsenal Open Play Threat Events | ||||||||||||
| Liverpool vs Arsenal - 01-11-2026 Bottom 5 Events | ||||||||||||
| Successful Passes | UnSuccessful_Passes | Long Passes | Crosses | PK Box Passes | Key Passes | Prog Passes | Final Third Passes | BCs | EPV | xT | Game Min | |
|---|---|---|---|---|---|---|---|---|---|---|---|---|
| Riccardo Calafiori | ||||||||||||
| Christos Tzolis | 1 | 0 | 0 | 0 | 1 | 0 | 0 | 1 | 0 | −0.024 | −0.024 | 75 |
| Gabriel Magalhães | 1 | 0 | 0 | 0 | 0 | 0 | 0 | 1 | 0 | −0.017 | −0.013 | 65 |
| Martin Ødegaard | ||||||||||||
| Christos Tzolis | 1 | 0 | 1 | 0 | 0 | 0 | 1 | 1 | 0 | −0.021 | −0.014 | 71 |
| Declan Rice | 1 | 0 | 0 | 0 | 0 | 0 | 0 | 1 | 0 | −0.014 | −0.005 | 24 |
| Noni Madueke | ||||||||||||
| Bruno Guimarães | 1 | 0 | 0 | 0 | 1 | 1 | 0 | 1 | 0 | −0.017 | −0.010 | 23 |
| X @Barts78 · Bluesky @barts78 · Mastodon @DrBarts · GitHub Barts78 · LinkedIn Phil-barter · Data: Opta | ||||||||||||
| Arsenal Open Play Threat Events | ||||||||
| Liverpool vs Arsenal - 01-11-2026 Top 5 Events | ||||||||
| Successful Carries | UnSuccessful_Carries | Prog Carries | Final Third Carries | BCs | EPV | xT | Game Min | |
|---|---|---|---|---|---|---|---|---|
| Jurriën Timber | ||||||||
| Noni Madueke | 1 | 0 | 0 | 1 | 0 | 0.010 | 0.011 | 24 |
| David Raya | ||||||||
| Kai Havertz | 1 | 0 | 0 | 0 | 0 | 0.008 | 0.007 | 62 |
| Riccardo Calafiori | ||||||||
| Christos Tzolis | 1 | 0 | 1 | 1 | 0 | 0.008 | 0.017 | 24 |
| Bruno Guimarães | ||||||||
| Noni Madueke | 1 | 0 | 1 | 1 | 0 | 0.007 | 0.017 | 23 |
| Noni Madueke | ||||||||
| Kai Havertz | 1 | 0 | 0 | 1 | 0 | 0.006 | 0.004 | 73 |
| X @Barts78 · Bluesky @barts78 · Mastodon @DrBarts · GitHub Barts78 · LinkedIn Phil-barter · Data: Opta | ||||||||
| Arsenal Open Play Threat Events | ||||||||
| Liverpool vs Arsenal - 01-11-2026 Bottom 5 Events | ||||||||
| Successful Carries | UnSuccessful_Carries | Prog Carries | Final Third Carries | BCs | EPV | xT | Game Min | |
|---|---|---|---|---|---|---|---|---|
| Riccardo Calafiori | ||||||||
| Christos Tzolis | 0 | 1 | 0 | 1 | 0 | −0.024 | −0.024 | 75 |
| Bruno Guimarães | 1 | 0 | 0 | 1 | 0 | −0.009 | −0.014 | 14 |
| Declan Rice | 1 | 0 | 0 | 0 | 0 | −0.005 | −0.004 | 24 |
| Christos Tzolis | ||||||||
| Gabriel Magalhães | 1 | 0 | 0 | 0 | 0 | −0.009 | −0.006 | 68 |
| Bruno Guimarães | ||||||||
| Gabriel Magalhães | 1 | 0 | 0 | 0 | 0 | −0.006 | −0.005 | 14 |
| X @Barts78 · Bluesky @barts78 · Mastodon @DrBarts · GitHub Barts78 · LinkedIn Phil-barter · Data: Opta | ||||||||
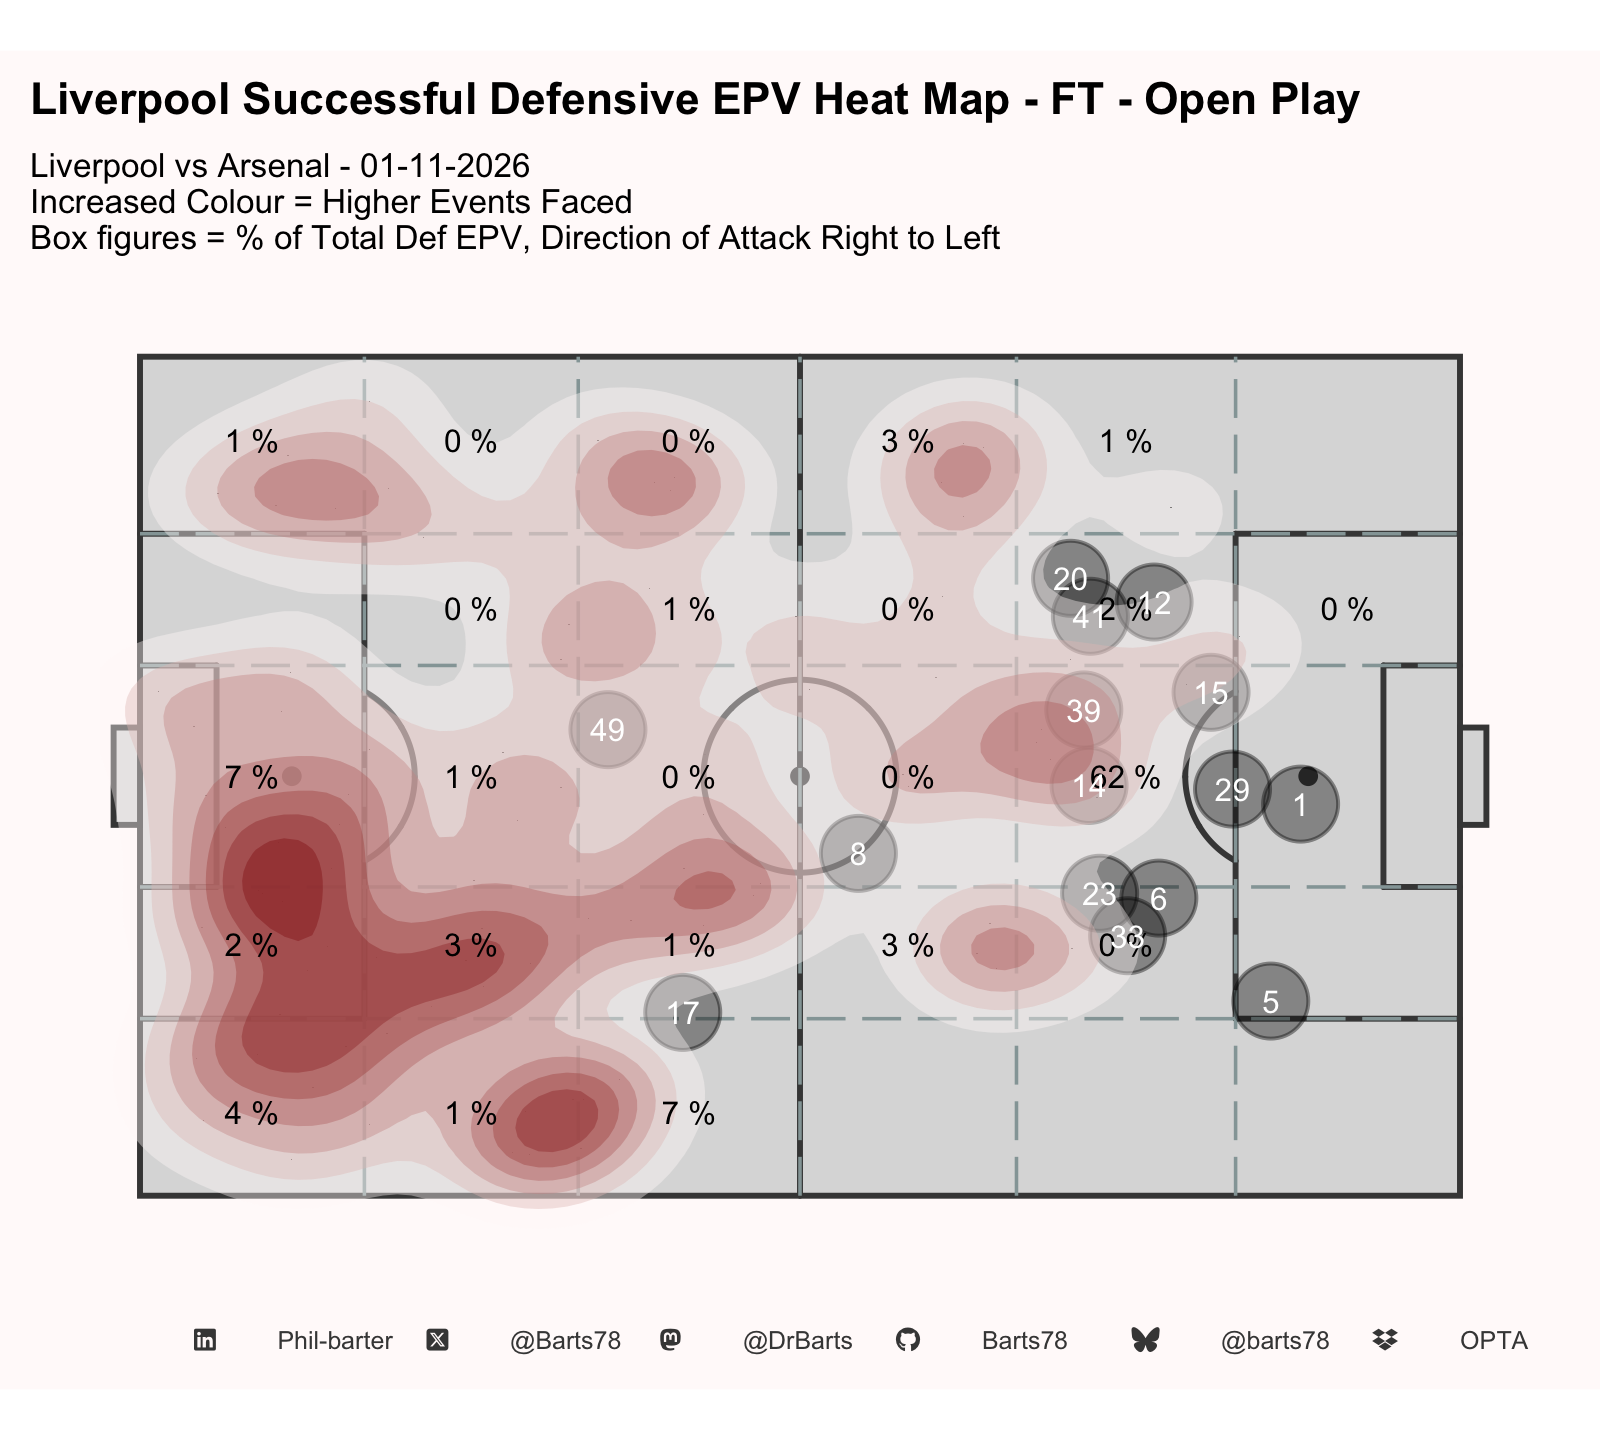
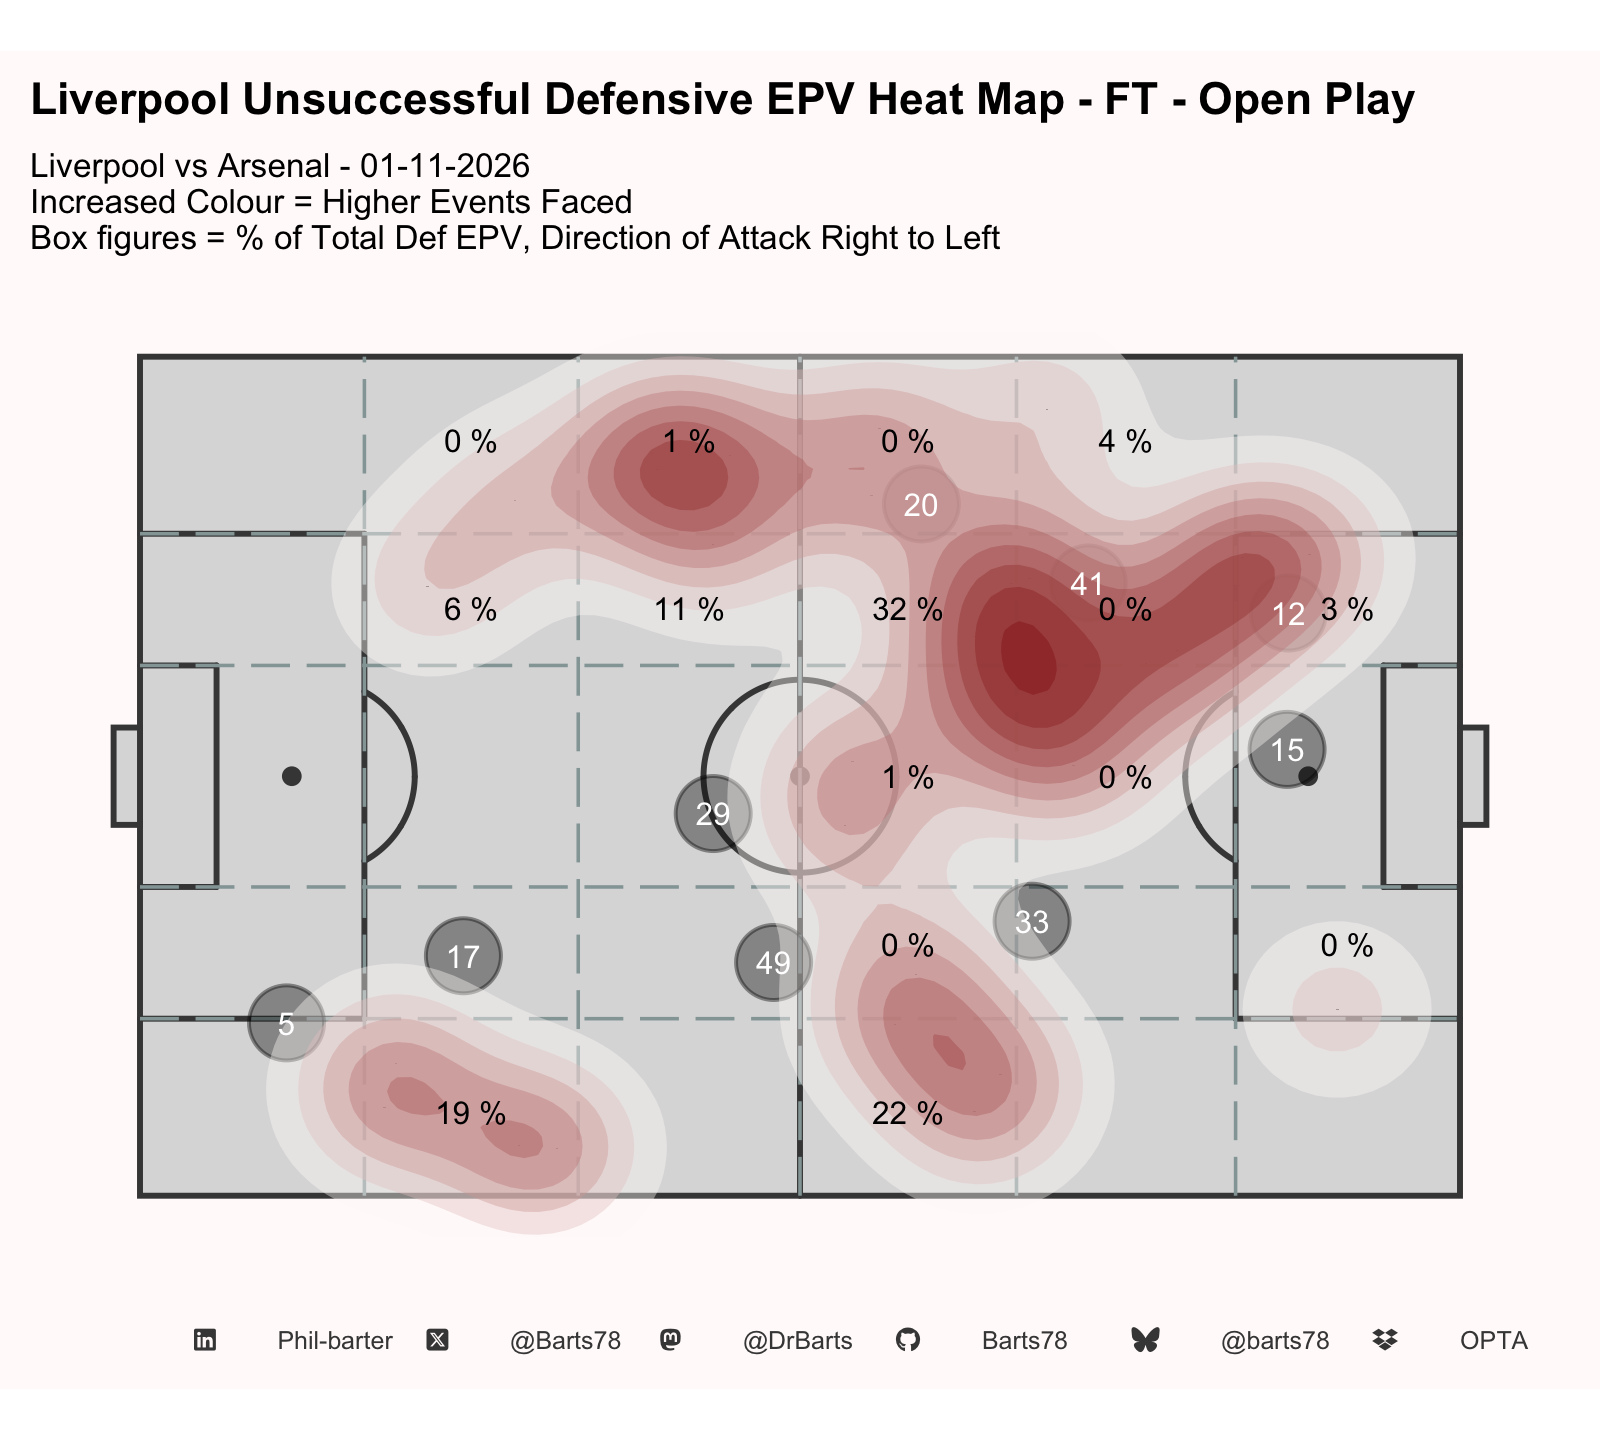
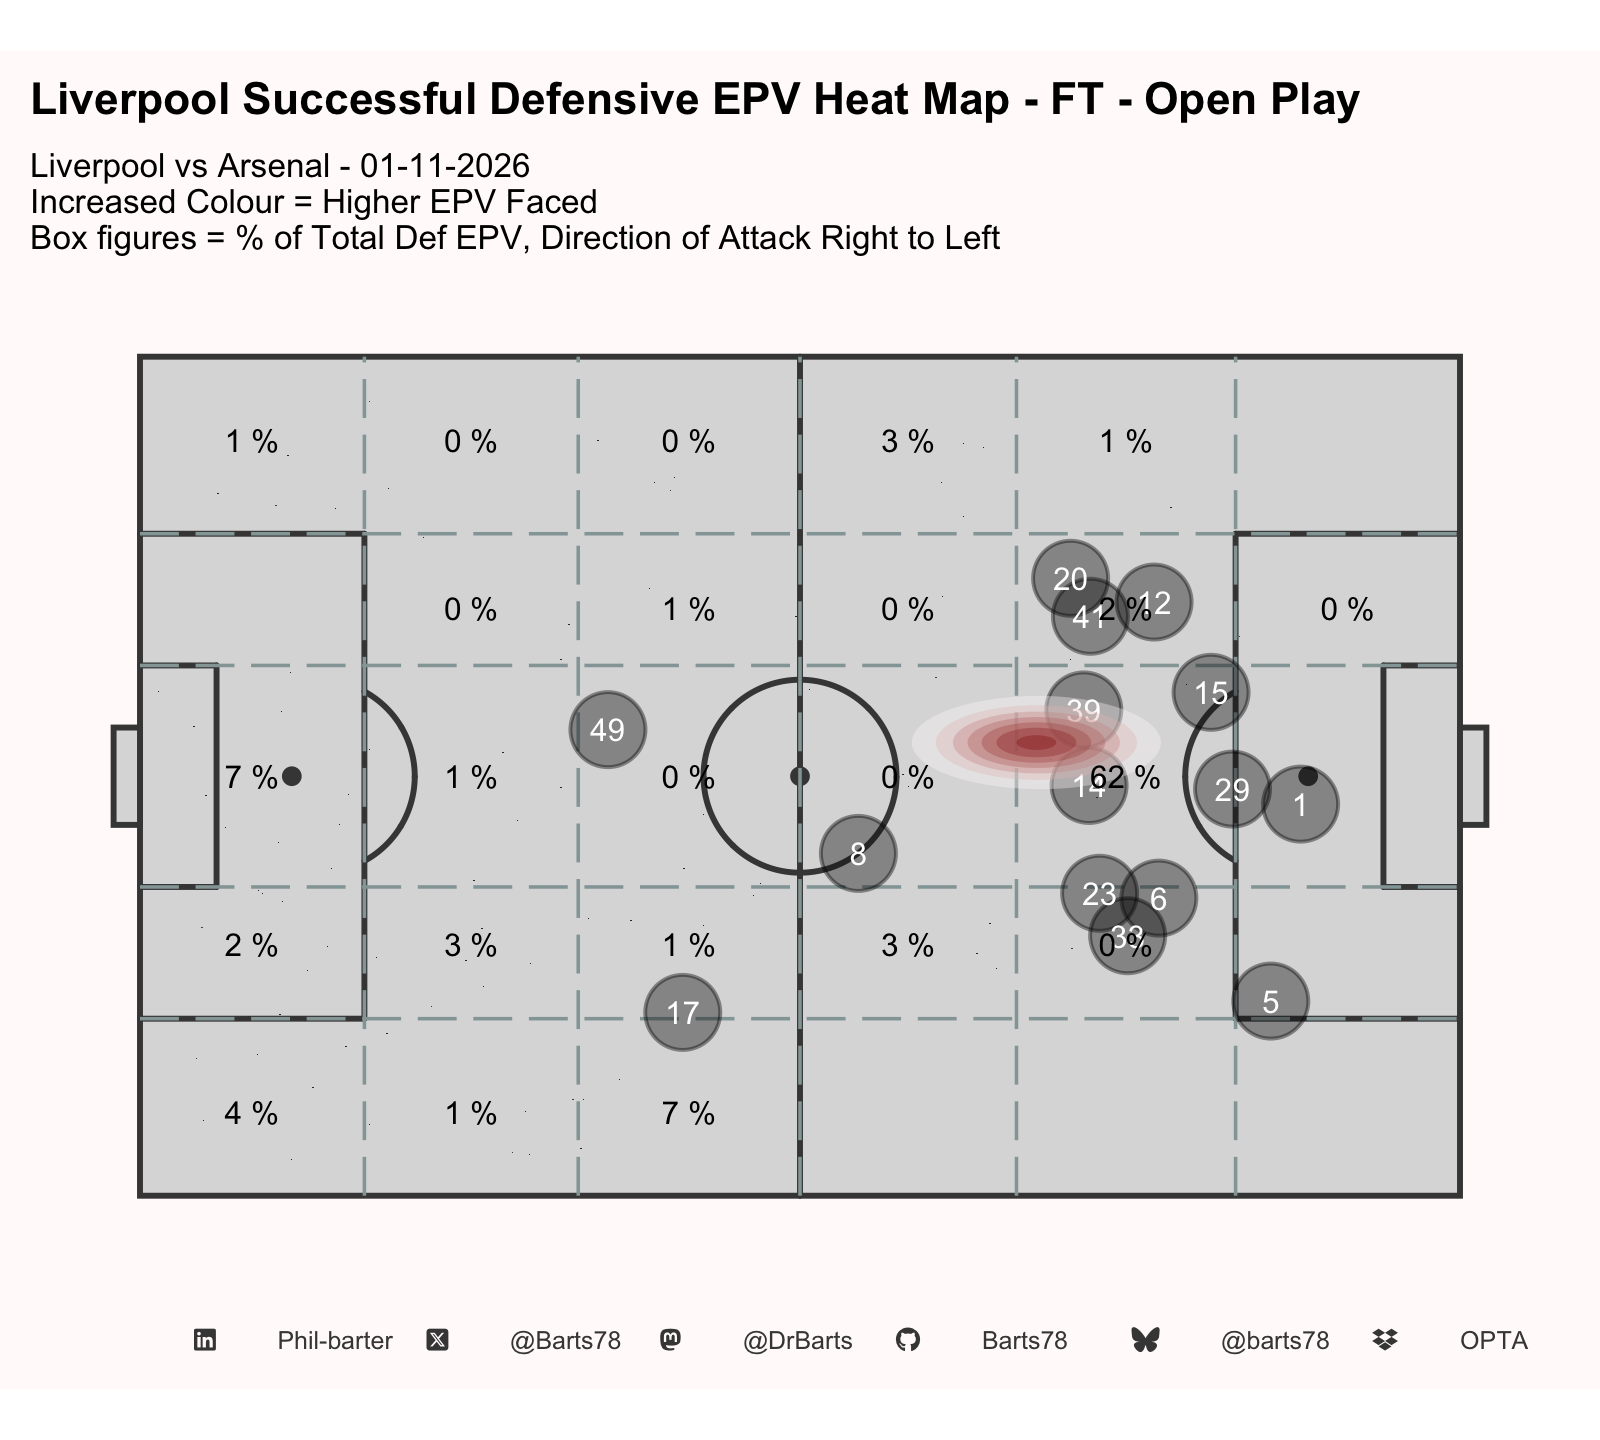
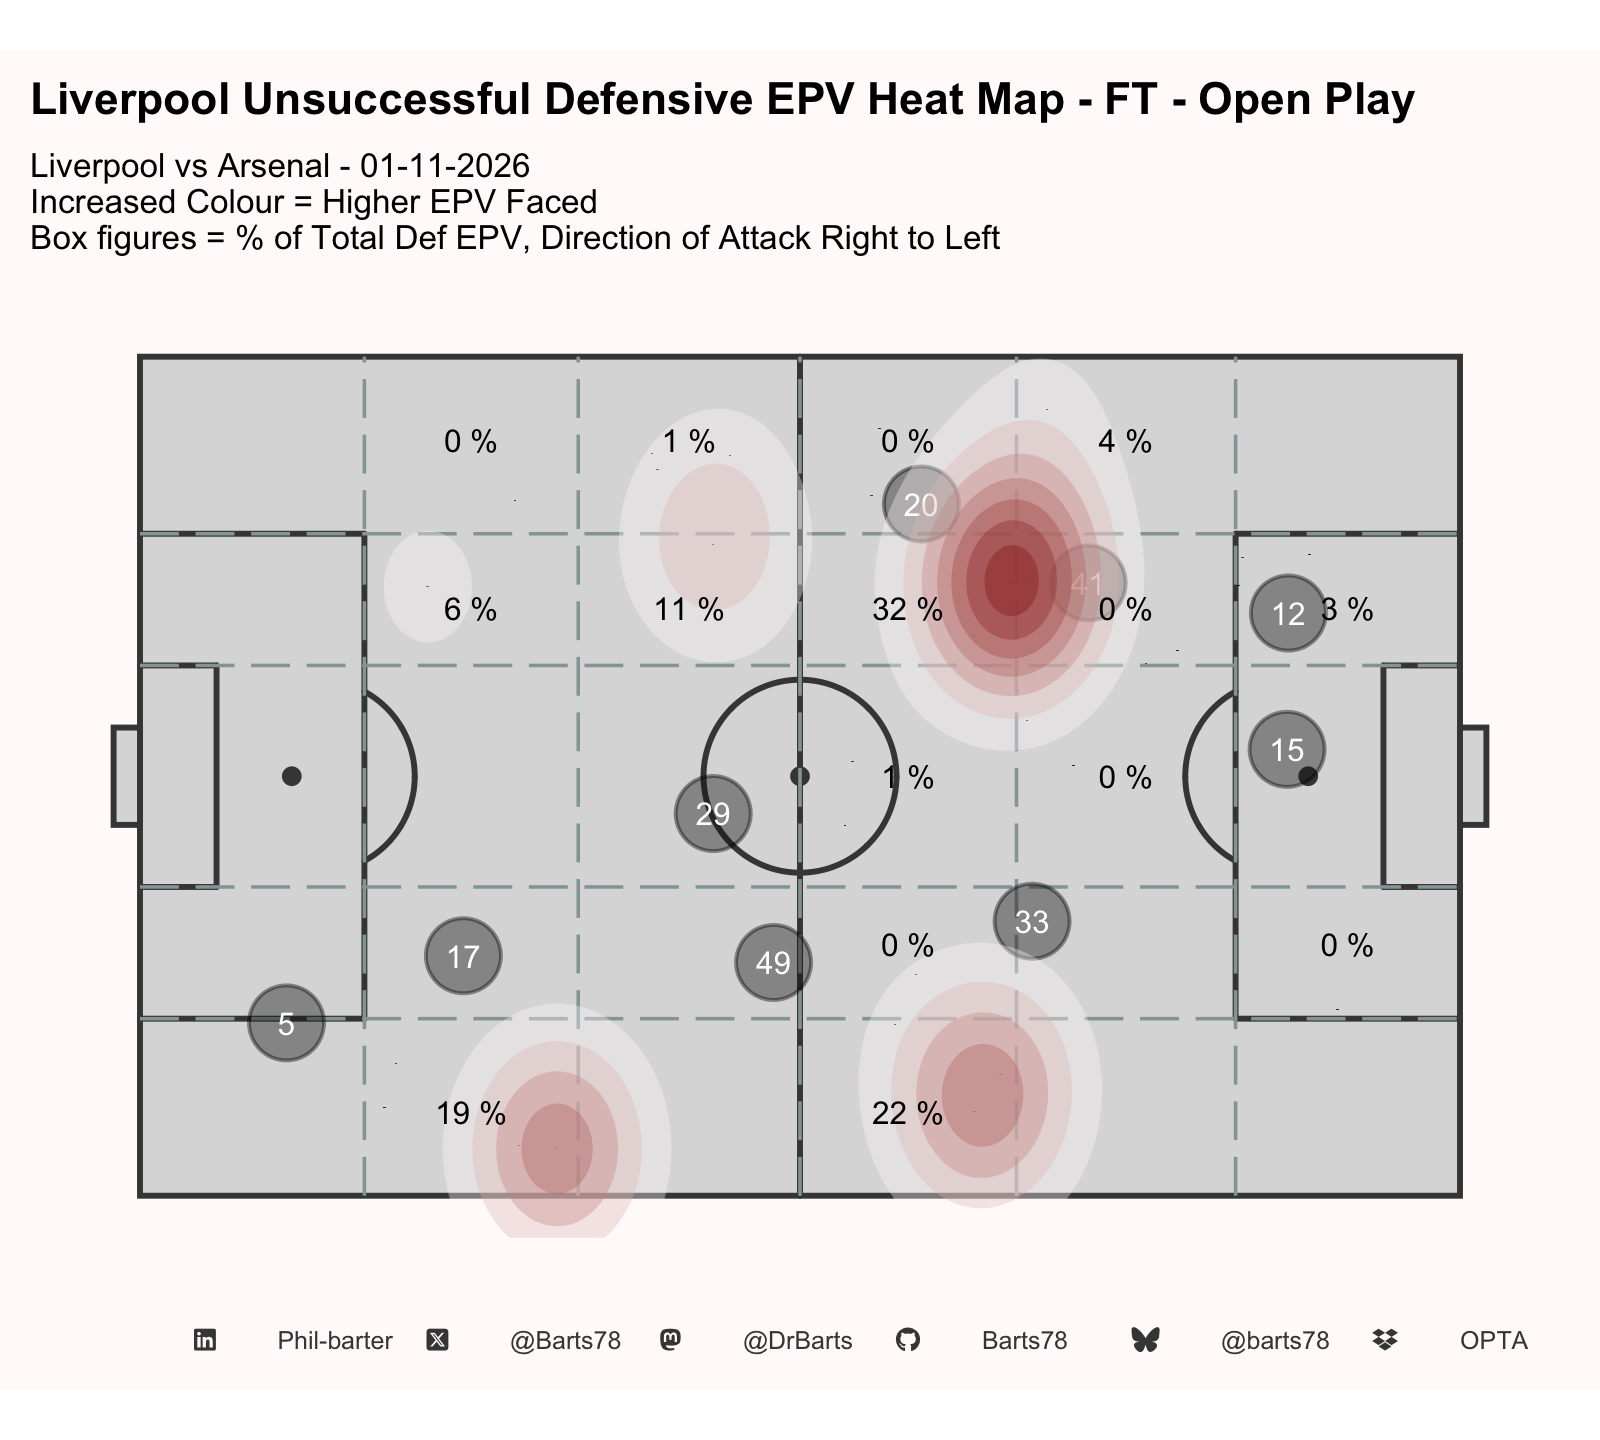
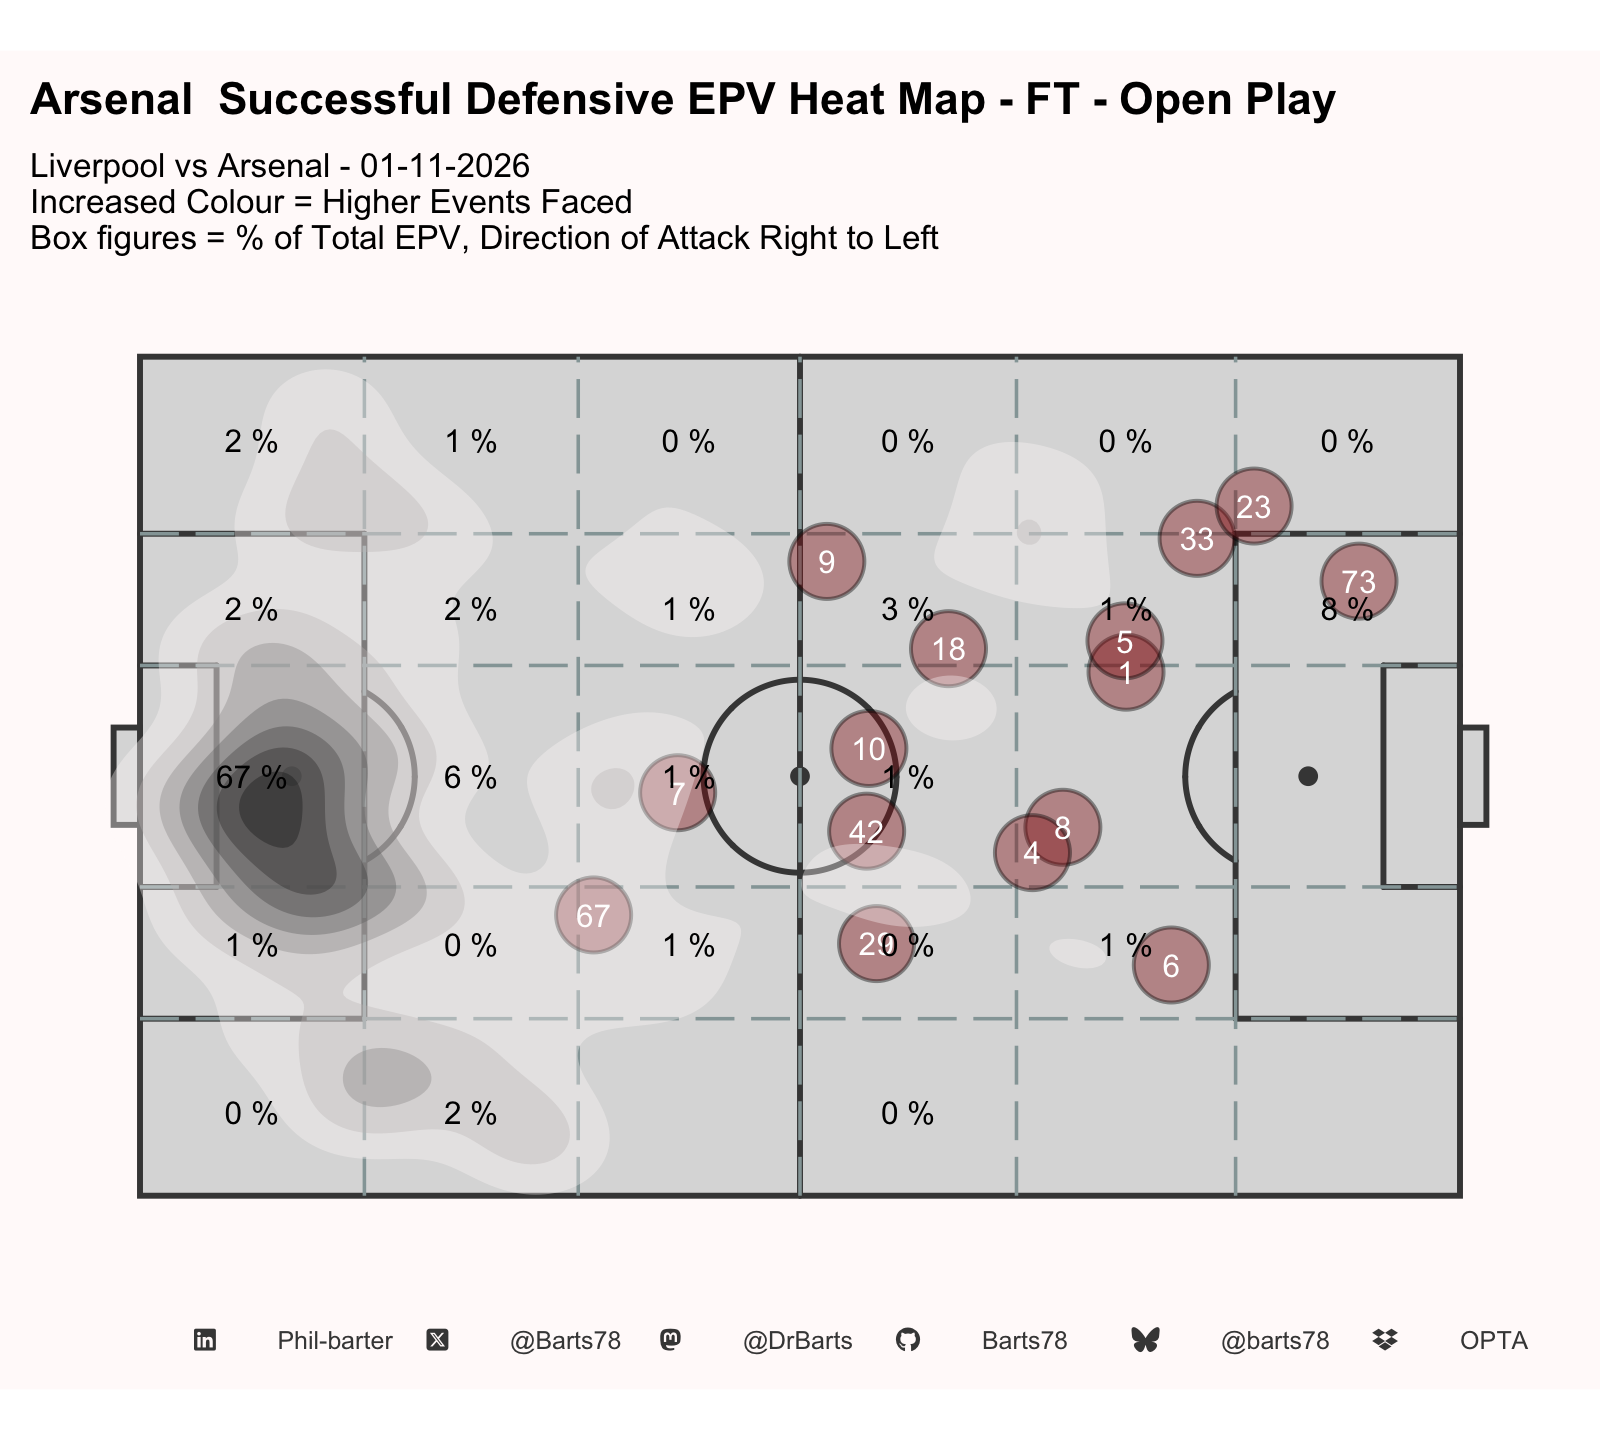
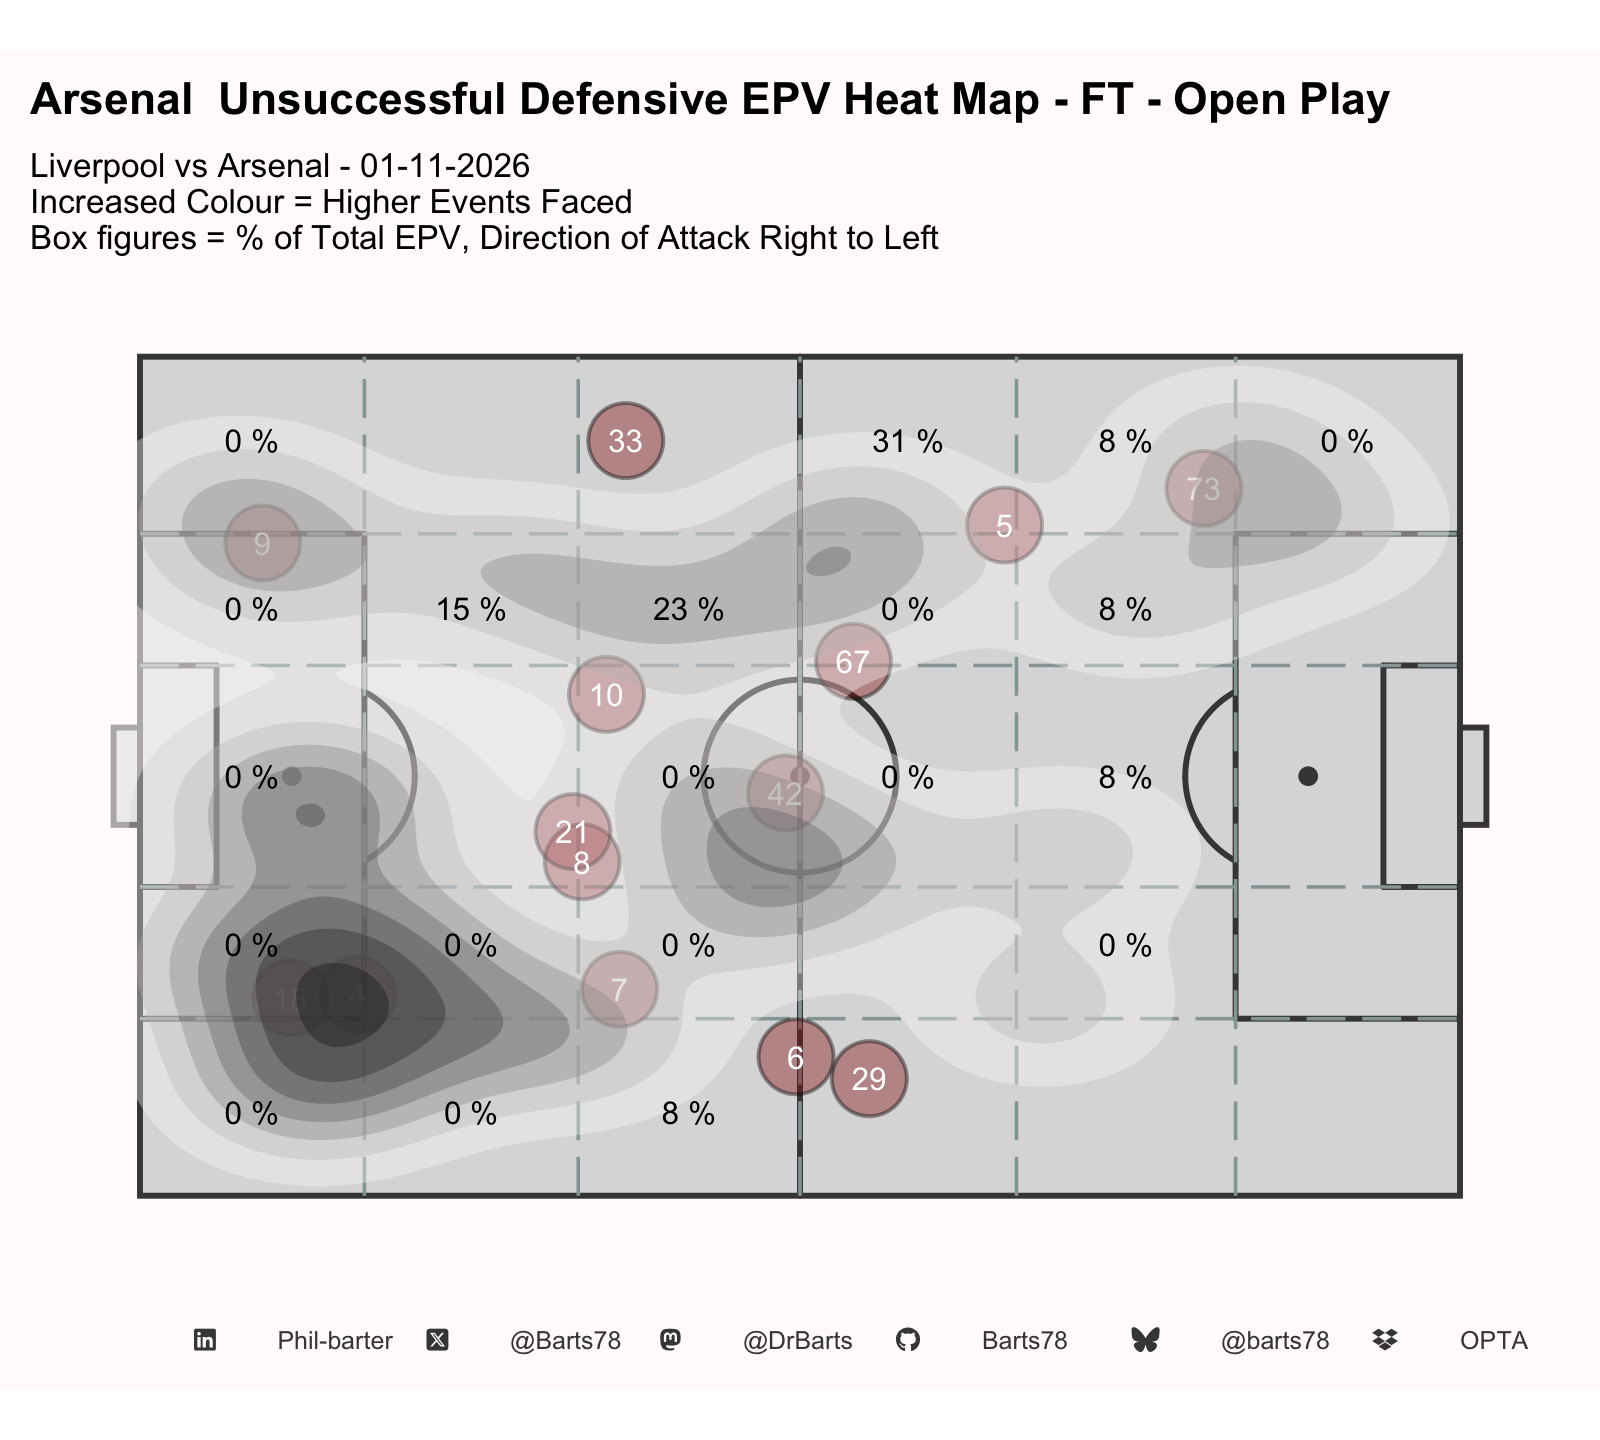
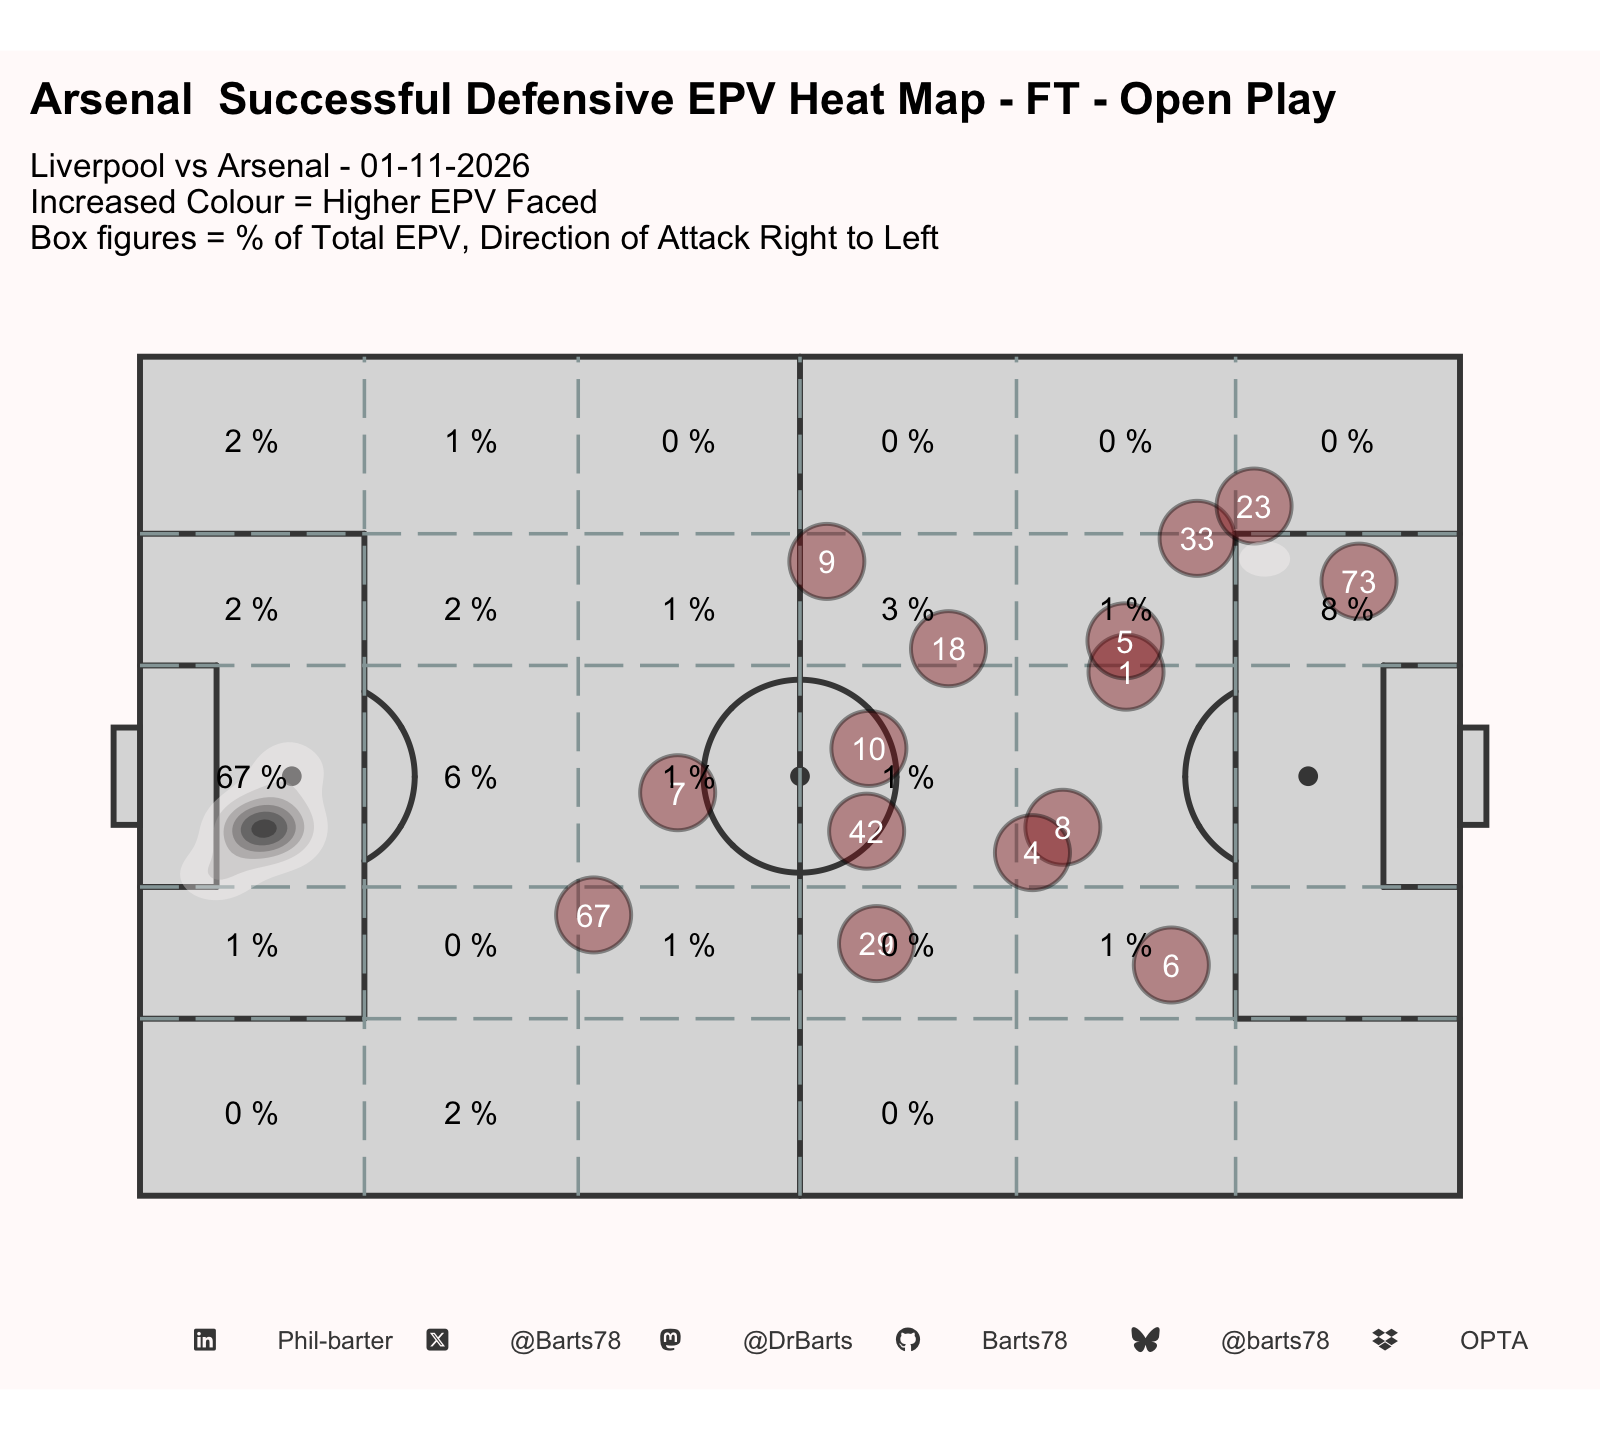
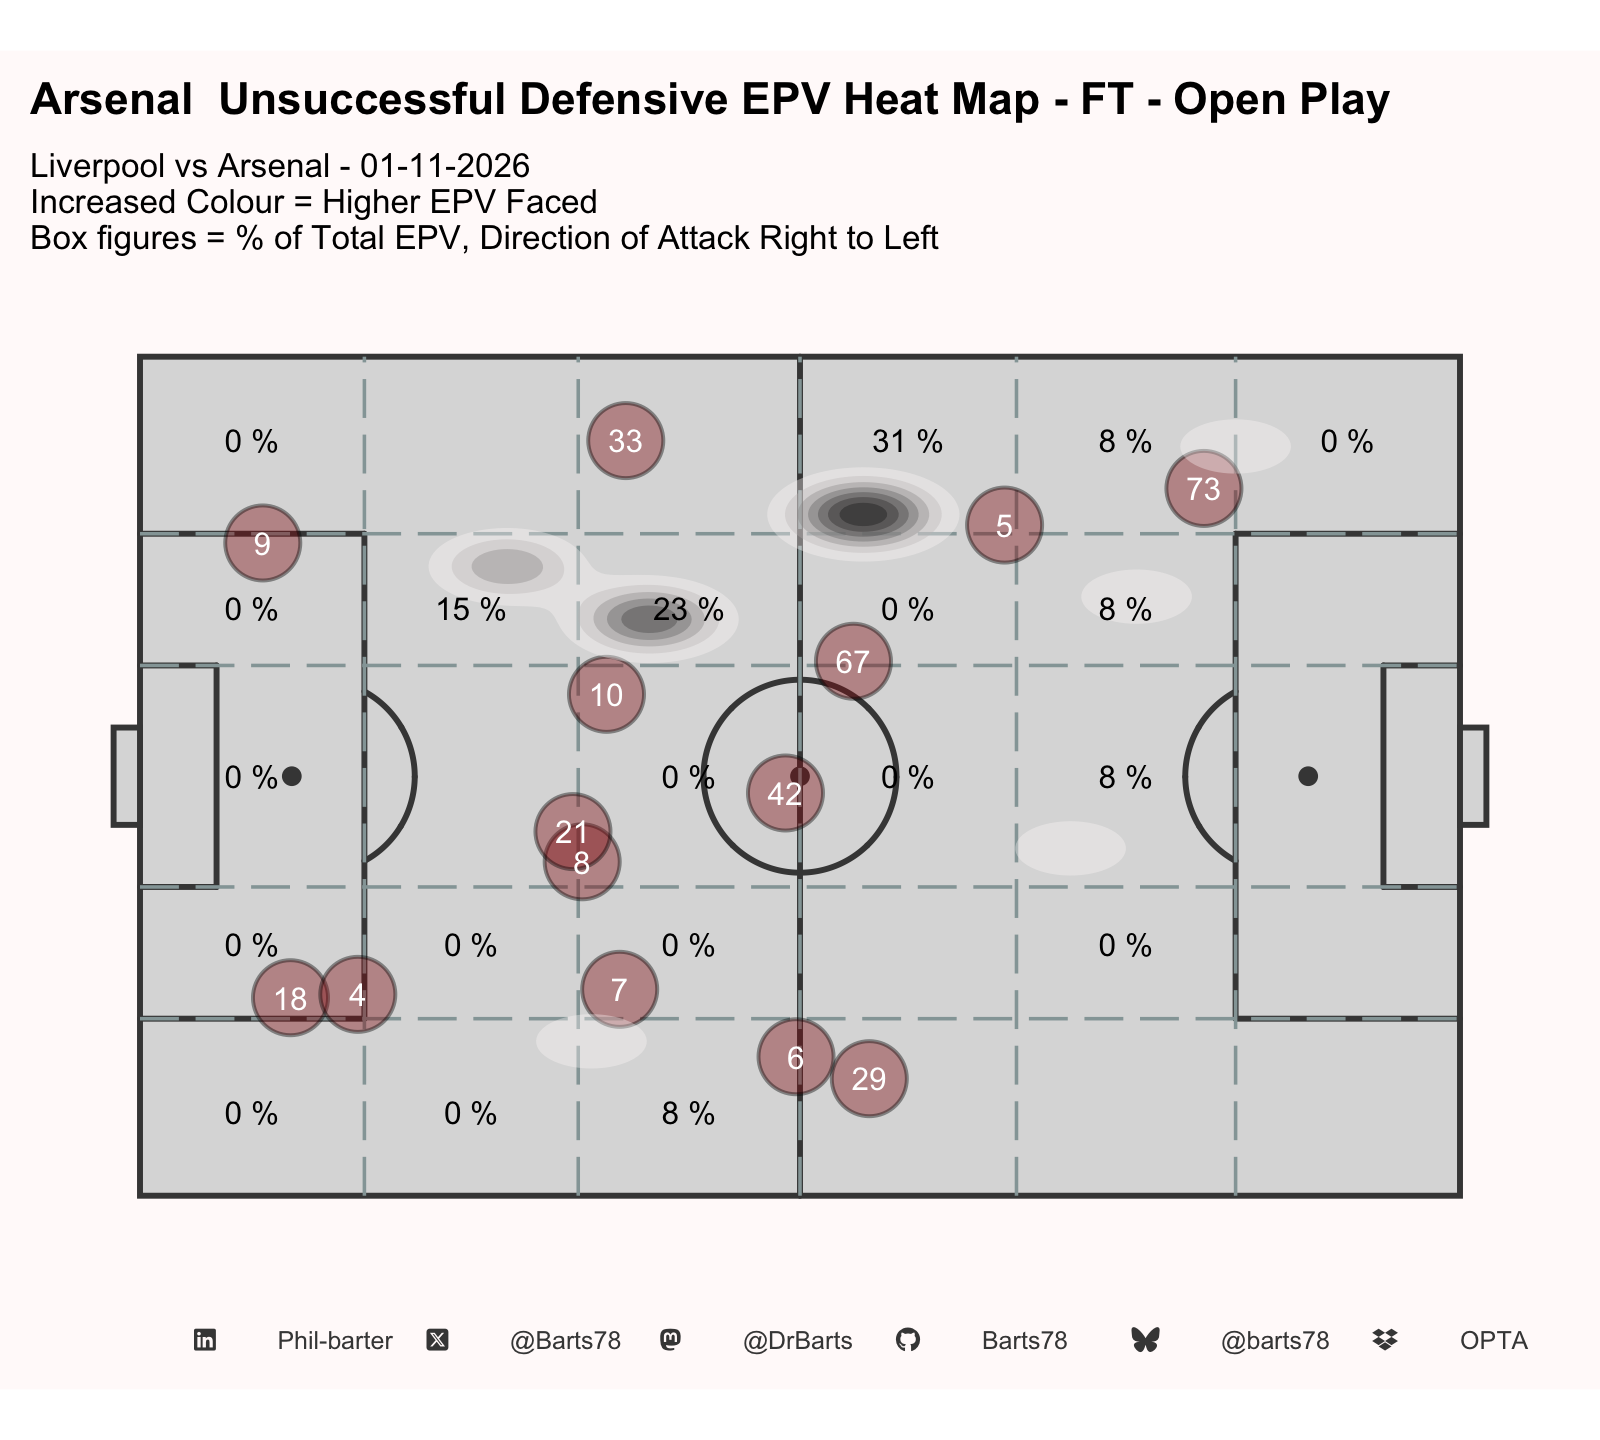
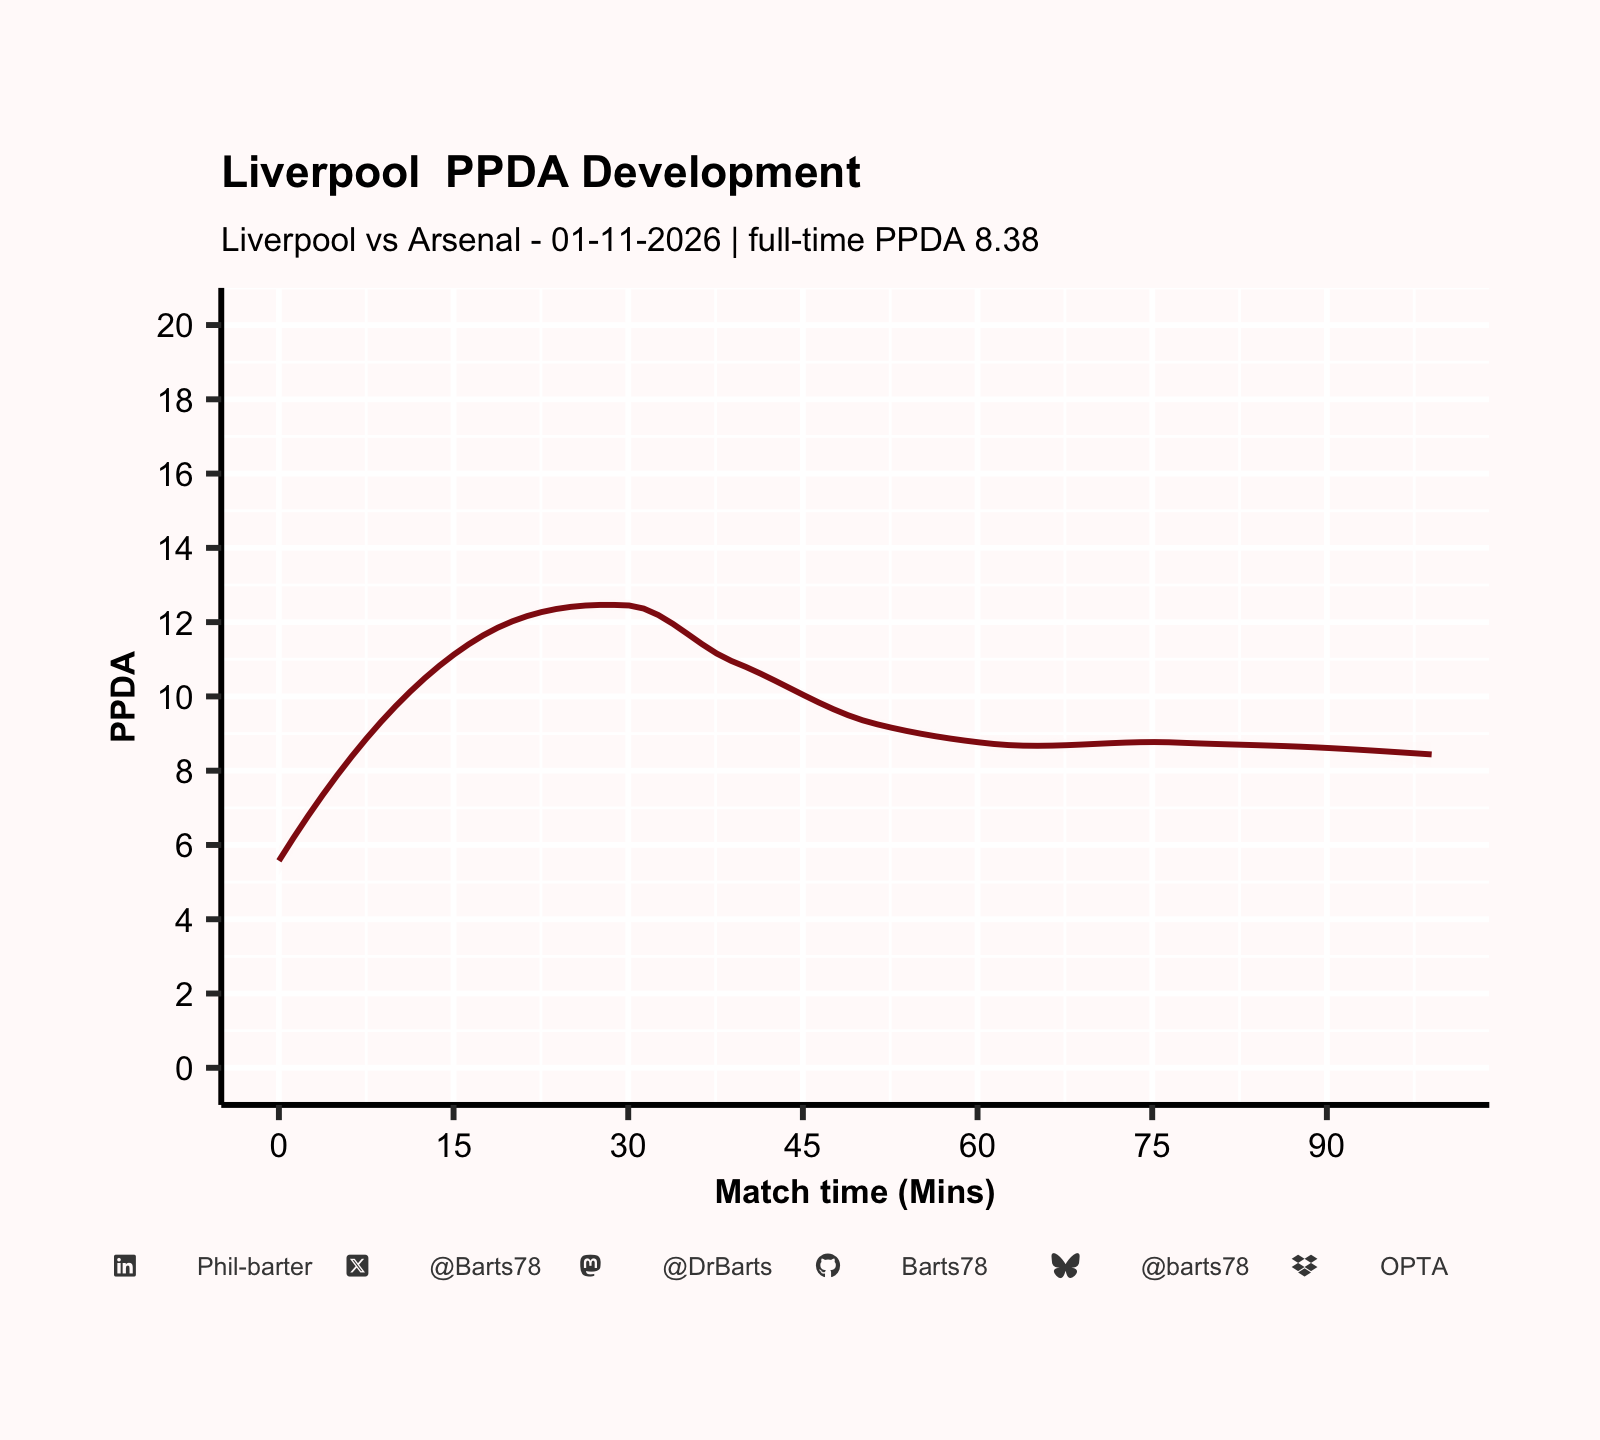
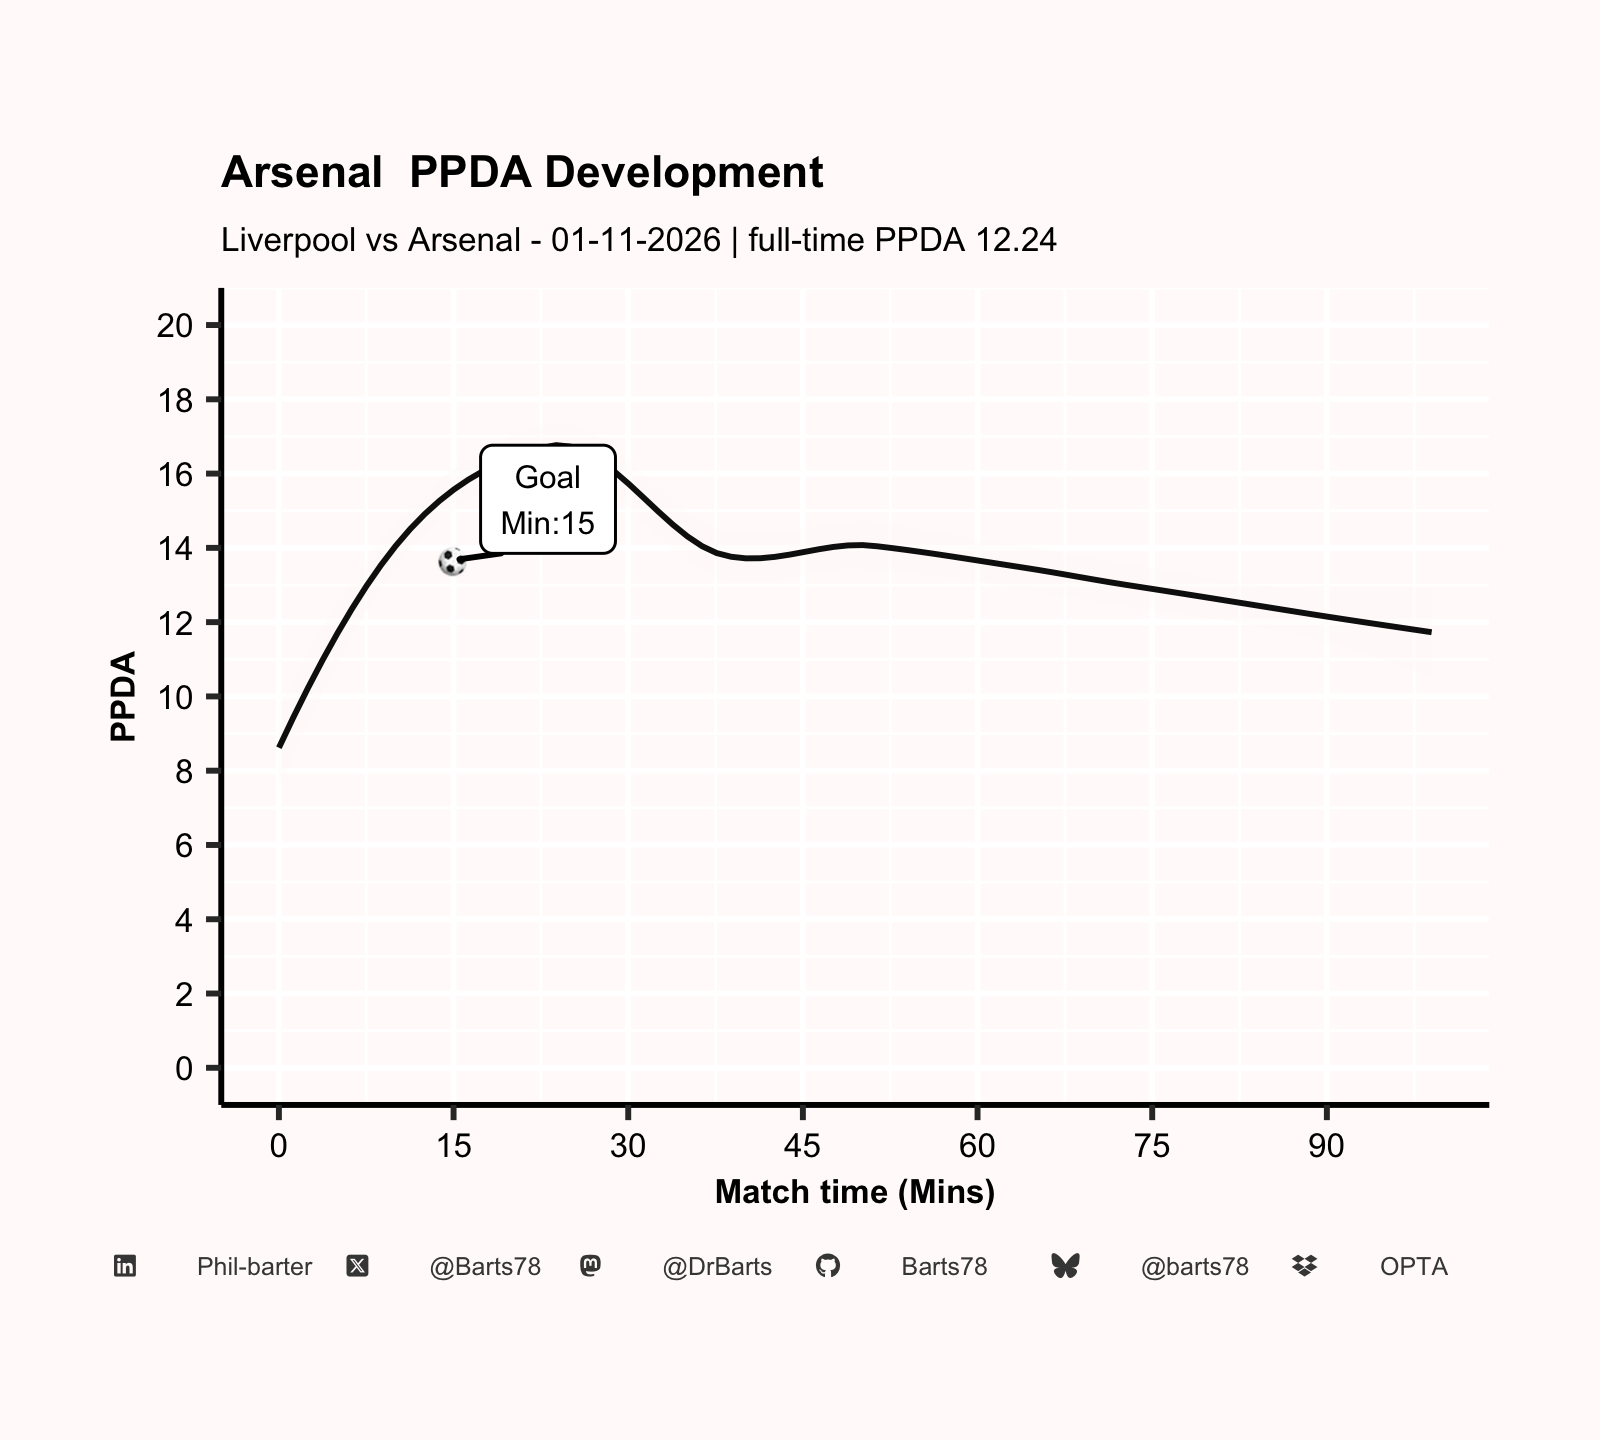
| PPDA - Opposition Passes in Their Own 60% per Defensive Action | ||||||
| Liverpool vs Arsenal - 01-11-2026 | for comparison, simple PPDA (all passes / all defensive actions): Liverpool 3.07, Arsenal 3.74 | ||||||
Liverpool
|
Arsenal
|
|||||
|---|---|---|---|---|---|---|
| Opp. passes | Def. actions | PPDA | Opp. passes | Def. actions | PPDA | |
| Full Time | 268 | 32 | 8.38 | 257 | 21 | 12.24 |
| 1st Half | 128 | 14 | 9.14 | 117 | 9 | 13.00 |
| 2nd Half | 140 | 18 | 7.78 | 140 | 12 | 11.67 |
| 1st Quarter | 75 | 6 | 12.50 | 73 | 5 | 14.60 |
| 2nd Quarter | 53 | 8 | 6.62 | 44 | 4 | 11.00 |
| 3rd Quarter | 83 | 9 | 9.22 | 87 | 8 | 10.88 |
| 4th Quarter | 57 | 9 | 6.33 | 53 | 4 | 13.25 |
| Lower PPDA = more intense pressing. Defensive actions = tackles, interceptions, challenges and fouls committed in the defending team's attacking 60% of the pitch. | ||||||
| X @Barts78 · Bluesky @barts78 · Mastodon @DrBarts · GitHub Barts78 · LinkedIn Phil-barter · Data: Opta | ||||||
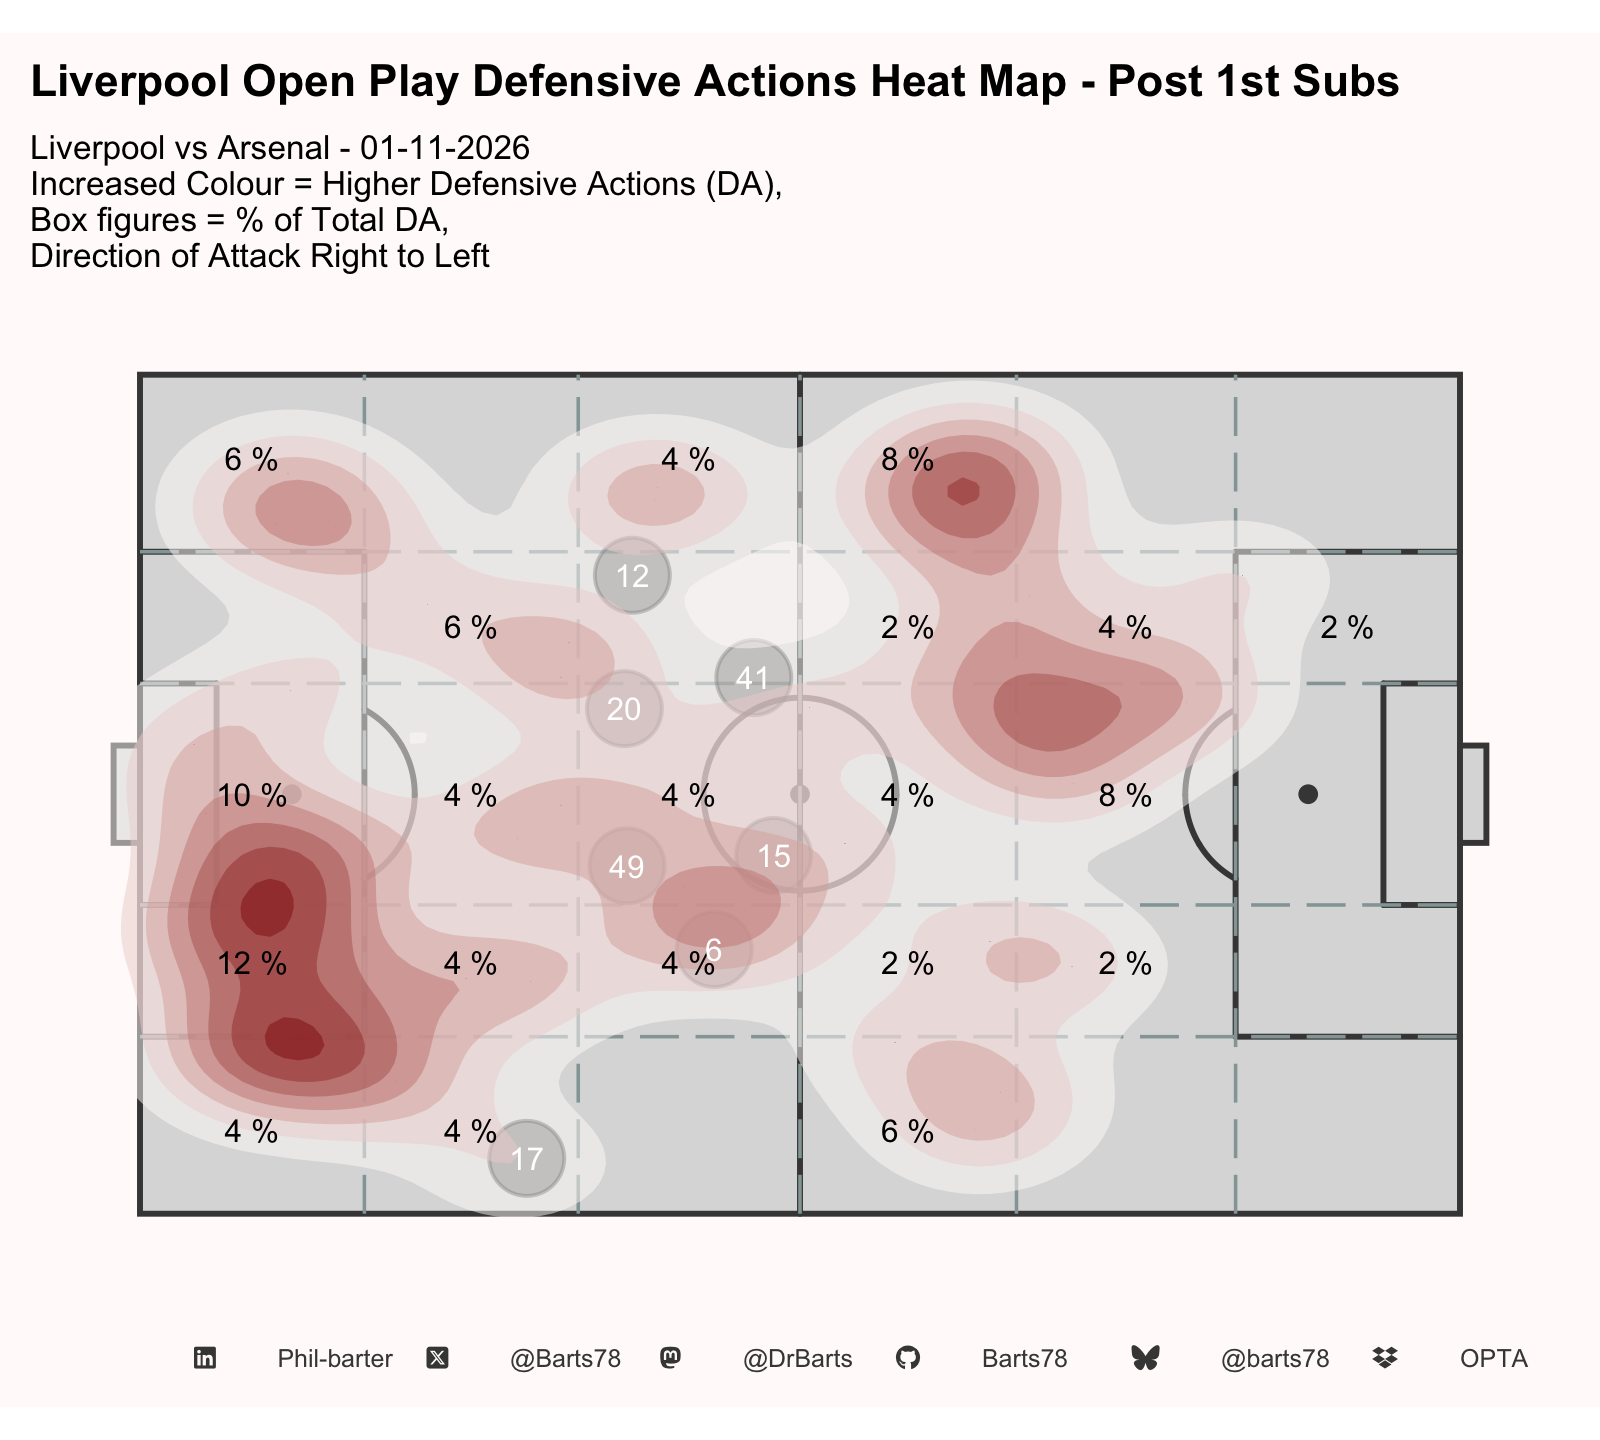
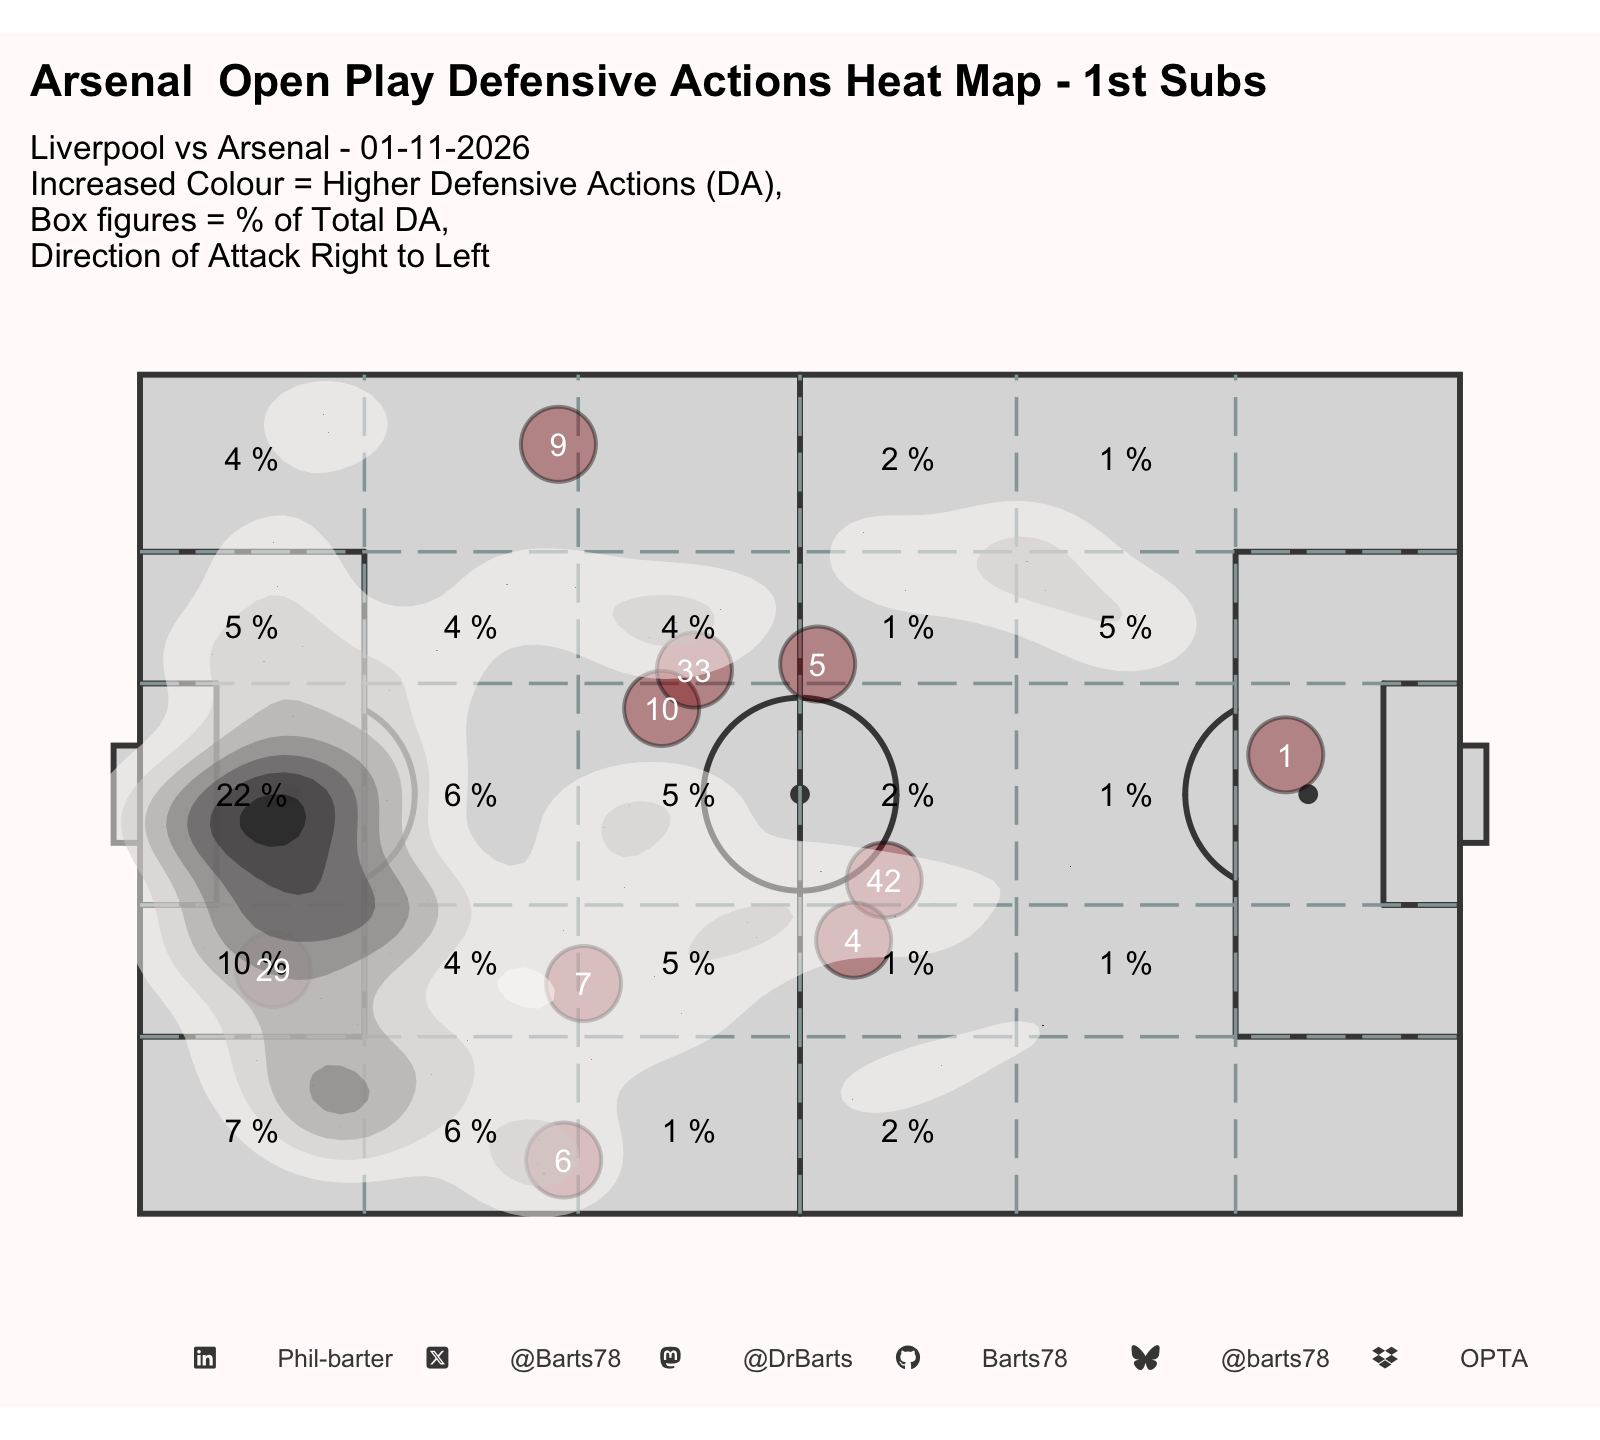
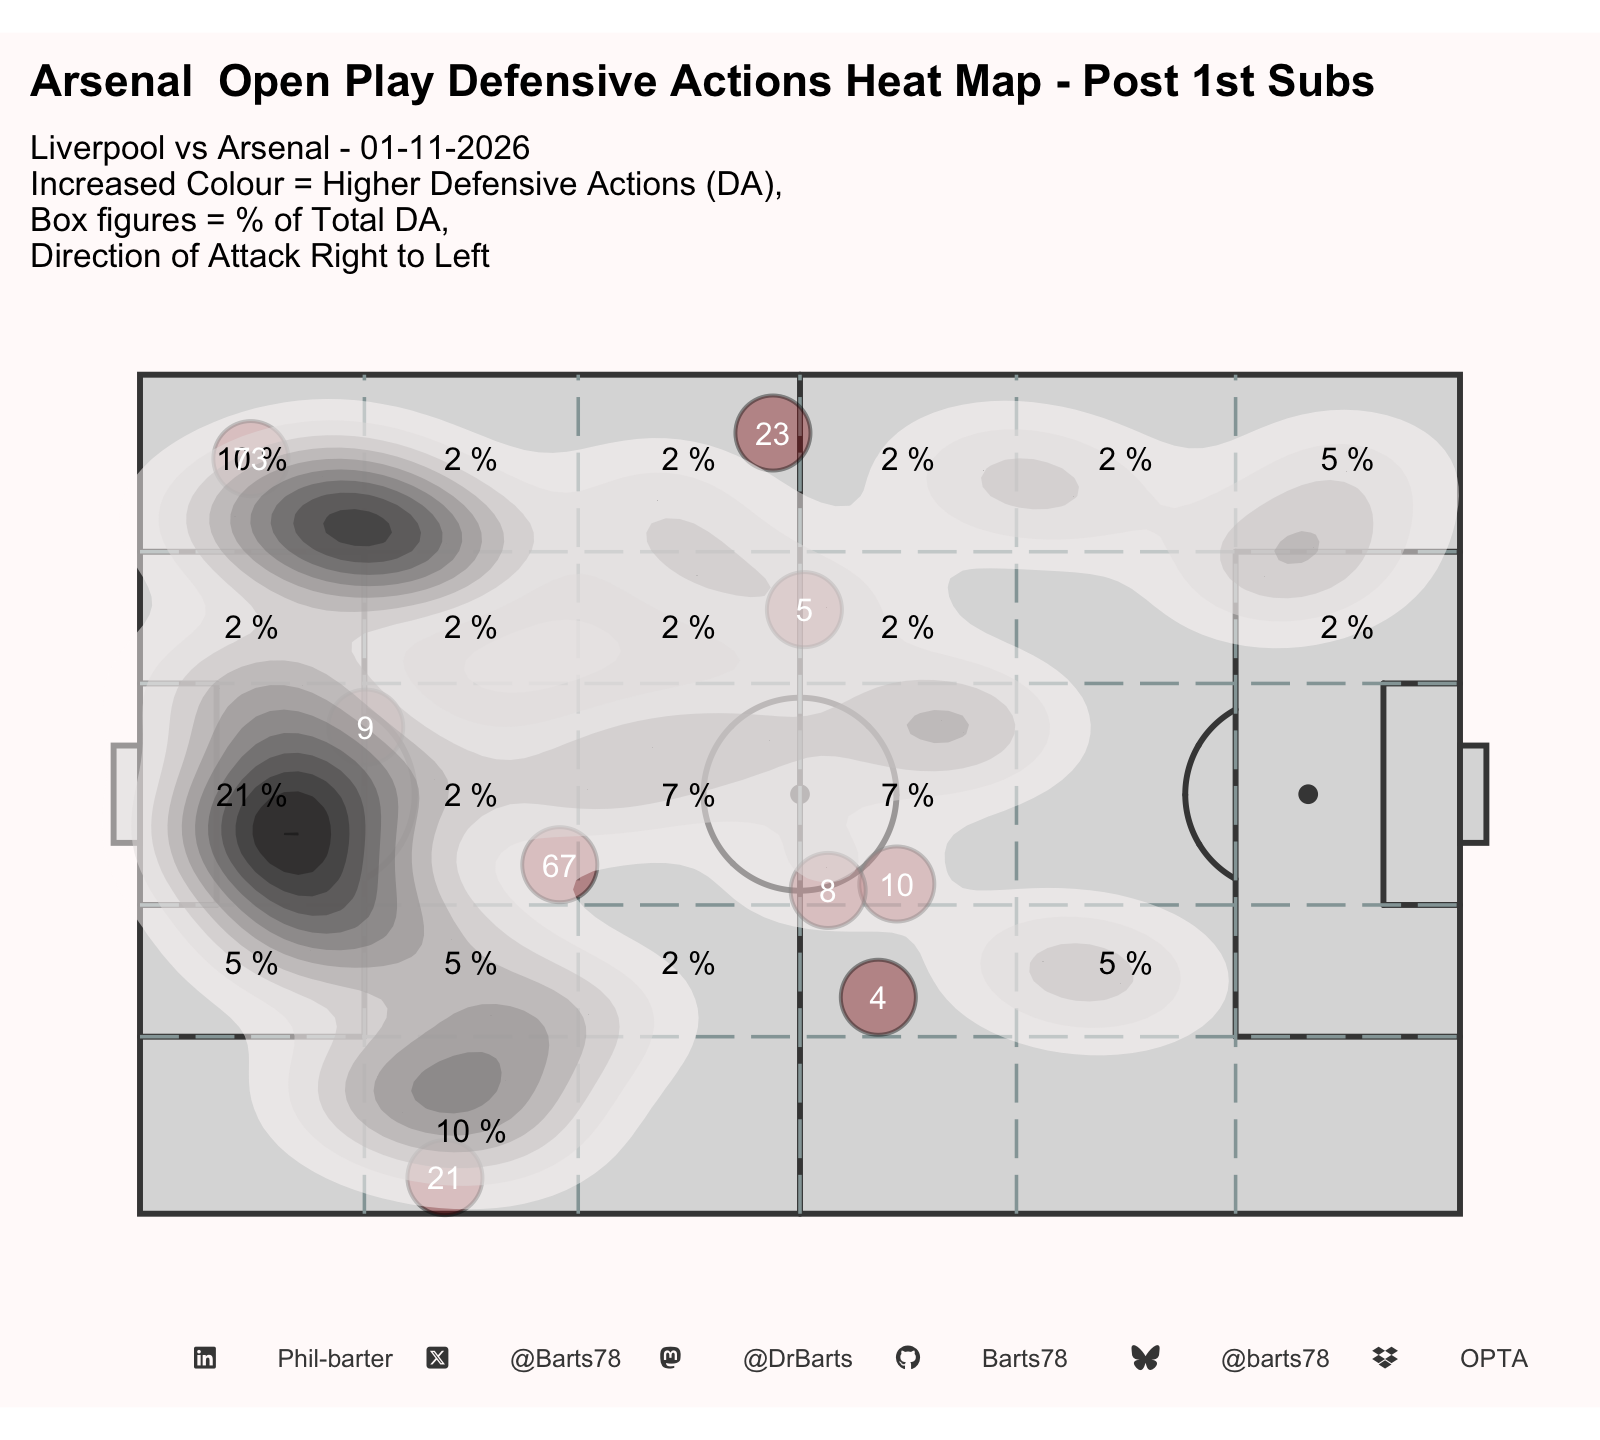
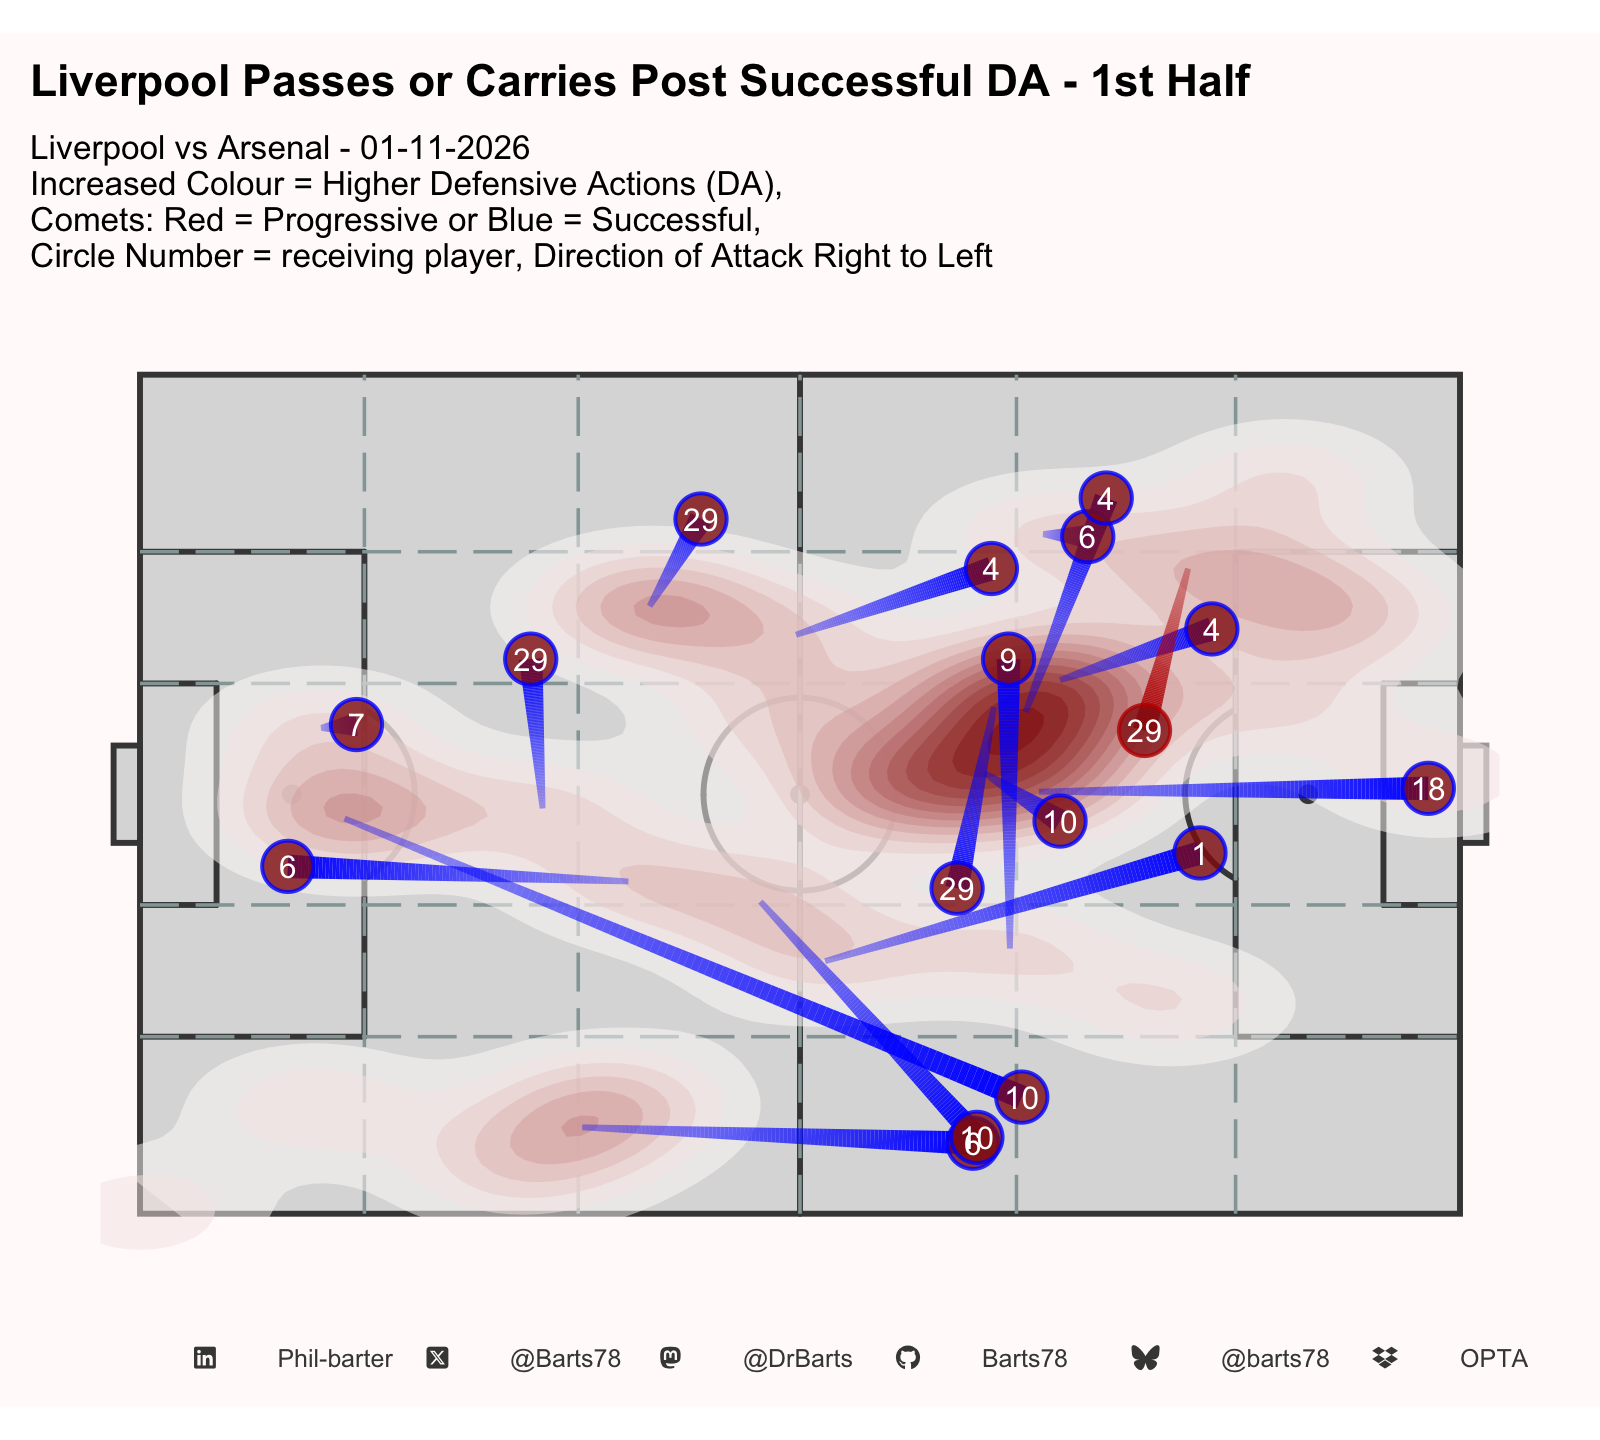
| Possession Gained Post Defensive Action - Thirds Breakdown | |||
| Liverpool vs Arsenal - 01-11-2026 | |||
| Total DAs | % Defensive Third | % Middle Third | % Attacking Third |
|---|---|---|---|
| First Half | |||
| 34 | 21 | 41 | 38 |
| Second Half | |||
| 19 | 32 | 47 | 21 |
| X @Barts78 · Bluesky @barts78 · Mastodon @DrBarts · GitHub Barts78 · LinkedIn Phil-barter · Data: Opta | |||
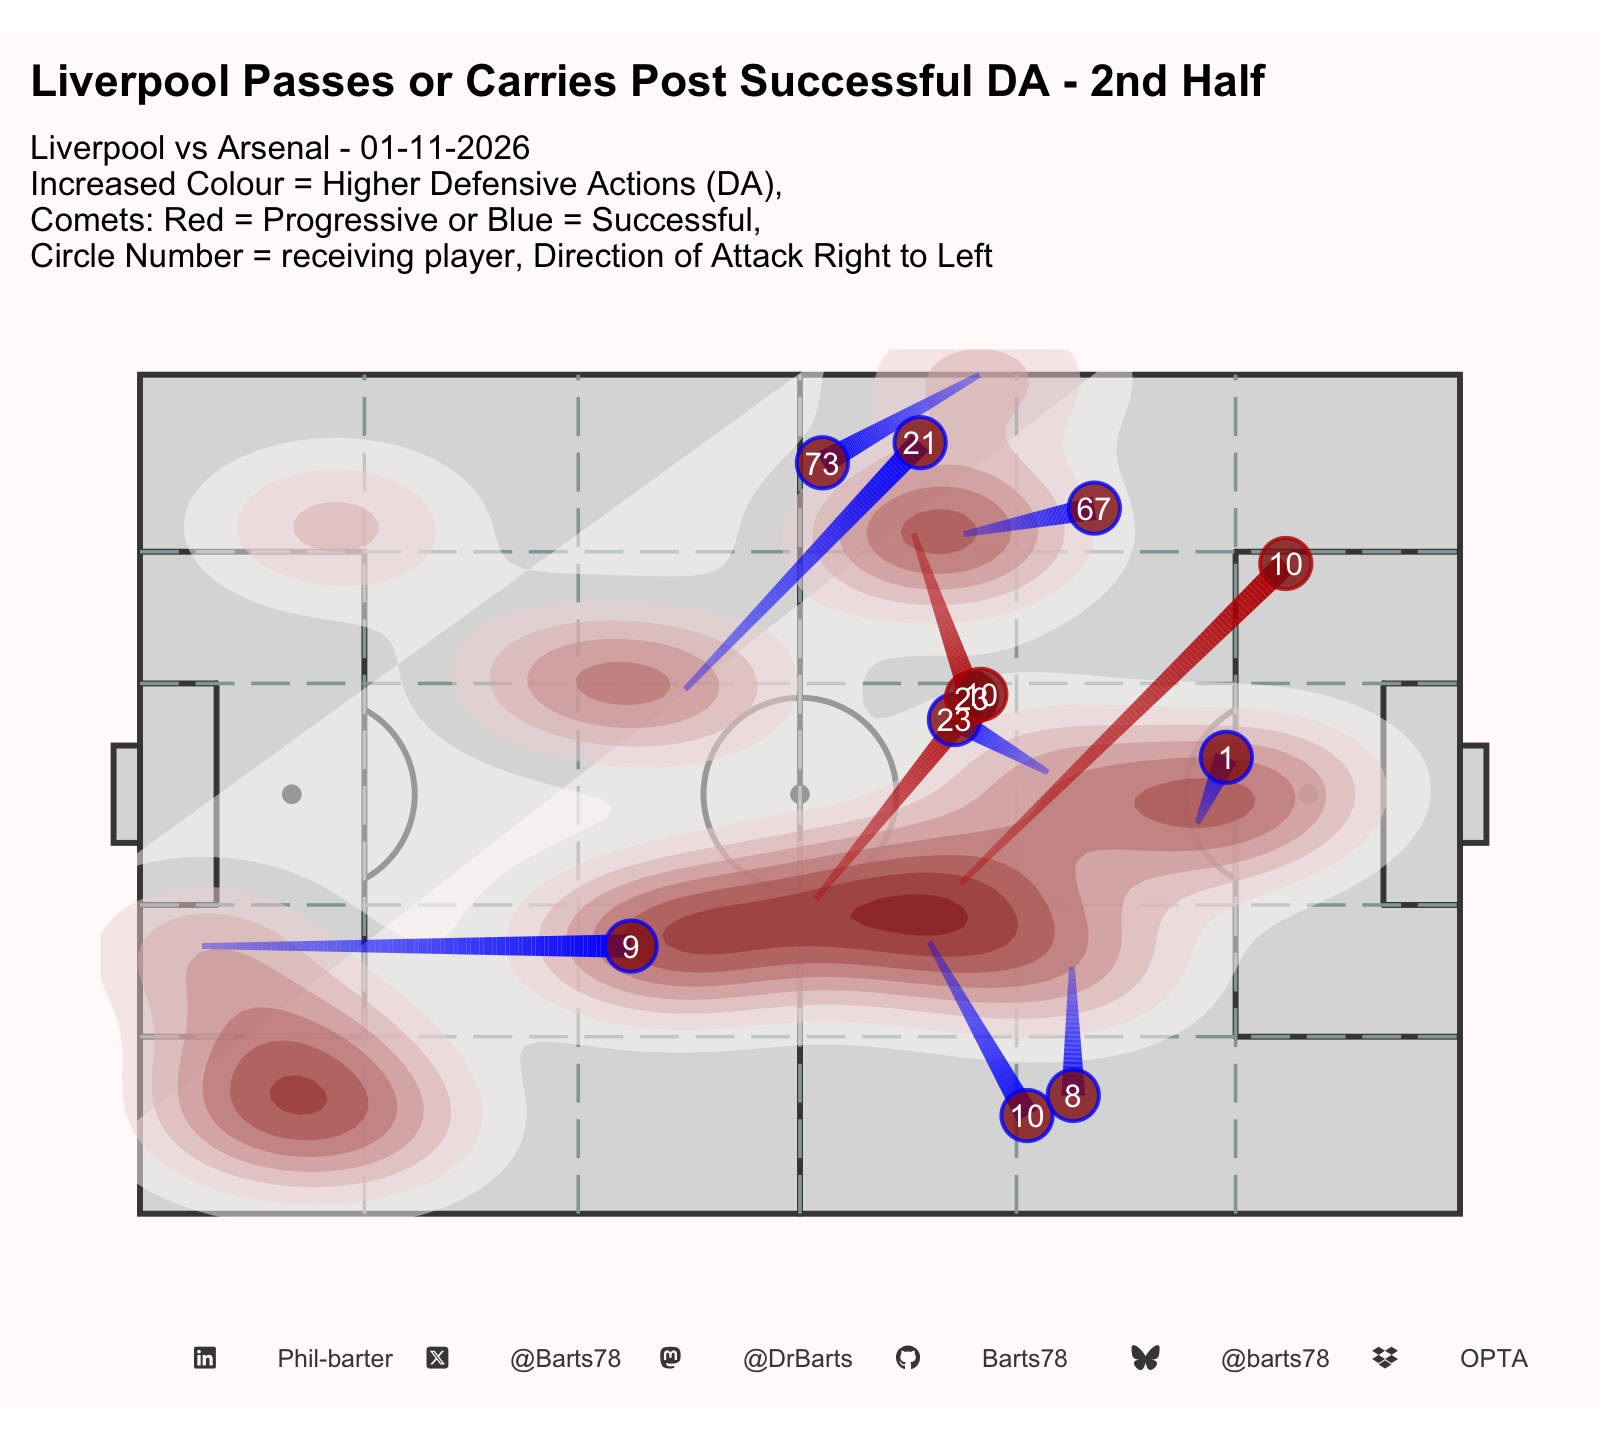
| Possession Gained Post Defensive Action - Thirds Breakdown | |||
| Liverpool vs Arsenal - 01-11-2026 | |||
| Total DAs | % Defensive Third | % Middle Third | % Attacking Third |
|---|---|---|---|
| First Half | |||
| 34 | 21 | 41 | 38 |
| Second Half | |||
| 19 | 32 | 47 | 21 |
| X @Barts78 · Bluesky @barts78 · Mastodon @DrBarts · GitHub Barts78 · LinkedIn Phil-barter · Data: Opta | |||
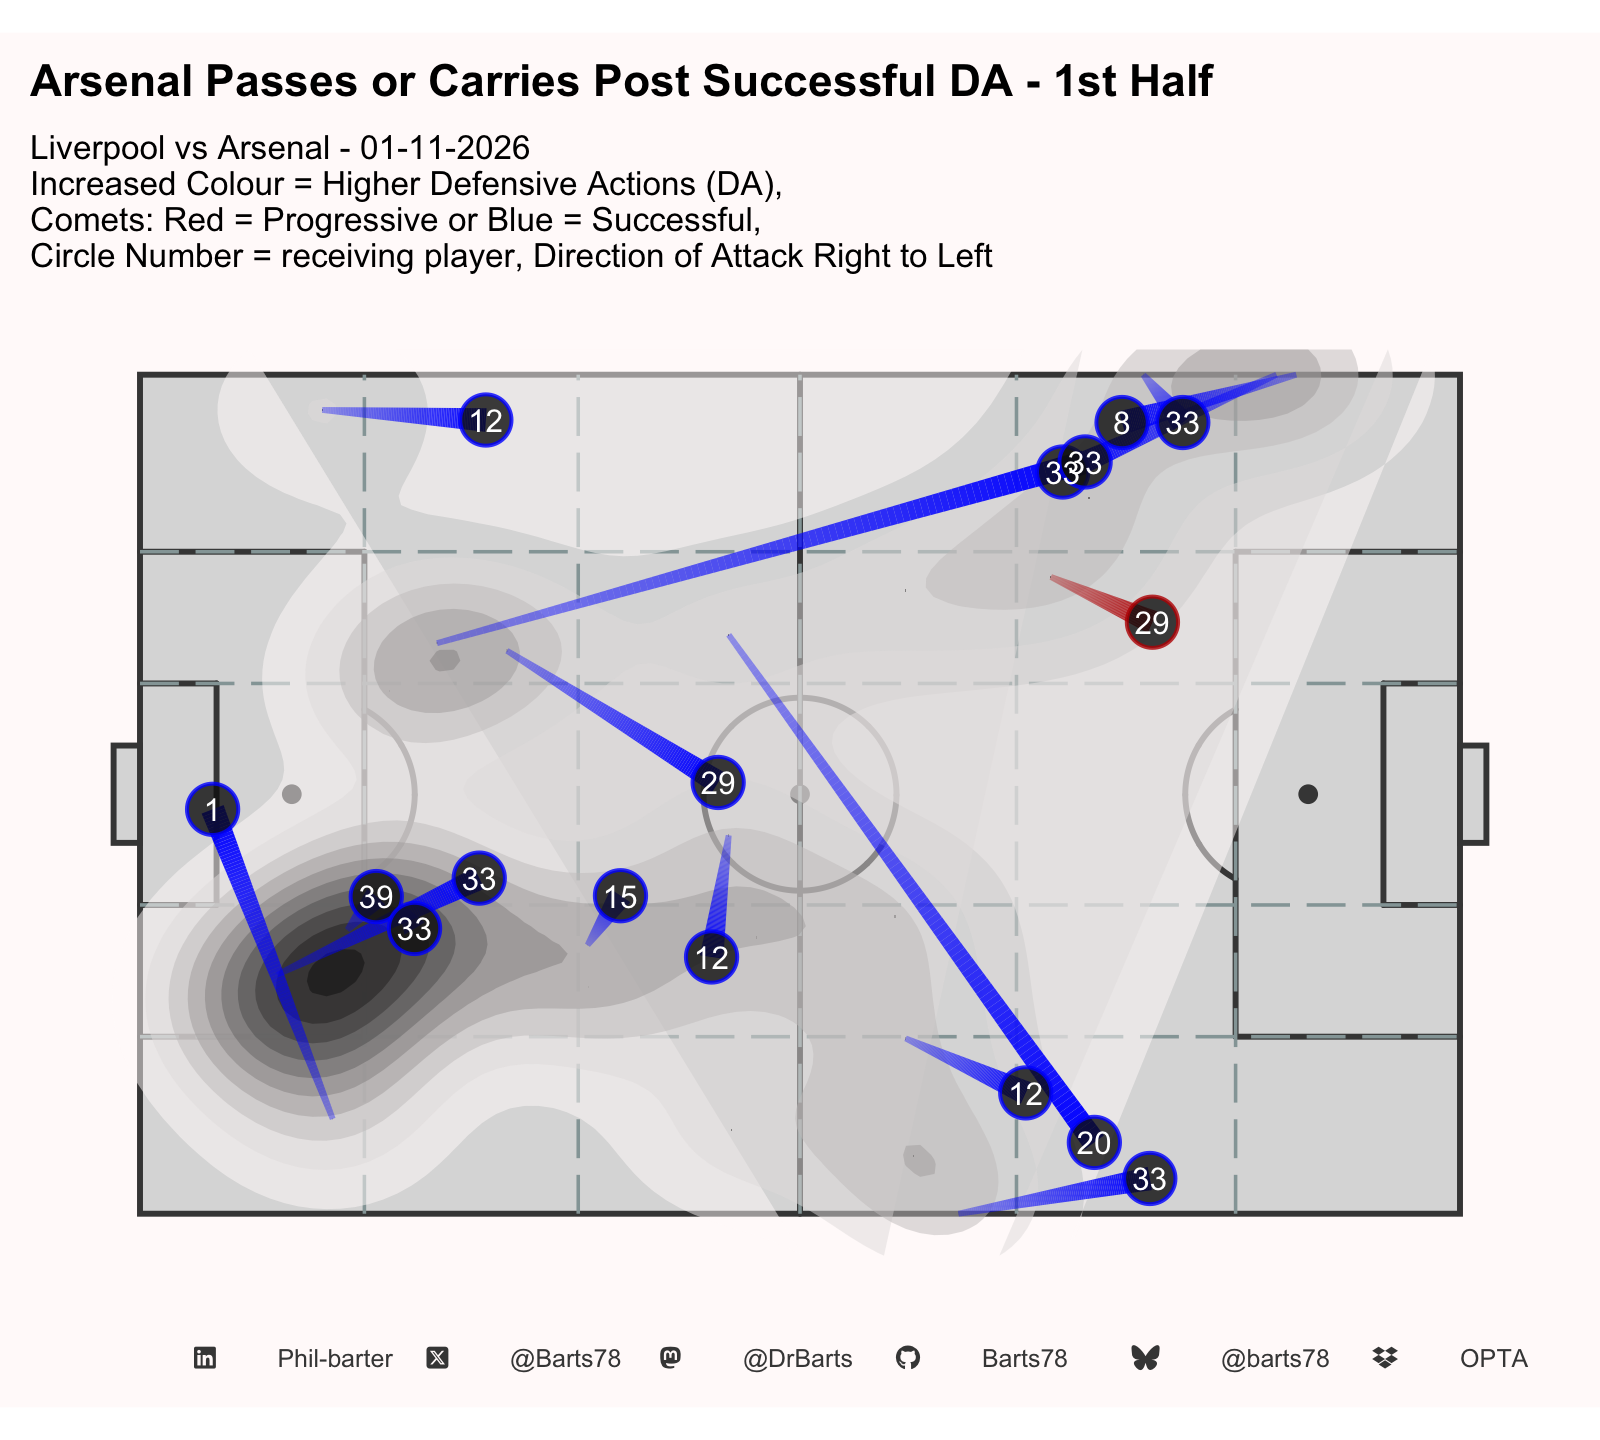
| Possession Gained Post Defensive Action - Thirds Breakdown | |||
| Liverpool vs Arsenal - 01-11-2026 | |||
| Total DAs | % Defensive Third | % Middle Third | % Attacking Third |
|---|---|---|---|
| First Half | |||
| 28 | 43 | 39 | 18 |
| Second Half | |||
| 39 | 56 | 28 | 15 |
| X @Barts78 · Bluesky @barts78 · Mastodon @DrBarts · GitHub Barts78 · LinkedIn Phil-barter · Data: Opta | |||
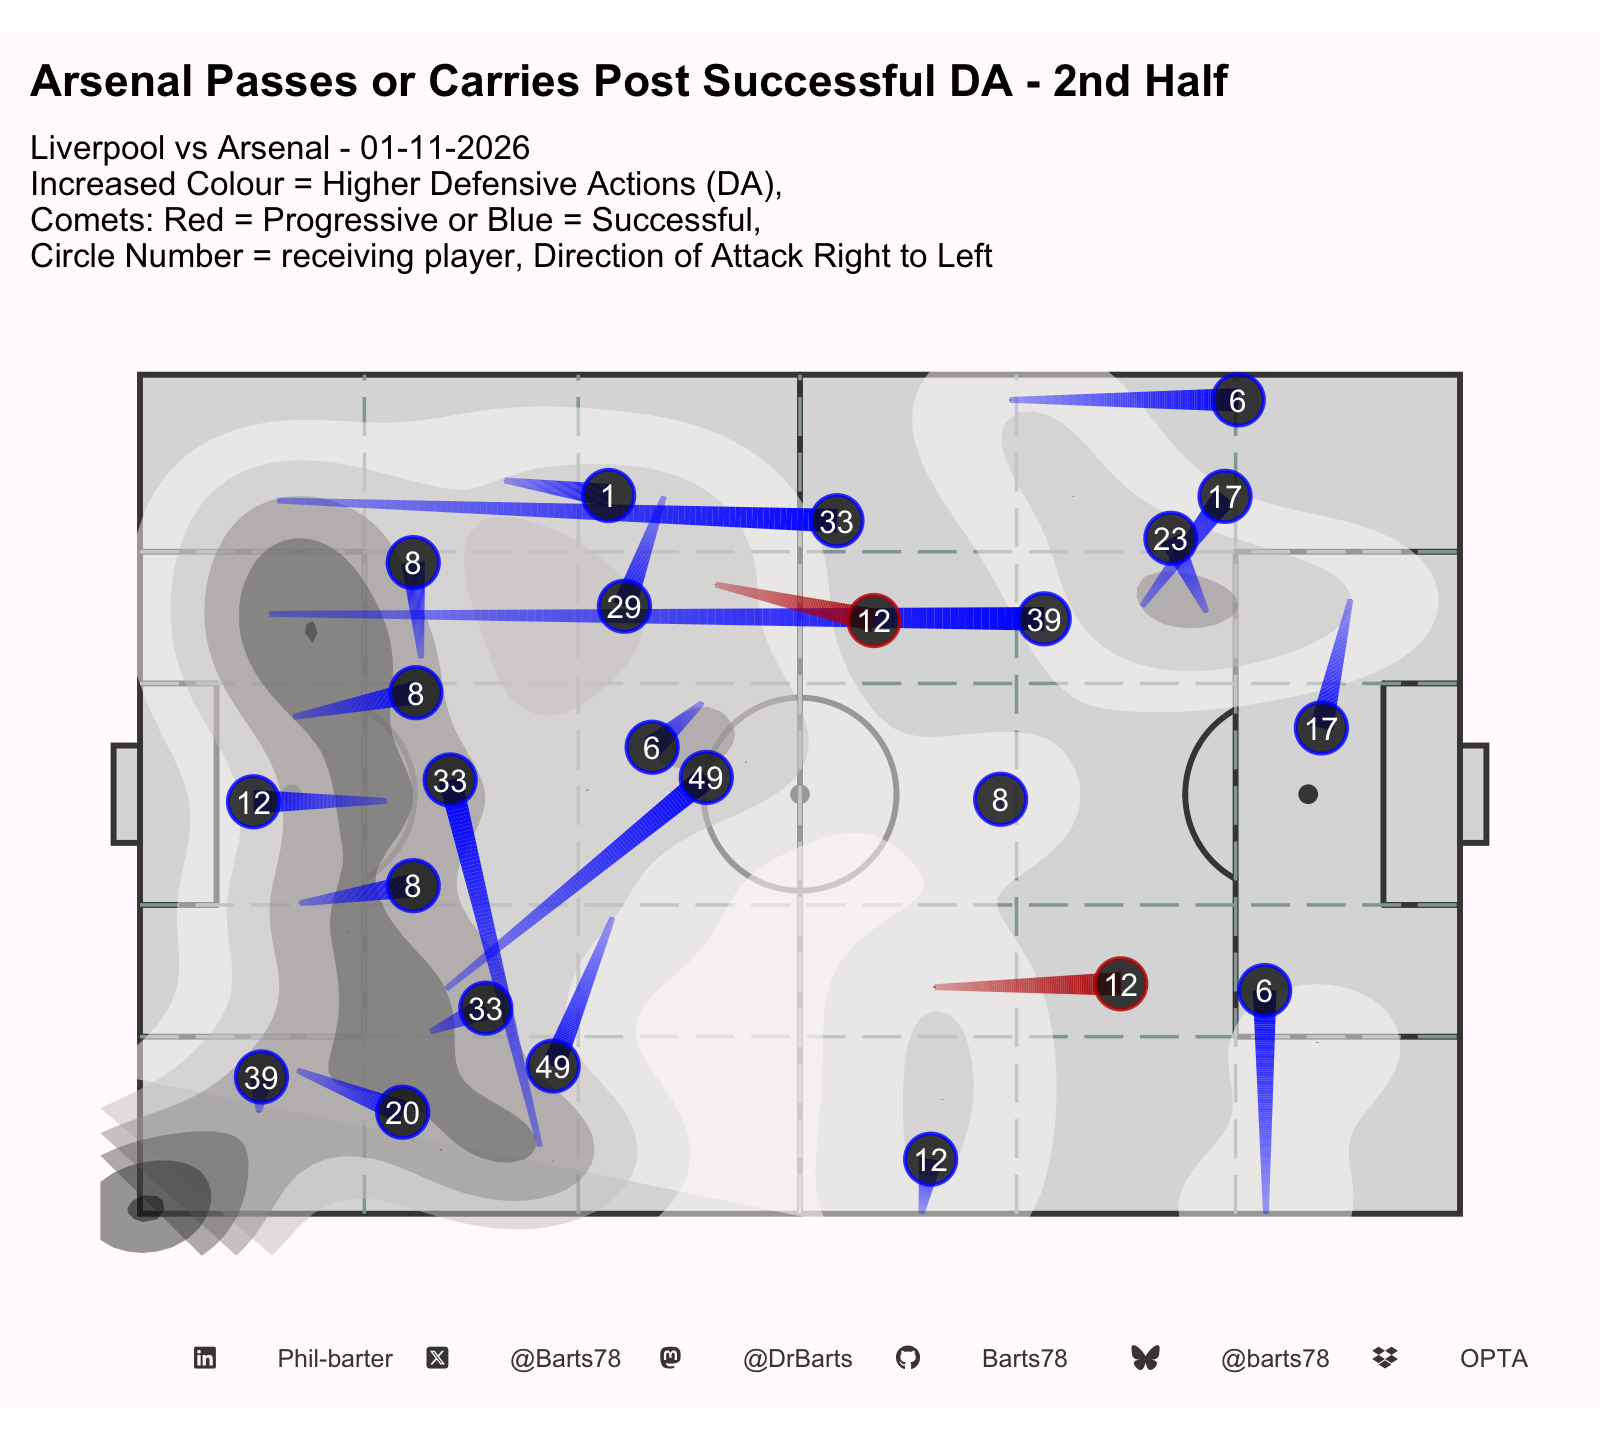
| Possession Gained Post Defensive Action - Thirds Breakdown | |||
| Liverpool vs Arsenal - 01-11-2026 | |||
| Total DAs | % Defensive Third | % Middle Third | % Attacking Third |
|---|---|---|---|
| First Half | |||
| 28 | 43 | 39 | 18 |
| Second Half | |||
| 39 | 56 | 28 | 15 |
| X @Barts78 · Bluesky @barts78 · Mastodon @DrBarts · GitHub Barts78 · LinkedIn Phil-barter · Data: Opta | |||
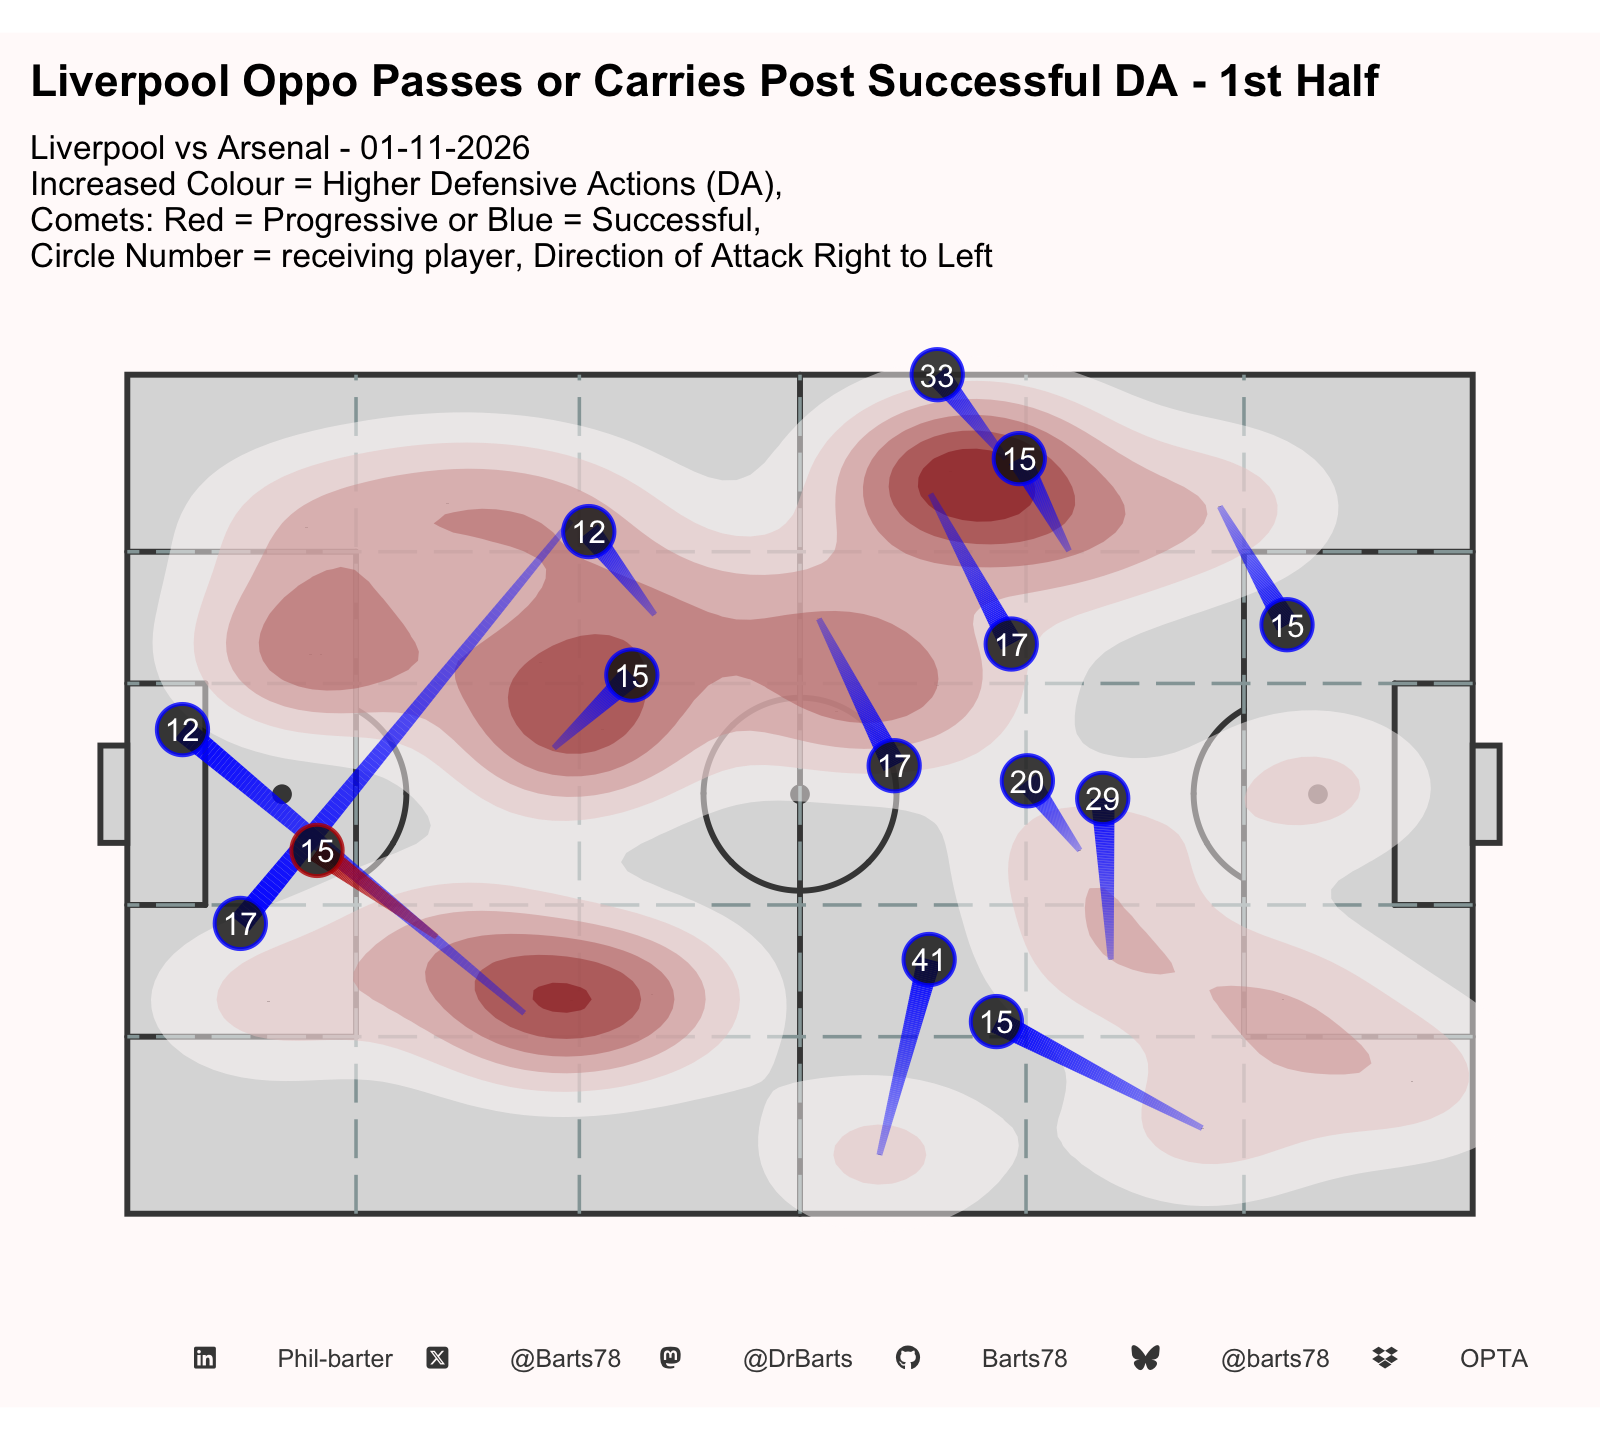
| Possession Lost Post Defensive Action - Thirds Breakdown | |||
| Liverpool vs Arsenal - 01-11-2026 | |||
| Total DAs | % Defensive Third | % Middle Third | % Attacking Third |
|---|---|---|---|
| First Half | |||
| 29 | 28 | 34 | 38 |
| Second Half | |||
| 31 | 42 | 35 | 23 |
| X @Barts78 · Bluesky @barts78 · Mastodon @DrBarts · GitHub Barts78 · LinkedIn Phil-barter · Data: Opta | |||
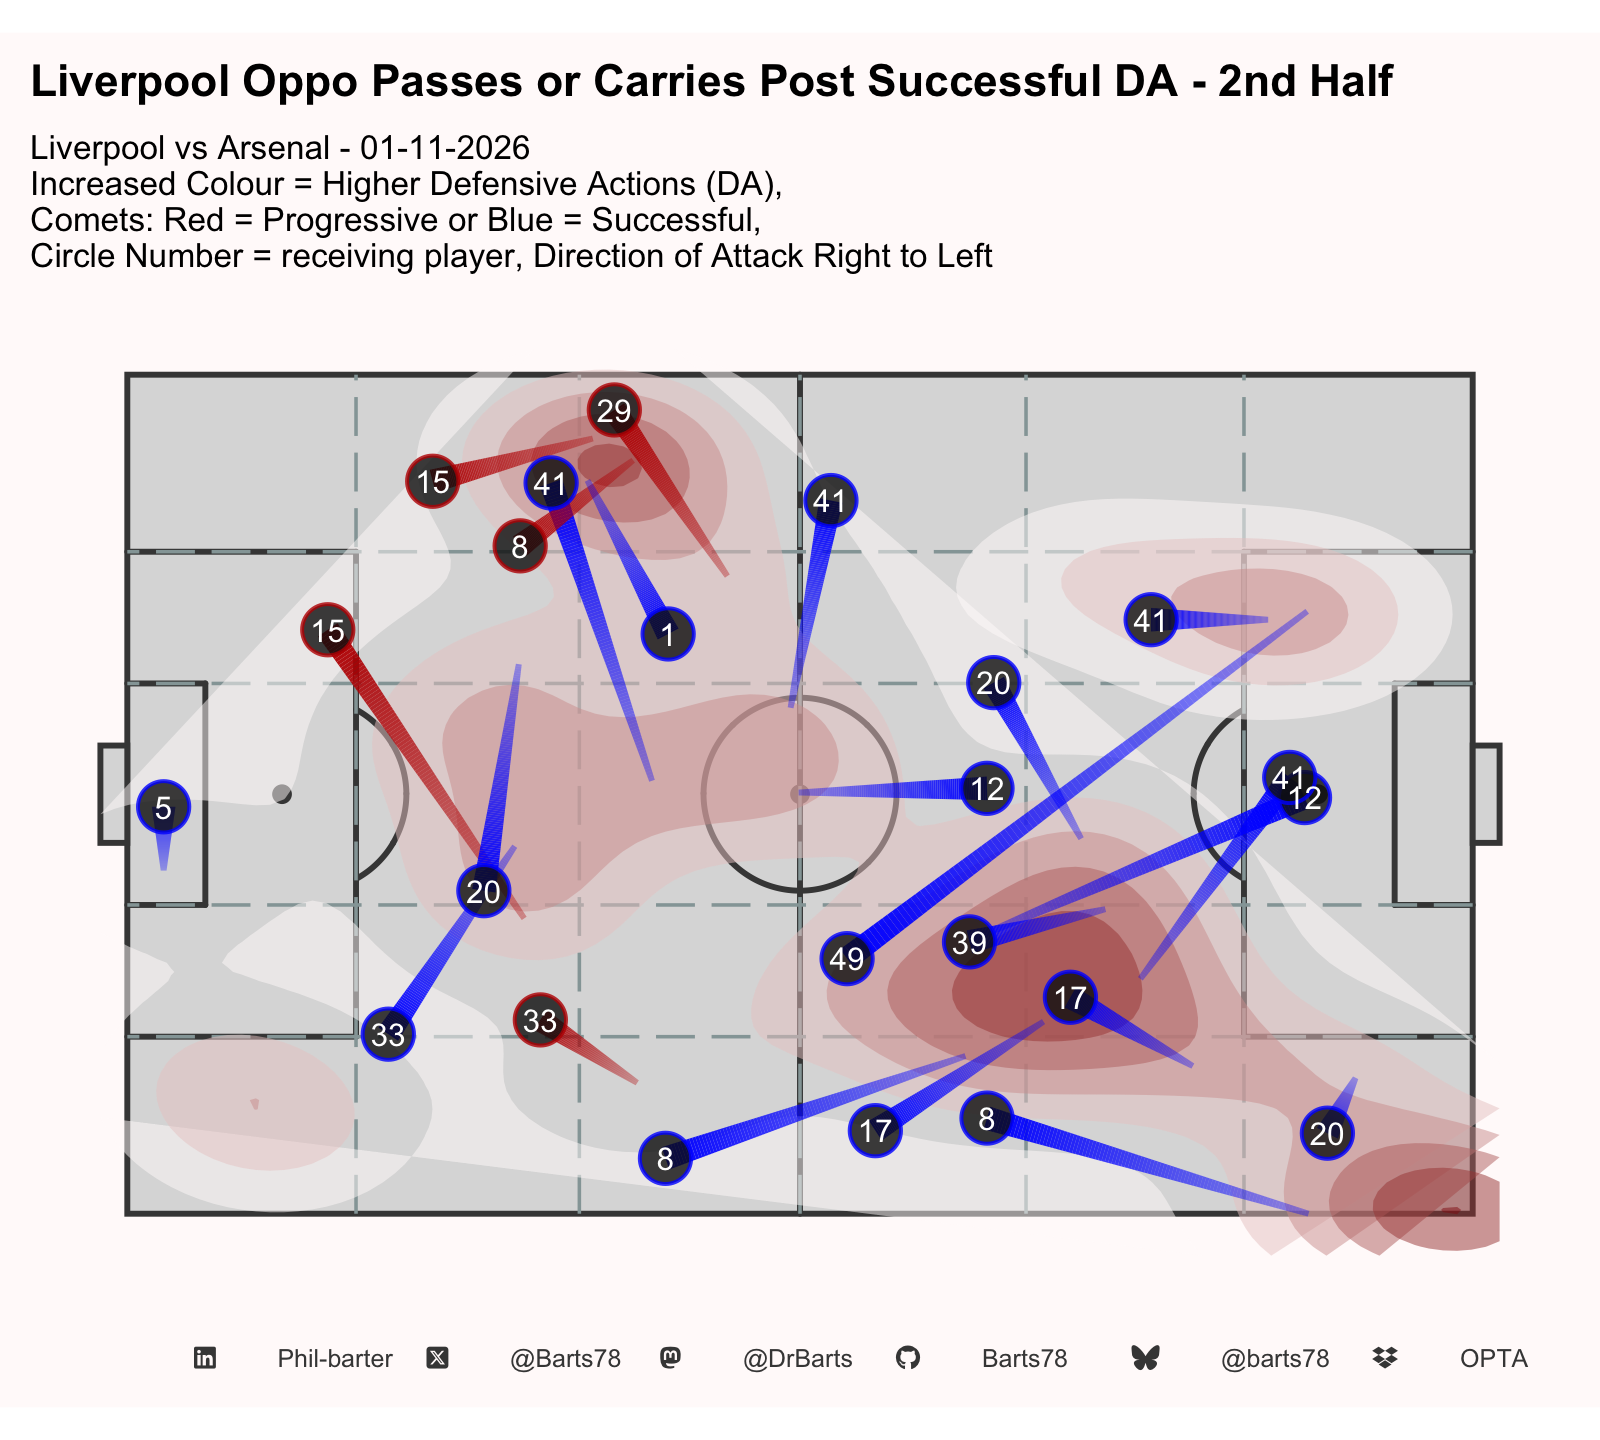
| Possession Lost Post Defensive Action - Thirds Breakdown | |||
| Liverpool vs Arsenal - 01-11-2026 | |||
| Total DAs | % Defensive Third | % Middle Third | % Attacking Third |
|---|---|---|---|
| First Half | |||
| 29 | 28 | 34 | 38 |
| Second Half | |||
| 31 | 42 | 35 | 23 |
| X @Barts78 · Bluesky @barts78 · Mastodon @DrBarts · GitHub Barts78 · LinkedIn Phil-barter · Data: Opta | |||
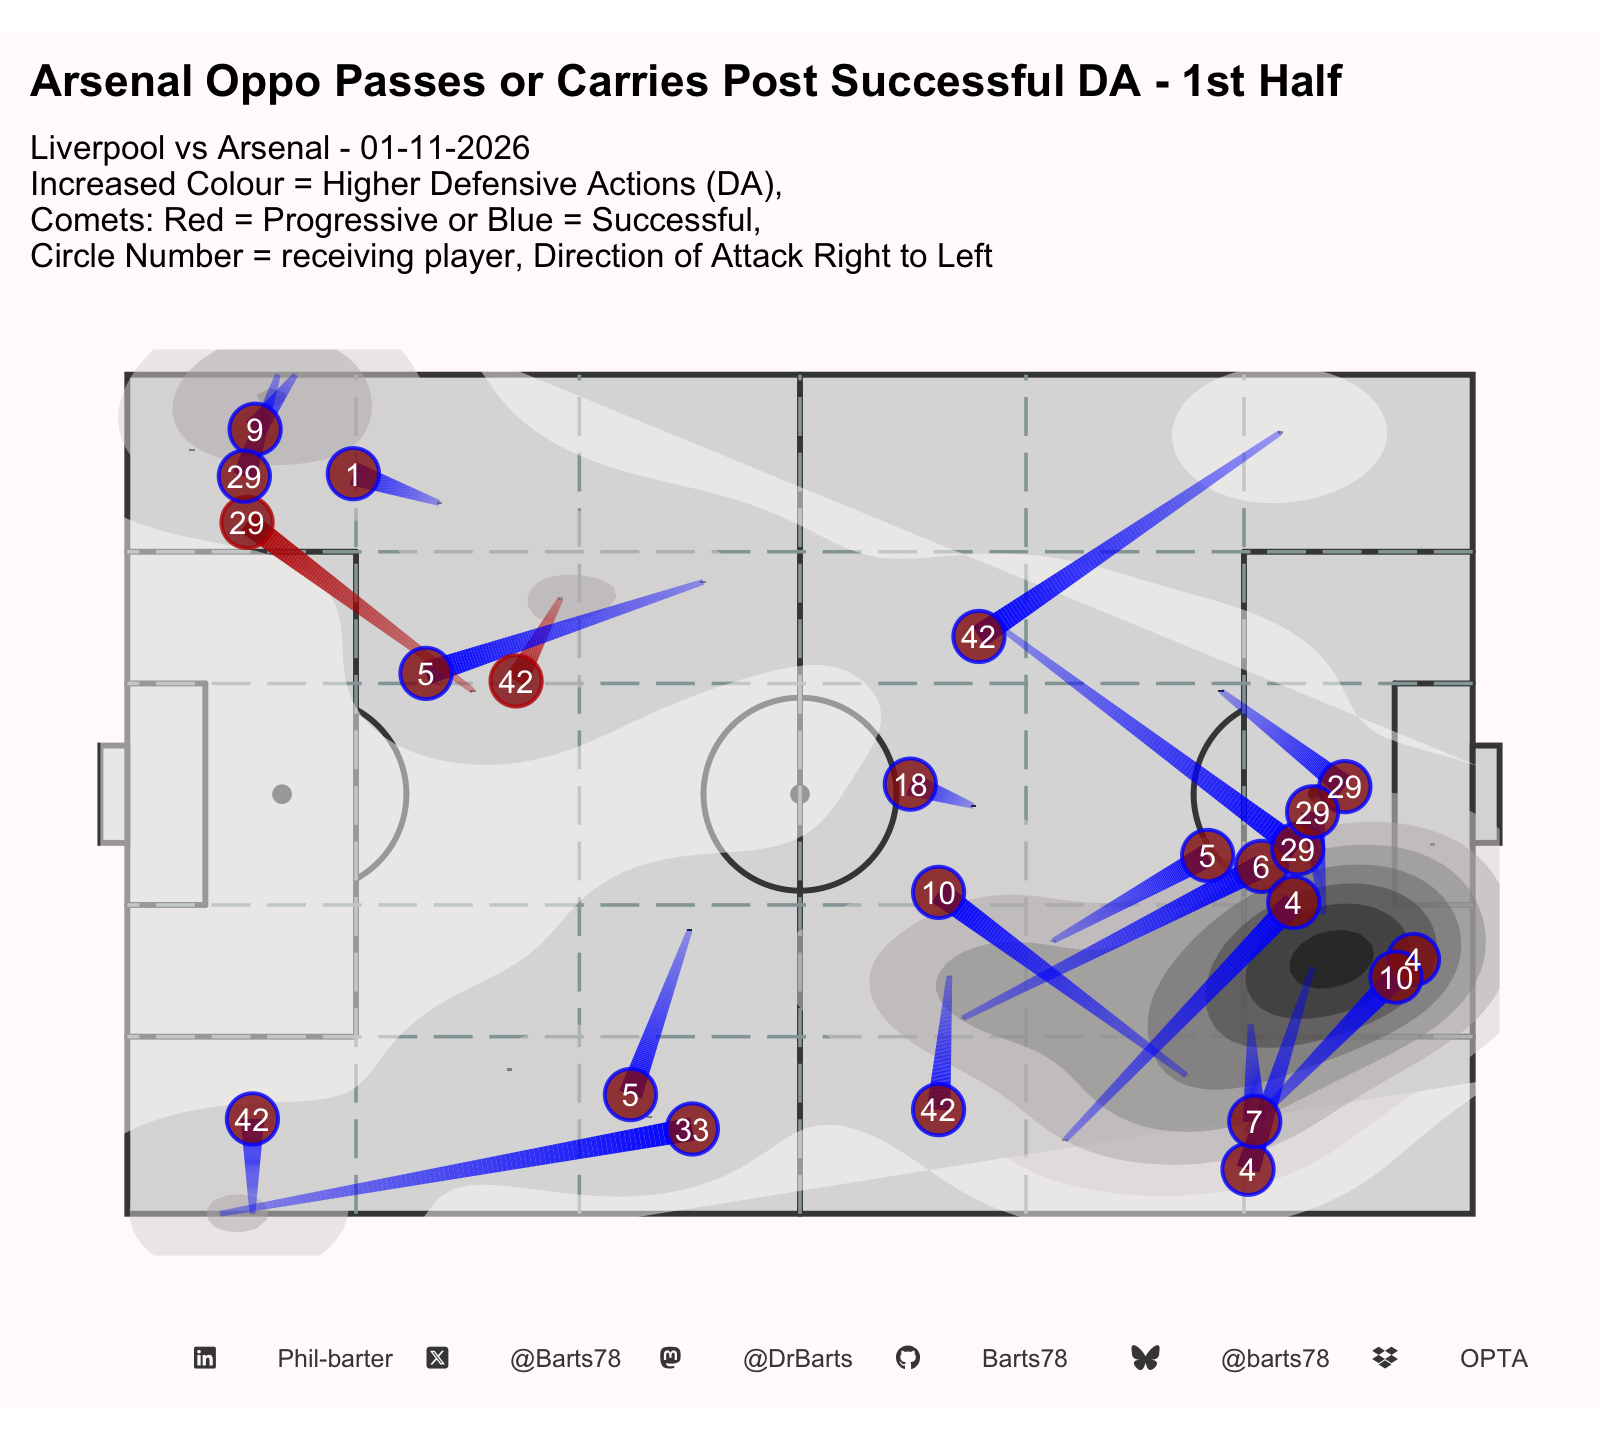
| Possession Lost Post Defensive Action - Thirds Breakdown | |||
| Liverpool vs Arsenal - 01-11-2026 | |||
| Total DAs | % Defensive Third | % Middle Third | % Attacking Third |
|---|---|---|---|
| First Half | |||
| 29 | 45 | 24 | 31 |
| Second Half | |||
| 31 | 39 | 39 | 23 |
| X @Barts78 · Bluesky @barts78 · Mastodon @DrBarts · GitHub Barts78 · LinkedIn Phil-barter · Data: Opta | |||
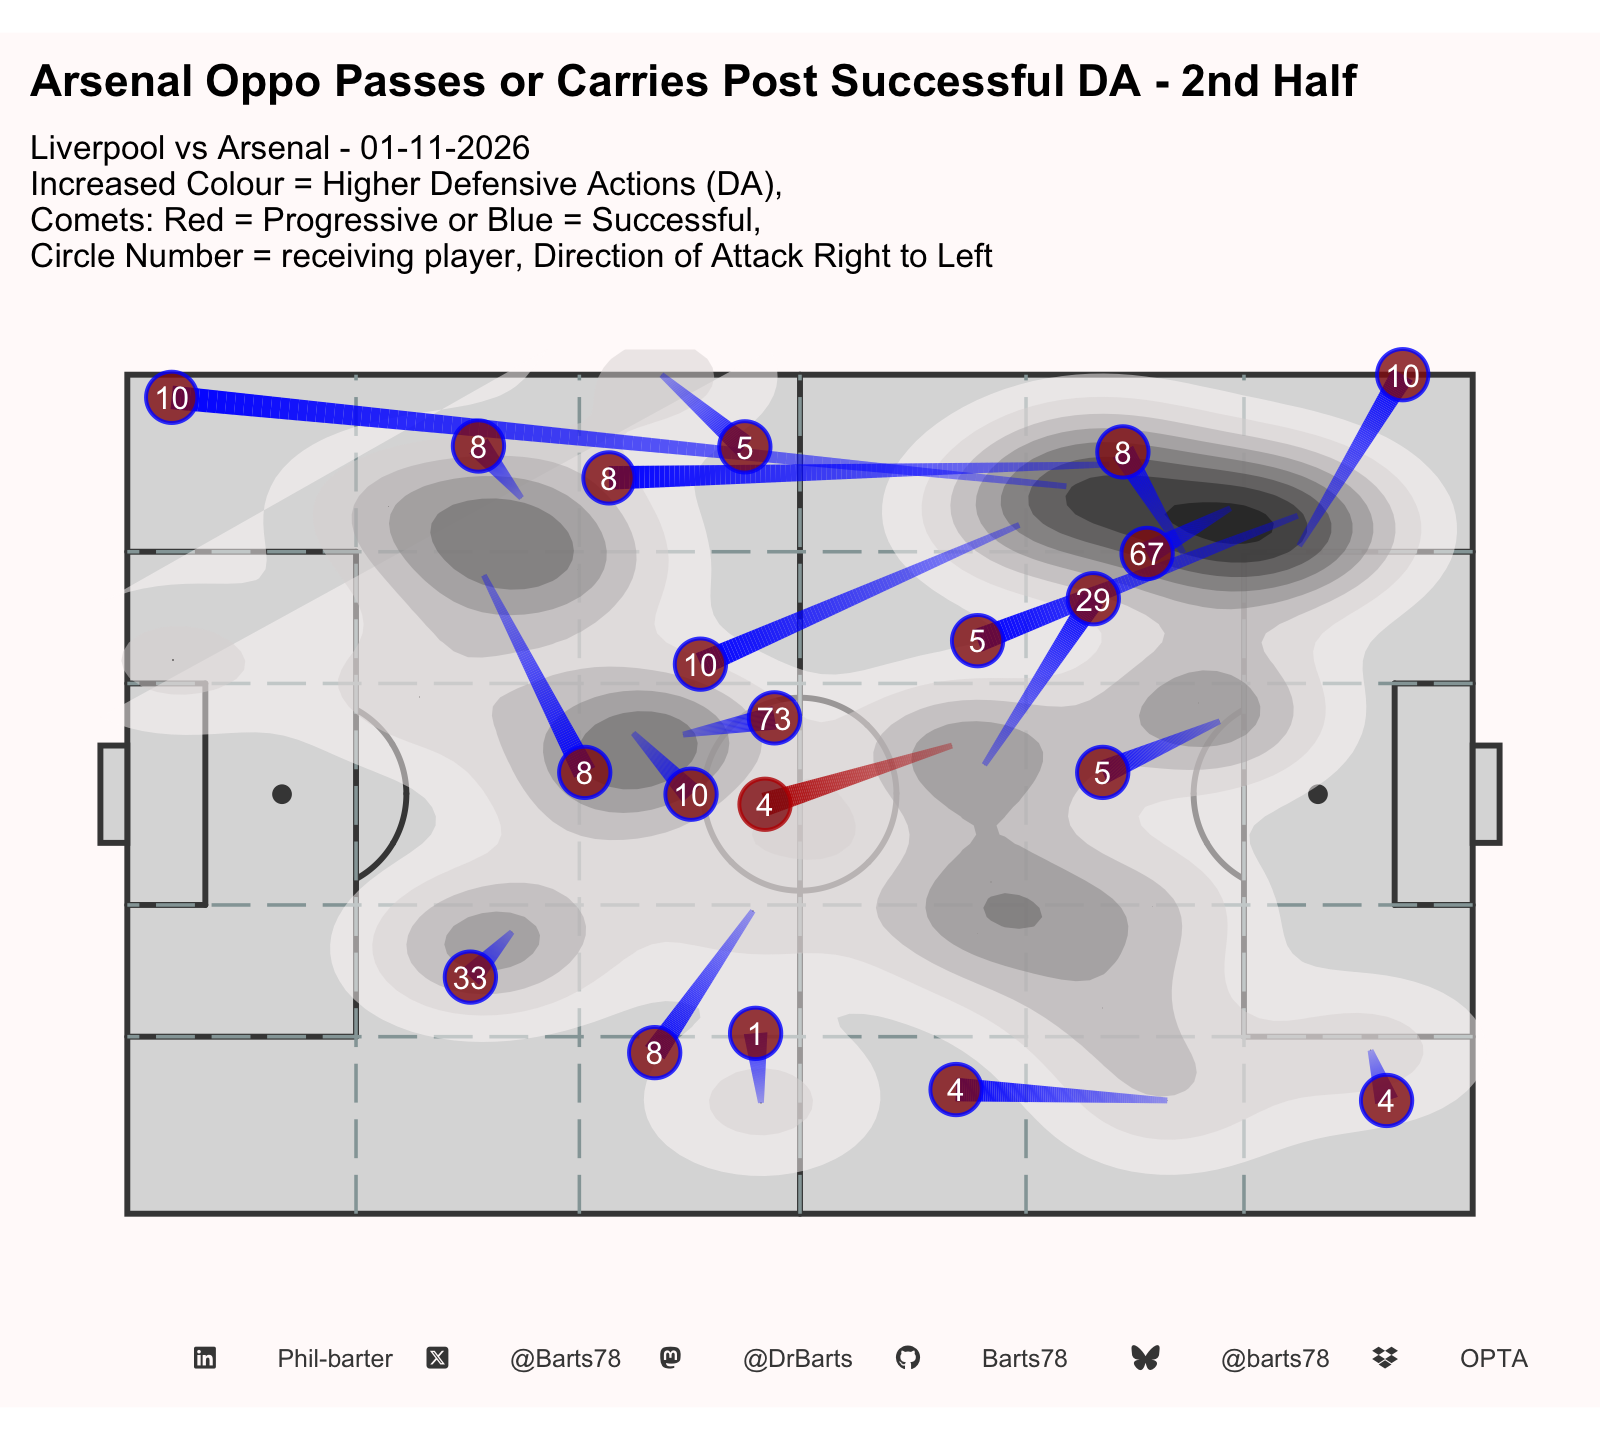
| Possession Lost Post Defensive Action - Thirds Breakdown | |||
| Liverpool vs Arsenal - 01-11-2026 | |||
| Total DAs | % Defensive Third | % Middle Third | % Attacking Third |
|---|---|---|---|
| First Half | |||
| 29 | 45 | 24 | 31 |
| Second Half | |||
| 31 | 39 | 39 | 23 |
| X @Barts78 · Bluesky @barts78 · Mastodon @DrBarts · GitHub Barts78 · LinkedIn Phil-barter · Data: Opta | |||
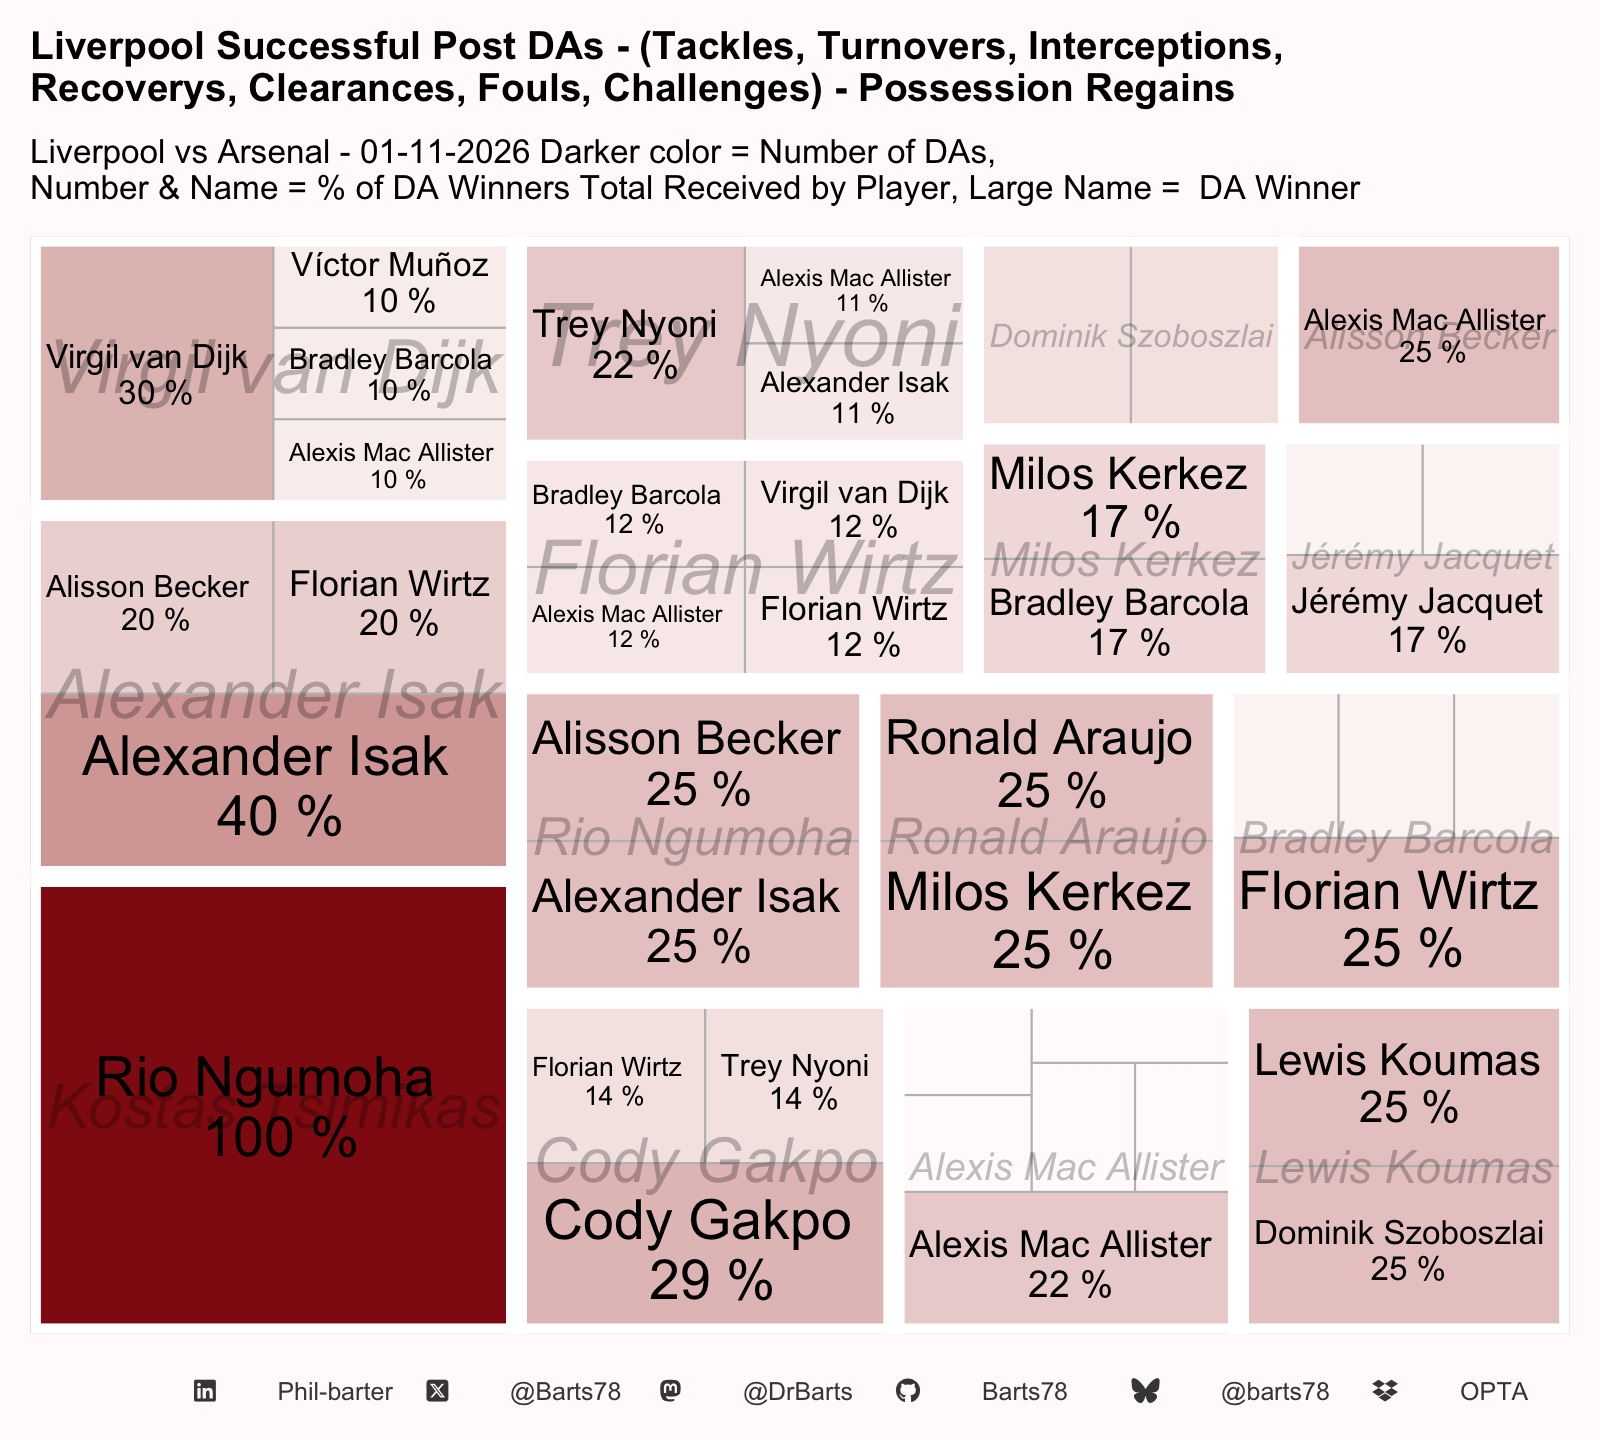
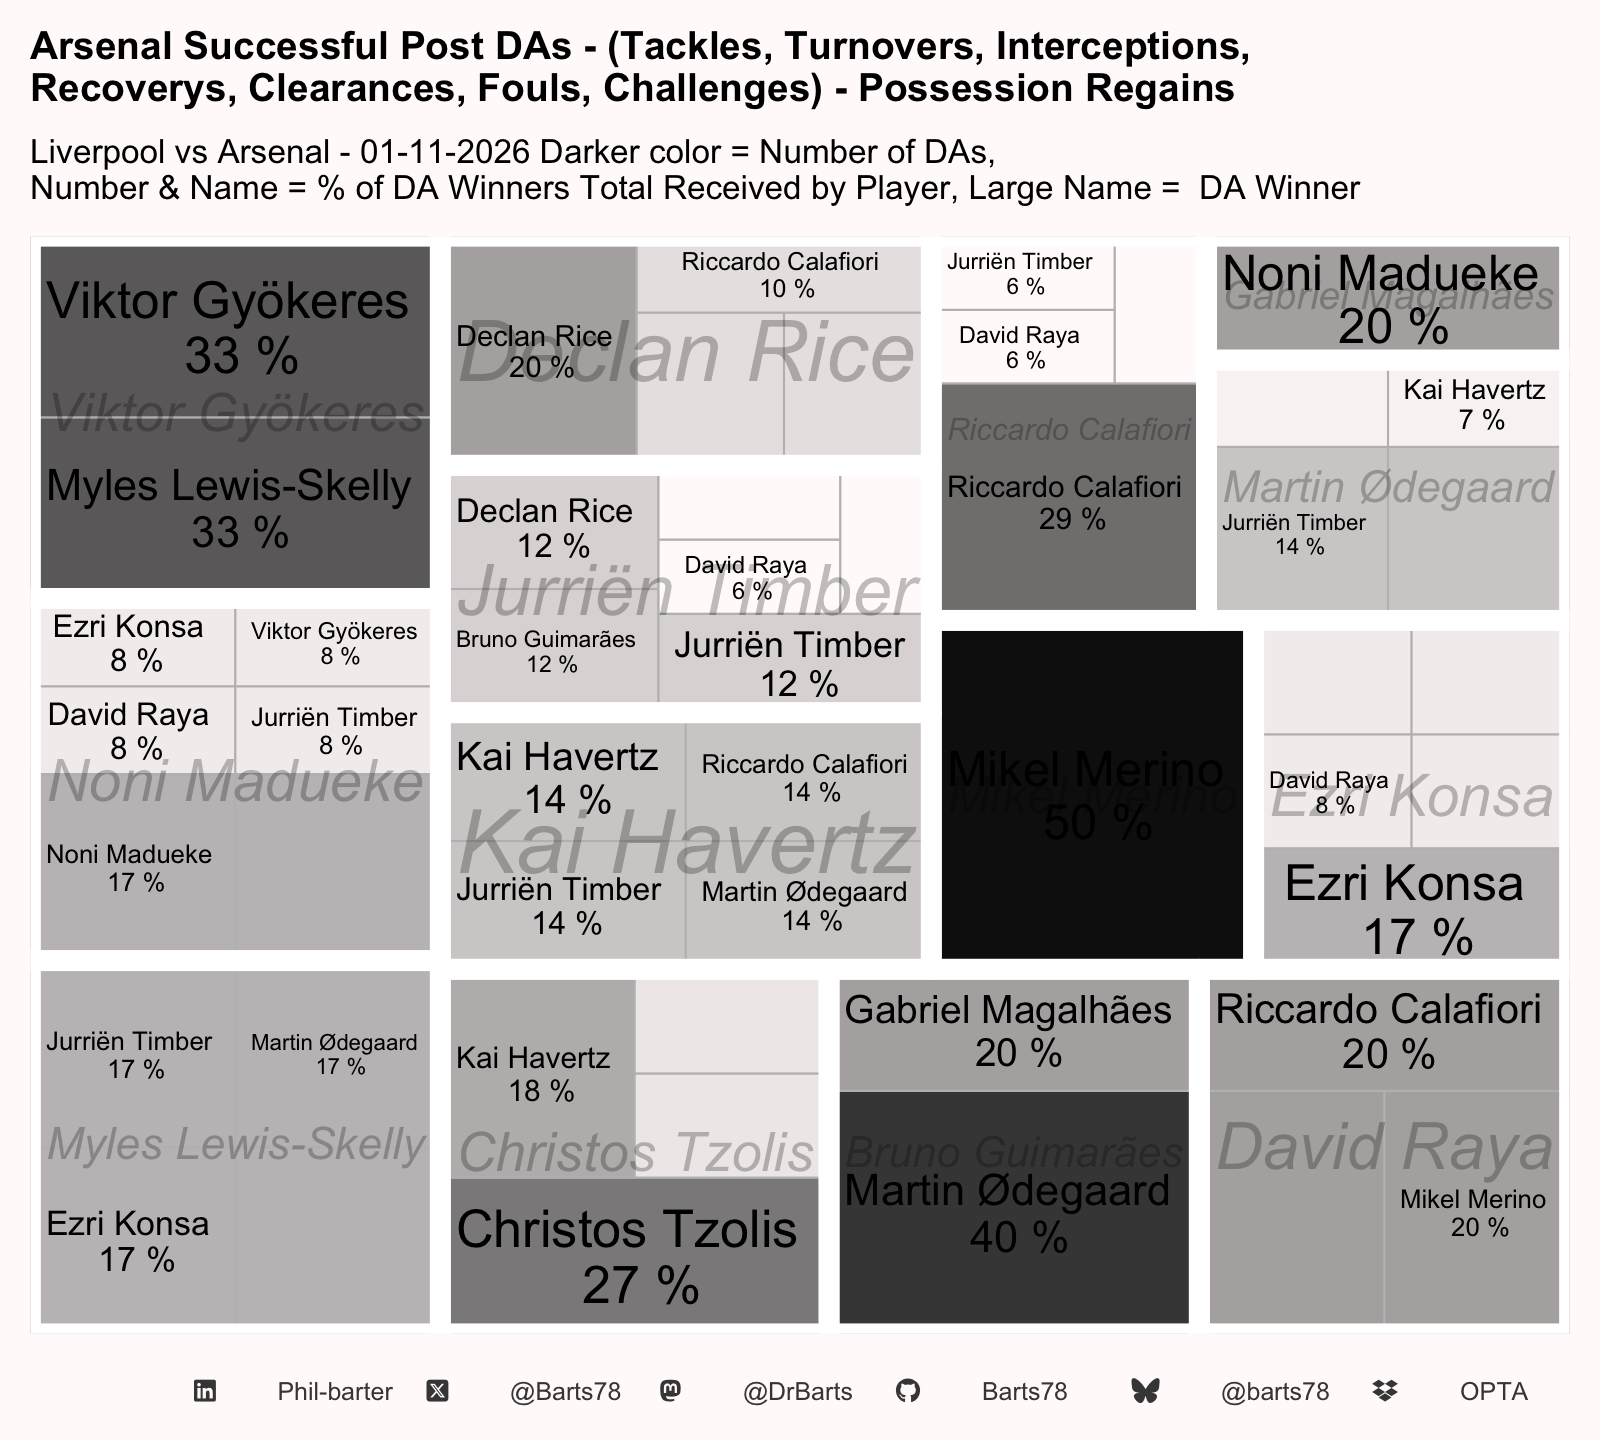
| Possession Post Defensive Action Success | |||||||
| Liverpool vs Arsenal - 01-11-2026 | |||||||
| Total_DA | Total % Oppo Regains | Total % Regains | receiver | % of Successful DA | % Defensive Third | % Middle Third | % Attacking Third |
|---|---|---|---|---|---|---|---|
| Alexander Isak | |||||||
| 5 | 20 | 80 | Alexander Isak | 40.0% | 0 | 40 | 0 |
| 5 | 20 | 80 | Alisson Becker | 20.0% | 0 | 20 | 0 |
| 5 | 20 | 80 | Florian Wirtz | 20.0% | 0 | 0 | 20 |
| Alexis Mac Allister | |||||||
| 18 | 50 | 50 | Alexis Mac Allister | 22.0% | 0 | 17 | 6 |
| 18 | 50 | 50 | Alisson Becker | 6.0% | 0 | 0 | 6 |
| 18 | 50 | 50 | Cody Gakpo | 6.0% | 0 | 0 | 6 |
| 18 | 50 | 50 | Jérémy Jacquet | 6.0% | 0 | 0 | 6 |
| 18 | 50 | 50 | Milos Kerkez | 6.0% | 0 | 6 | 0 |
| 18 | 50 | 50 | Víctor Muñoz | 6.0% | 0 | 0 | 6 |
| Alisson Becker | |||||||
| 4 | 75 | 25 | Alexis Mac Allister | 25.0% | 0 | 25 | 0 |
| Bradley Barcola | |||||||
| 12 | 50 | 50 | Alexis Mac Allister | 8.0% | 0 | 0 | 8 |
| 12 | 50 | 50 | Cody Gakpo | 8.0% | 0 | 0 | 8 |
| 12 | 50 | 50 | Florian Wirtz | 25.0% | 17 | 0 | 8 |
| 12 | 50 | 50 | Milos Kerkez | 8.0% | 0 | 0 | 8 |
| Cody Gakpo | |||||||
| 7 | 43 | 57 | Cody Gakpo | 29.0% | 14 | 14 | 0 |
| 7 | 43 | 57 | Florian Wirtz | 14.0% | 0 | 0 | 14 |
| 7 | 43 | 57 | Trey Nyoni | 14.0% | 0 | 14 | 0 |
| Dominik Szoboszlai | |||||||
| 7 | 71 | 29 | Dominik Szoboszlai | 14.0% | 14 | 0 | 0 |
| 7 | 71 | 29 | Kostas Tsimikas | 14.0% | 0 | 14 | 0 |
| Florian Wirtz | |||||||
| 8 | 50 | 50 | Alexis Mac Allister | 12.0% | 0 | 0 | 12 |
| 8 | 50 | 50 | Bradley Barcola | 12.0% | 0 | 0 | 12 |
| 8 | 50 | 50 | Florian Wirtz | 12.0% | 0 | 0 | 12 |
| 8 | 50 | 50 | Virgil van Dijk | 12.0% | 0 | 0 | 12 |
| Jérémy Jacquet | |||||||
| 12 | 67 | 33 | Alexis Mac Allister | 8.0% | 0 | 8 | 0 |
| 12 | 67 | 33 | Bradley Barcola | 8.0% | 8 | 0 | 0 |
| 12 | 67 | 33 | Jérémy Jacquet | 17.0% | 17 | 0 | 0 |
| Kostas Tsimikas | |||||||
| 1 | 0 | 100 | Rio Ngumoha | 100.0% | 0 | 100 | 0 |
| Lewis Koumas | |||||||
| 4 | 50 | 50 | Dominik Szoboszlai | 25.0% | 0 | 0 | 25 |
| 4 | 50 | 50 | Lewis Koumas | 25.0% | 0 | 25 | 0 |
| Milos Kerkez | |||||||
| 6 | 67 | 33 | Bradley Barcola | 17.0% | 0 | 17 | 0 |
| 6 | 67 | 33 | Milos Kerkez | 17.0% | 0 | 17 | 0 |
| Rio Ngumoha | |||||||
| 4 | 50 | 50 | Alexander Isak | 25.0% | 25 | 0 | 0 |
| 4 | 50 | 50 | Alisson Becker | 25.0% | 25 | 0 | 0 |
| Ronald Araujo | |||||||
| 4 | 50 | 50 | Milos Kerkez | 25.0% | 0 | 25 | 0 |
| 4 | 50 | 50 | Ronald Araujo | 25.0% | 25 | 0 | 0 |
| Trey Nyoni | |||||||
| 9 | 56 | 44 | Alexander Isak | 11.0% | 0 | 11 | 0 |
| 9 | 56 | 44 | Alexis Mac Allister | 11.0% | 11 | 0 | 0 |
| 9 | 56 | 44 | Trey Nyoni | 22.0% | 11 | 11 | 0 |
| Virgil van Dijk | |||||||
| 10 | 40 | 60 | Alexis Mac Allister | 10.0% | 0 | 10 | 0 |
| 10 | 40 | 60 | Bradley Barcola | 10.0% | 0 | 10 | 0 |
| 10 | 40 | 60 | Virgil van Dijk | 30.0% | 10 | 10 | 10 |
| 10 | 40 | 60 | Víctor Muñoz | 10.0% | 0 | 10 | 0 |
| X @Barts78 · Bluesky @barts78 · Mastodon @DrBarts · GitHub Barts78 · LinkedIn Phil-barter · Data: Opta | |||||||
| Possession Post Defensive Action Success | |||||||
| Liverpool vs Arsenal - 01-11-2026 | |||||||
| Total_DA | Total % Oppo Regains | Total % Regains | receiver | % of Successful DA | % Defensive Third | % Middle Third | % Attacking Third |
|---|---|---|---|---|---|---|---|
| Bruno Guimarães | |||||||
| 5 | 40 | 60 | Gabriel Magalhães | 20.0% | 0 | 20 | 0 |
| 5 | 40 | 60 | Martin Ødegaard | 40.0% | 40 | 0 | 0 |
| Christos Tzolis | |||||||
| 11 | 36 | 64 | Christos Tzolis | 27.0% | 0 | 9 | 18 |
| 11 | 36 | 64 | Kai Havertz | 18.0% | 9 | 9 | 0 |
| 11 | 36 | 64 | Martin Ødegaard | 9.0% | 9 | 0 | 0 |
| 11 | 36 | 64 | Myles Lewis-Skelly | 9.0% | 0 | 9 | 0 |
| David Raya | |||||||
| 5 | 40 | 60 | Bruno Guimarães | 20.0% | 20 | 0 | 0 |
| 5 | 40 | 60 | Mikel Merino | 20.0% | 20 | 0 | 0 |
| 5 | 40 | 60 | Riccardo Calafiori | 20.0% | 20 | 0 | 0 |
| Declan Rice | |||||||
| 10 | 50 | 50 | Bruno Guimarães | 10.0% | 10 | 0 | 0 |
| 10 | 50 | 50 | Declan Rice | 20.0% | 20 | 0 | 0 |
| 10 | 50 | 50 | Jurriën Timber | 10.0% | 0 | 10 | 0 |
| 10 | 50 | 50 | Riccardo Calafiori | 10.0% | 10 | 0 | 0 |
| Ezri Konsa | |||||||
| 12 | 50 | 50 | David Raya | 8.0% | 8 | 0 | 0 |
| 12 | 50 | 50 | Ezri Konsa | 17.0% | 8 | 8 | 0 |
| 12 | 50 | 50 | Martin Ødegaard | 8.0% | 8 | 0 | 0 |
| 12 | 50 | 50 | Myles Lewis-Skelly | 8.0% | 8 | 0 | 0 |
| 12 | 50 | 50 | Noni Madueke | 8.0% | 8 | 0 | 0 |
| Gabriel Magalhães | |||||||
| 5 | 80 | 20 | Noni Madueke | 20.0% | 0 | 20 | 0 |
| Jurriën Timber | |||||||
| 17 | 47 | 53 | Bruno Guimarães | 12.0% | 6 | 6 | 0 |
| 17 | 47 | 53 | David Raya | 6.0% | 6 | 0 | 0 |
| 17 | 47 | 53 | Declan Rice | 12.0% | 6 | 6 | 0 |
| 17 | 47 | 53 | Gabriel Magalhães | 6.0% | 0 | 0 | 6 |
| 17 | 47 | 53 | Jurriën Timber | 12.0% | 0 | 6 | 6 |
| 17 | 47 | 53 | Riccardo Calafiori | 6.0% | 0 | 6 | 0 |
| Kai Havertz | |||||||
| 7 | 43 | 57 | Jurriën Timber | 14.0% | 0 | 14 | 0 |
| 7 | 43 | 57 | Kai Havertz | 14.0% | 14 | 0 | 0 |
| 7 | 43 | 57 | Martin Ødegaard | 14.0% | 14 | 0 | 0 |
| 7 | 43 | 57 | Riccardo Calafiori | 14.0% | 14 | 0 | 0 |
| Martin Ødegaard | |||||||
| 14 | 57 | 43 | Christos Tzolis | 7.0% | 0 | 0 | 7 |
| 14 | 57 | 43 | Jurriën Timber | 14.0% | 7 | 7 | 0 |
| 14 | 57 | 43 | Kai Havertz | 7.0% | 0 | 0 | 7 |
| 14 | 57 | 43 | Martin Ødegaard | 14.0% | 7 | 0 | 7 |
| Mikel Merino | |||||||
| 2 | 50 | 50 | Mikel Merino | 50.0% | 0 | 0 | 50 |
| Myles Lewis-Skelly | |||||||
| 6 | 33 | 67 | Ezri Konsa | 17.0% | 17 | 0 | 0 |
| 6 | 33 | 67 | Gabriel Magalhães | 17.0% | 0 | 17 | 0 |
| 6 | 33 | 67 | Jurriën Timber | 17.0% | 0 | 17 | 0 |
| 6 | 33 | 67 | Martin Ødegaard | 17.0% | 0 | 17 | 0 |
| Noni Madueke | |||||||
| 12 | 33 | 67 | David Raya | 8.0% | 8 | 0 | 0 |
| 12 | 33 | 67 | Ezri Konsa | 8.0% | 0 | 8 | 0 |
| 12 | 33 | 67 | Jurriën Timber | 8.0% | 0 | 8 | 0 |
| 12 | 33 | 67 | Noni Madueke | 17.0% | 8 | 8 | 0 |
| 12 | 33 | 67 | Riccardo Calafiori | 17.0% | 17 | 0 | 0 |
| 12 | 33 | 67 | Viktor Gyökeres | 8.0% | 8 | 0 | 0 |
| Riccardo Calafiori | |||||||
| 17 | 53 | 47 | David Raya | 6.0% | 6 | 0 | 0 |
| 17 | 53 | 47 | Jurriën Timber | 6.0% | 6 | 0 | 0 |
| 17 | 53 | 47 | Martin Ødegaard | 6.0% | 0 | 0 | 6 |
| 17 | 53 | 47 | Riccardo Calafiori | 29.0% | 12 | 6 | 12 |
| Viktor Gyökeres | |||||||
| 3 | 33 | 67 | Myles Lewis-Skelly | 33.0% | 0 | 33 | 0 |
| 3 | 33 | 67 | Viktor Gyökeres | 33.0% | 0 | 33 | 0 |
| X @Barts78 · Bluesky @barts78 · Mastodon @DrBarts · GitHub Barts78 · LinkedIn Phil-barter · Data: Opta | |||||||
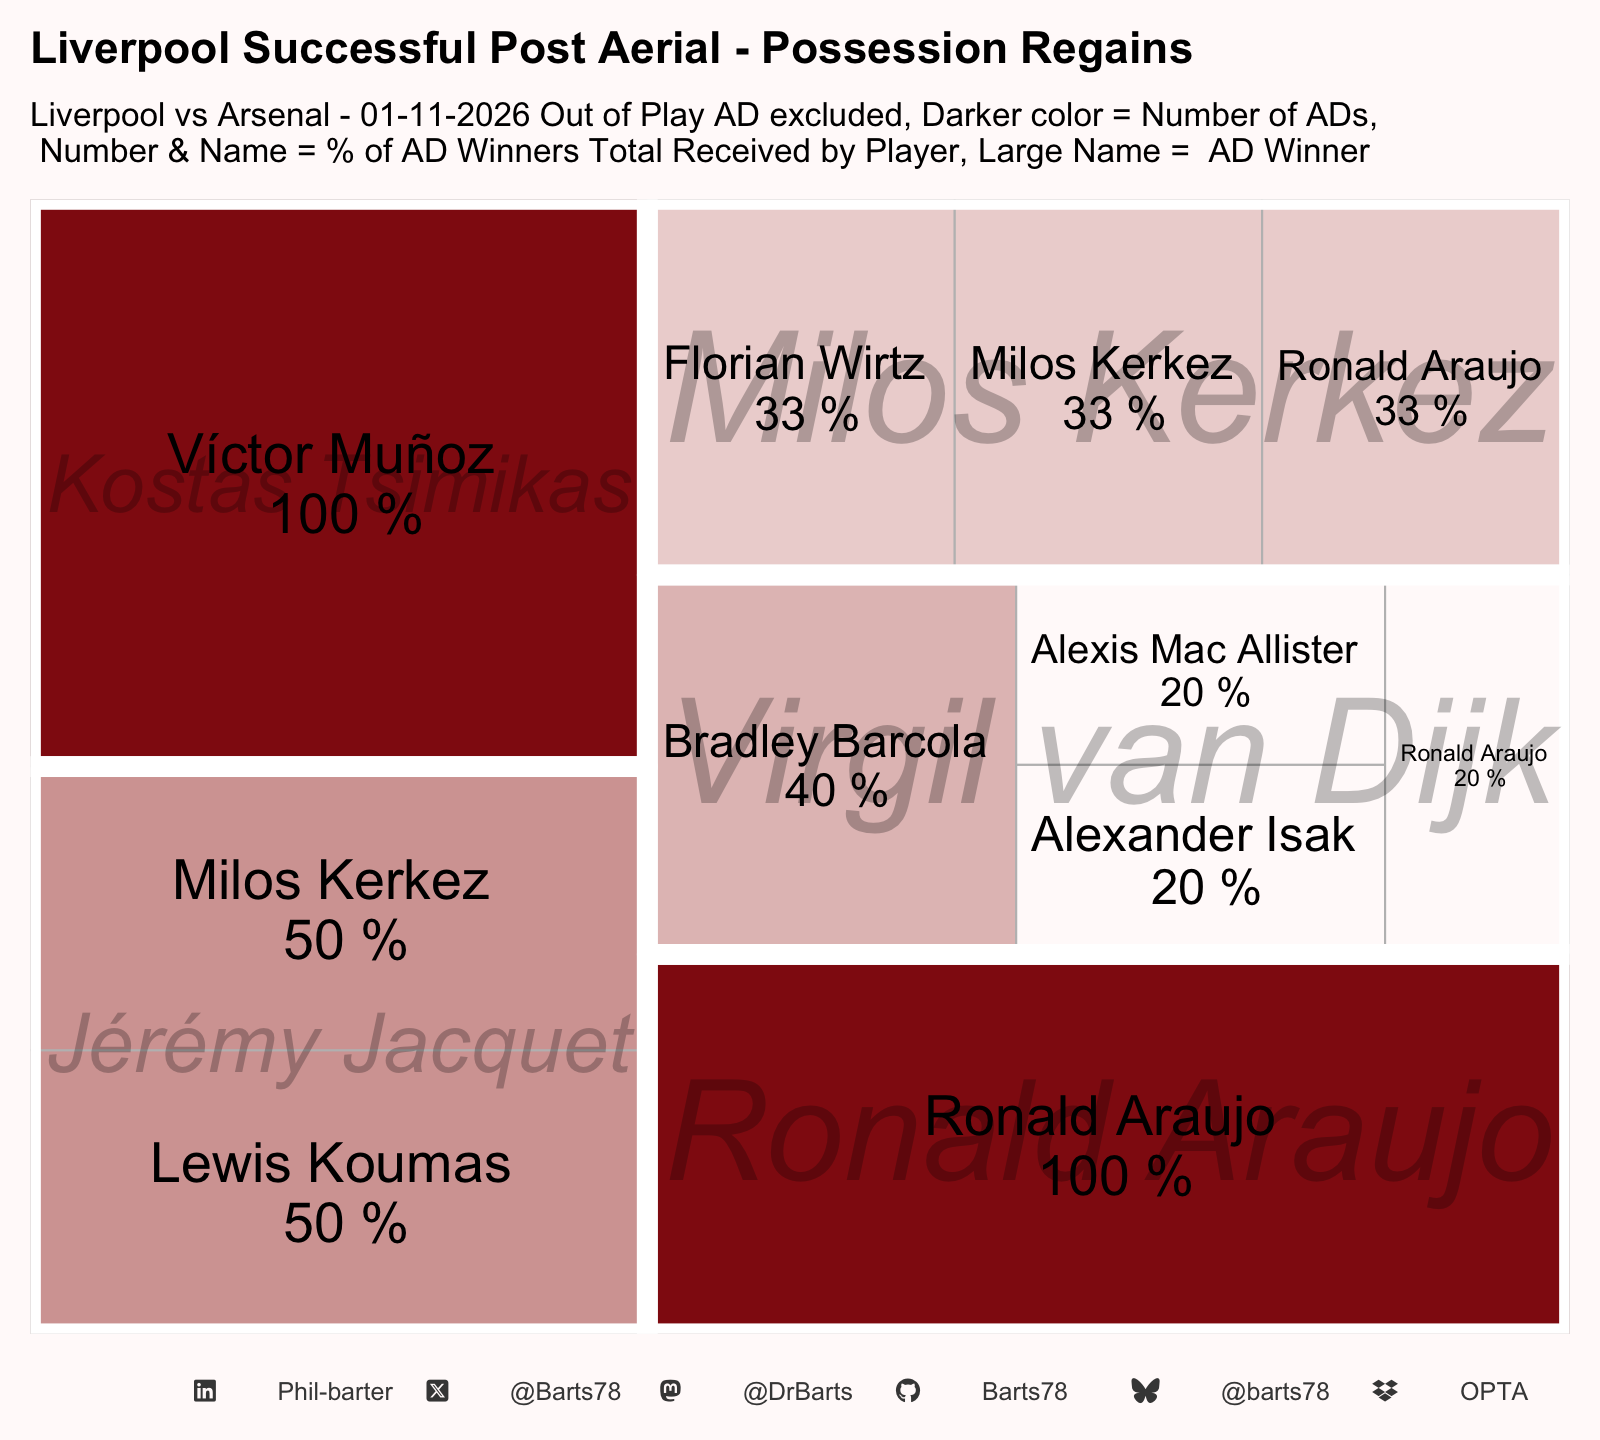
| Possession Post Aerial Duel Success | |||||||
| Liverpool vs Arsenal - 01-11-2026 | |||||||
| Total_AD | Total % Oppo Regains | Total % Regains | receiver | % of Successful AD | % Defensive Third | % Middle Third | % Attacking Third |
|---|---|---|---|---|---|---|---|
| Jérémy Jacquet | |||||||
| 3 | 33 | 67 | Lewis Koumas | 50.0% | 50 | 0 | 0 |
| 3 | 33 | 67 | Milos Kerkez | 50.0% | 0 | 50 | 0 |
| Kostas Tsimikas | |||||||
| 1 | 0 | 100 | Víctor Muñoz | 100.0% | 0 | 100 | 0 |
| Milos Kerkez | |||||||
| 6 | 50 | 50 | Florian Wirtz | 33.0% | 0 | 33 | 0 |
| 6 | 50 | 50 | Milos Kerkez | 33.0% | 0 | 33 | 0 |
| 6 | 50 | 50 | Ronald Araujo | 33.0% | 33 | 0 | 0 |
| Ronald Araujo | |||||||
| 10 | 90 | 10 | Ronald Araujo | 100.0% | 100 | 0 | 0 |
| Virgil van Dijk | |||||||
| 7 | 29 | 71 | Alexander Isak | 20.0% | 0 | 20 | 0 |
| 7 | 29 | 71 | Alexis Mac Allister | 20.0% | 0 | 0 | 20 |
| 7 | 29 | 71 | Bradley Barcola | 40.0% | 0 | 20 | 20 |
| 7 | 29 | 71 | Ronald Araujo | 20.0% | 0 | 20 | 0 |
| X @Barts78 · Bluesky @barts78 · Mastodon @DrBarts · GitHub Barts78 · LinkedIn Phil-barter · Data: Opta | |||||||
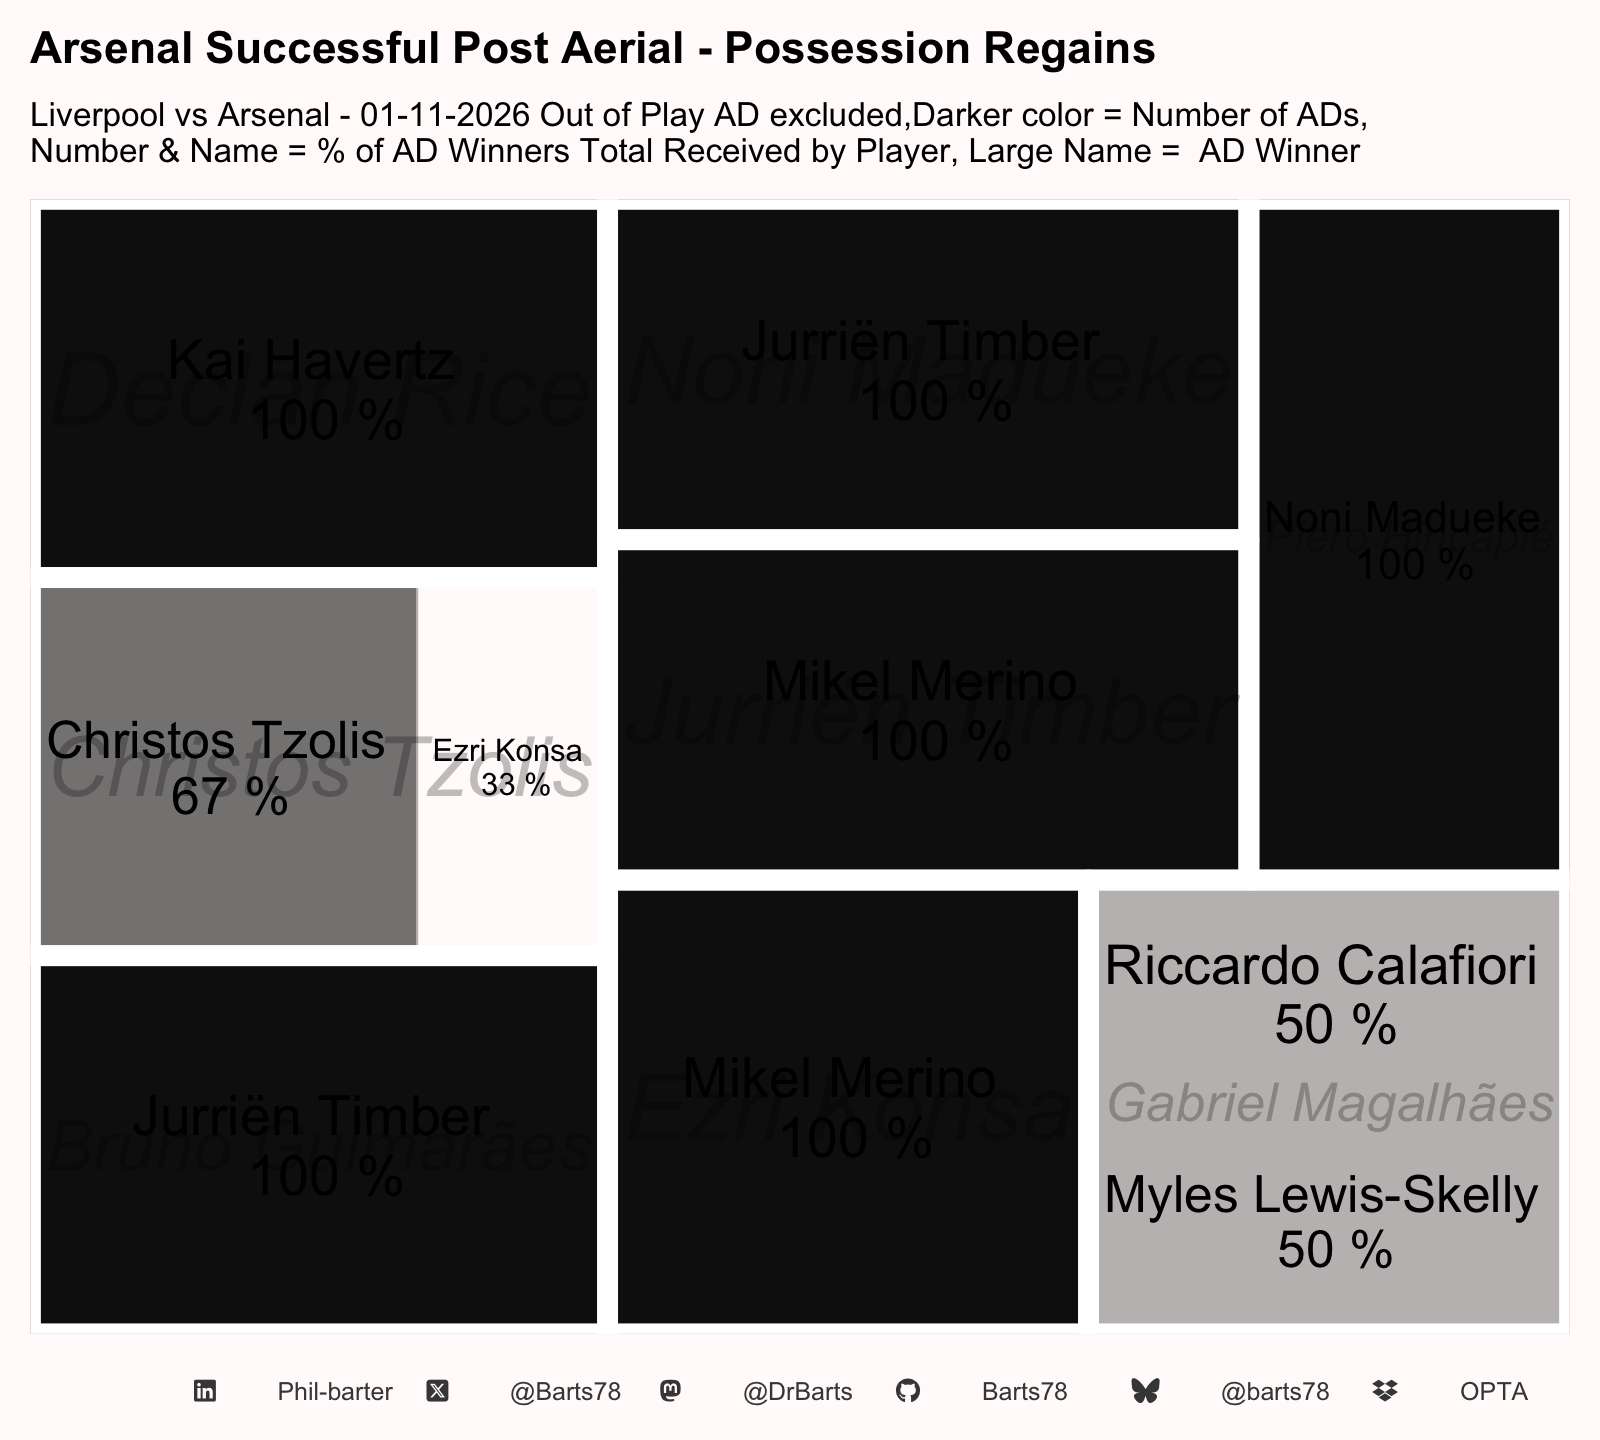
| Possession Post Aerial Duel Success | |||||||
| Liverpool vs Arsenal - 01-11-2026 | |||||||
| Total_AD | Total % Oppo Regains | Total % Regains | receiver | % of Successful AD | % Defensive Third | % Middle Third | % Attacking Third |
|---|---|---|---|---|---|---|---|
| Bruno Guimarães | |||||||
| 1 | 0 | 100 | Jurriën Timber | 100.0% | 0 | 100 | 0 |
| Christos Tzolis | |||||||
| 6 | 50 | 50 | Christos Tzolis | 67.0% | 67 | 0 | 0 |
| 6 | 50 | 50 | Ezri Konsa | 33.0% | 0 | 33 | 0 |
| Declan Rice | |||||||
| 3 | 67 | 33 | Kai Havertz | 100.0% | 100 | 0 | 0 |
| Ezri Konsa | |||||||
| 2 | 50 | 50 | Mikel Merino | 100.0% | 0 | 100 | 0 |
| Gabriel Magalhães | |||||||
| 4 | 50 | 50 | Myles Lewis-Skelly | 50.0% | 0 | 0 | 50 |
| 4 | 50 | 50 | Riccardo Calafiori | 50.0% | 0 | 50 | 0 |
| Jurriën Timber | |||||||
| 5 | 80 | 20 | Mikel Merino | 100.0% | 0 | 100 | 0 |
| Noni Madueke | |||||||
| 5 | 80 | 20 | Jurriën Timber | 100.0% | 0 | 100 | 0 |
| Piero Hincapié | |||||||
| 2 | 50 | 50 | Noni Madueke | 100.0% | 100 | 0 | 0 |
| X @Barts78 · Bluesky @barts78 · Mastodon @DrBarts · GitHub Barts78 · LinkedIn Phil-barter · Data: Opta | |||||||
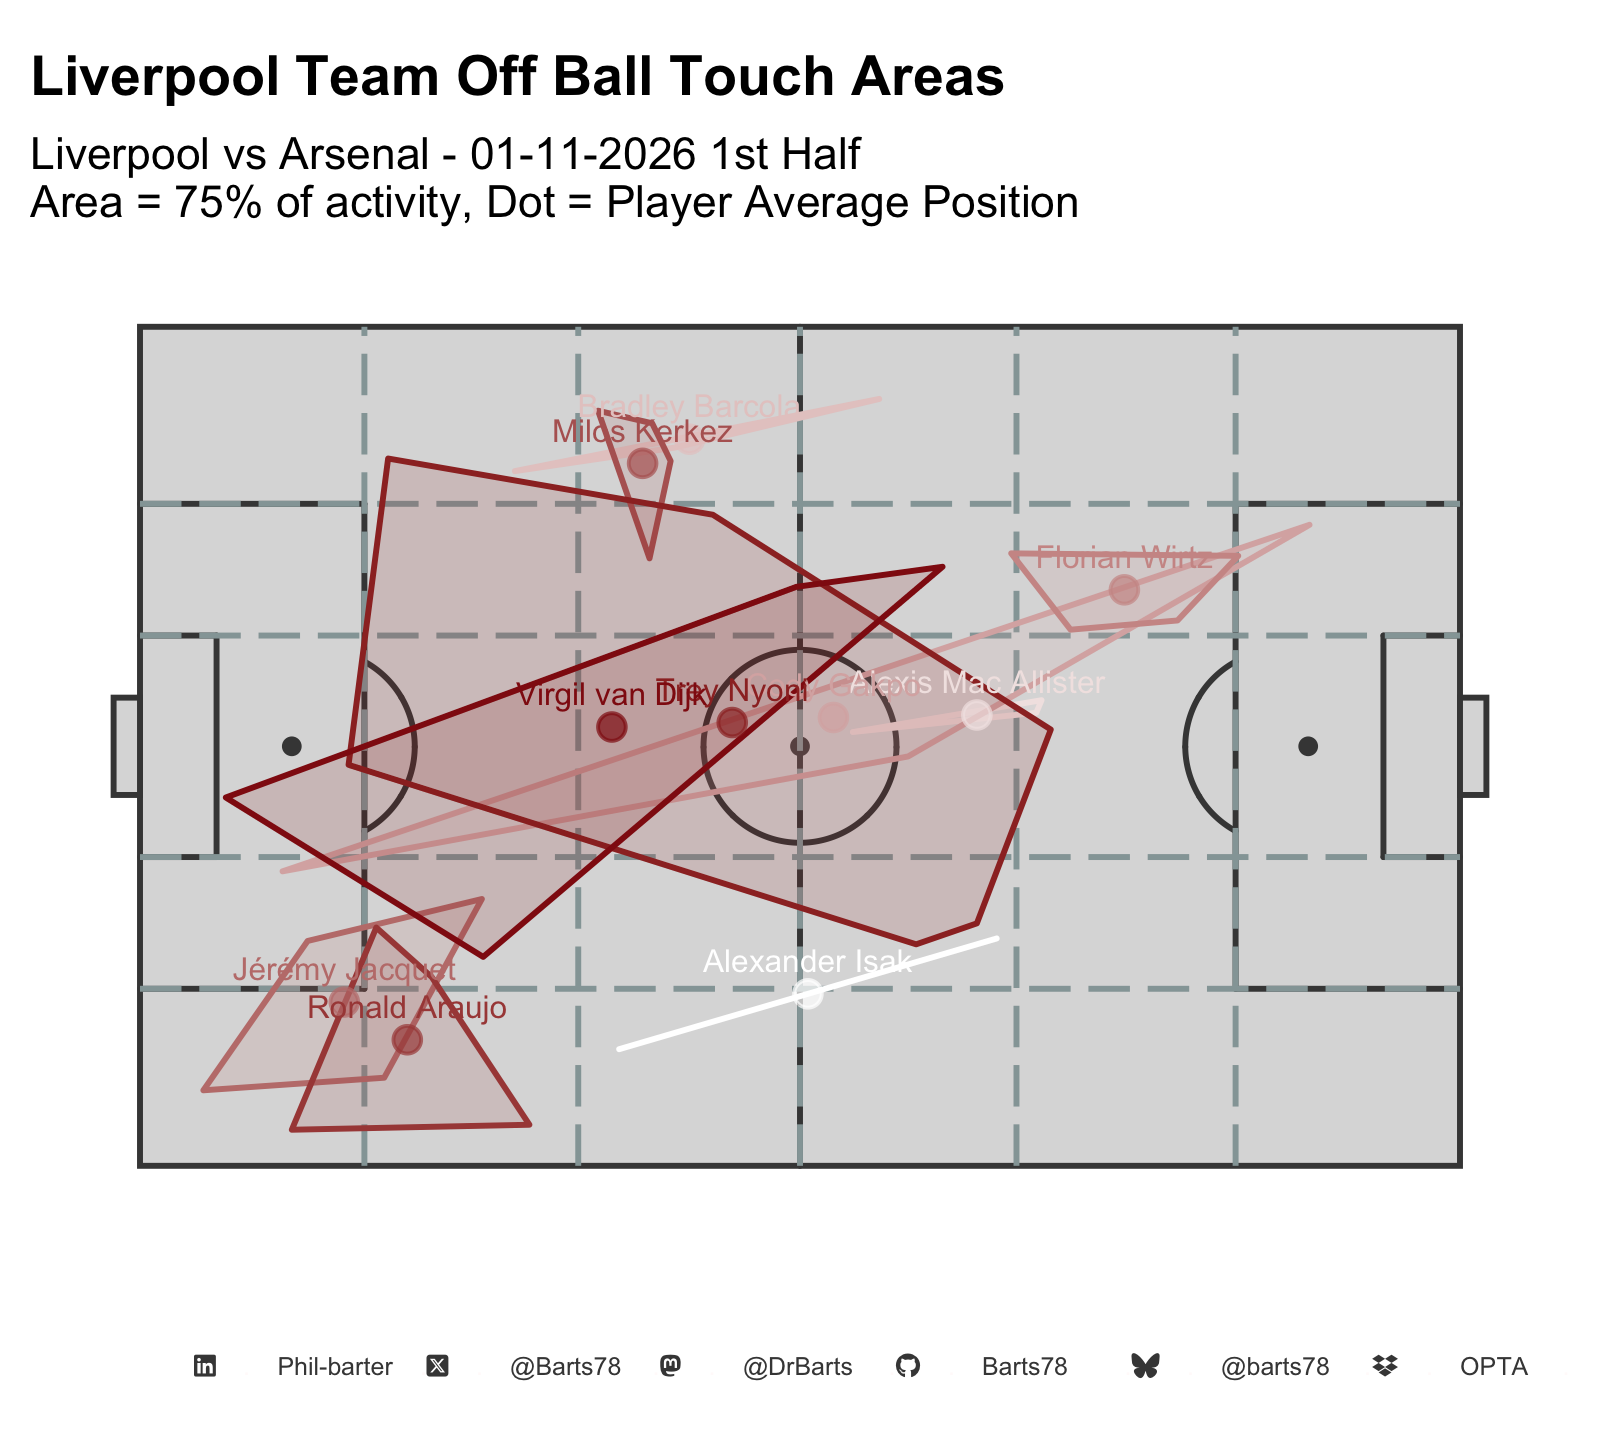
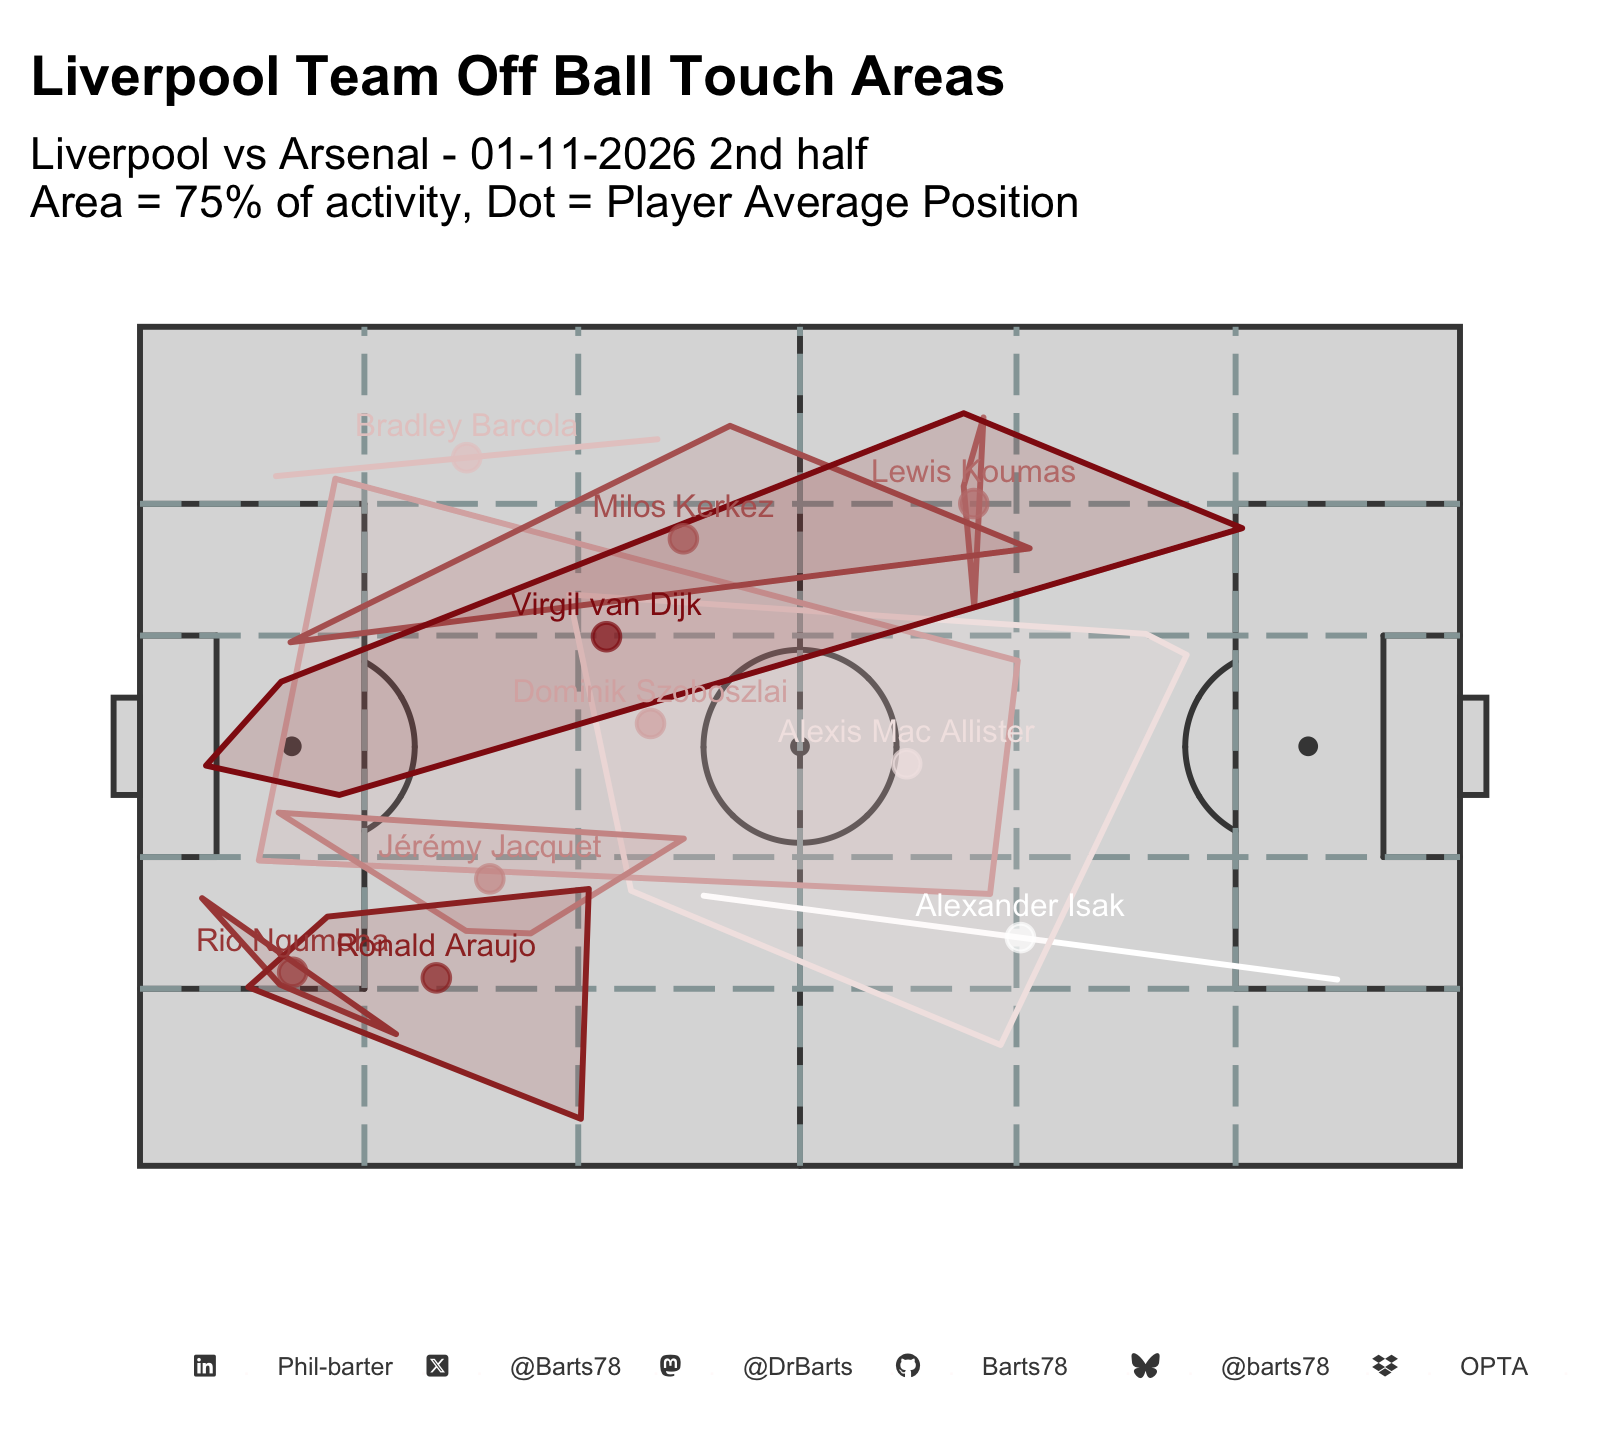
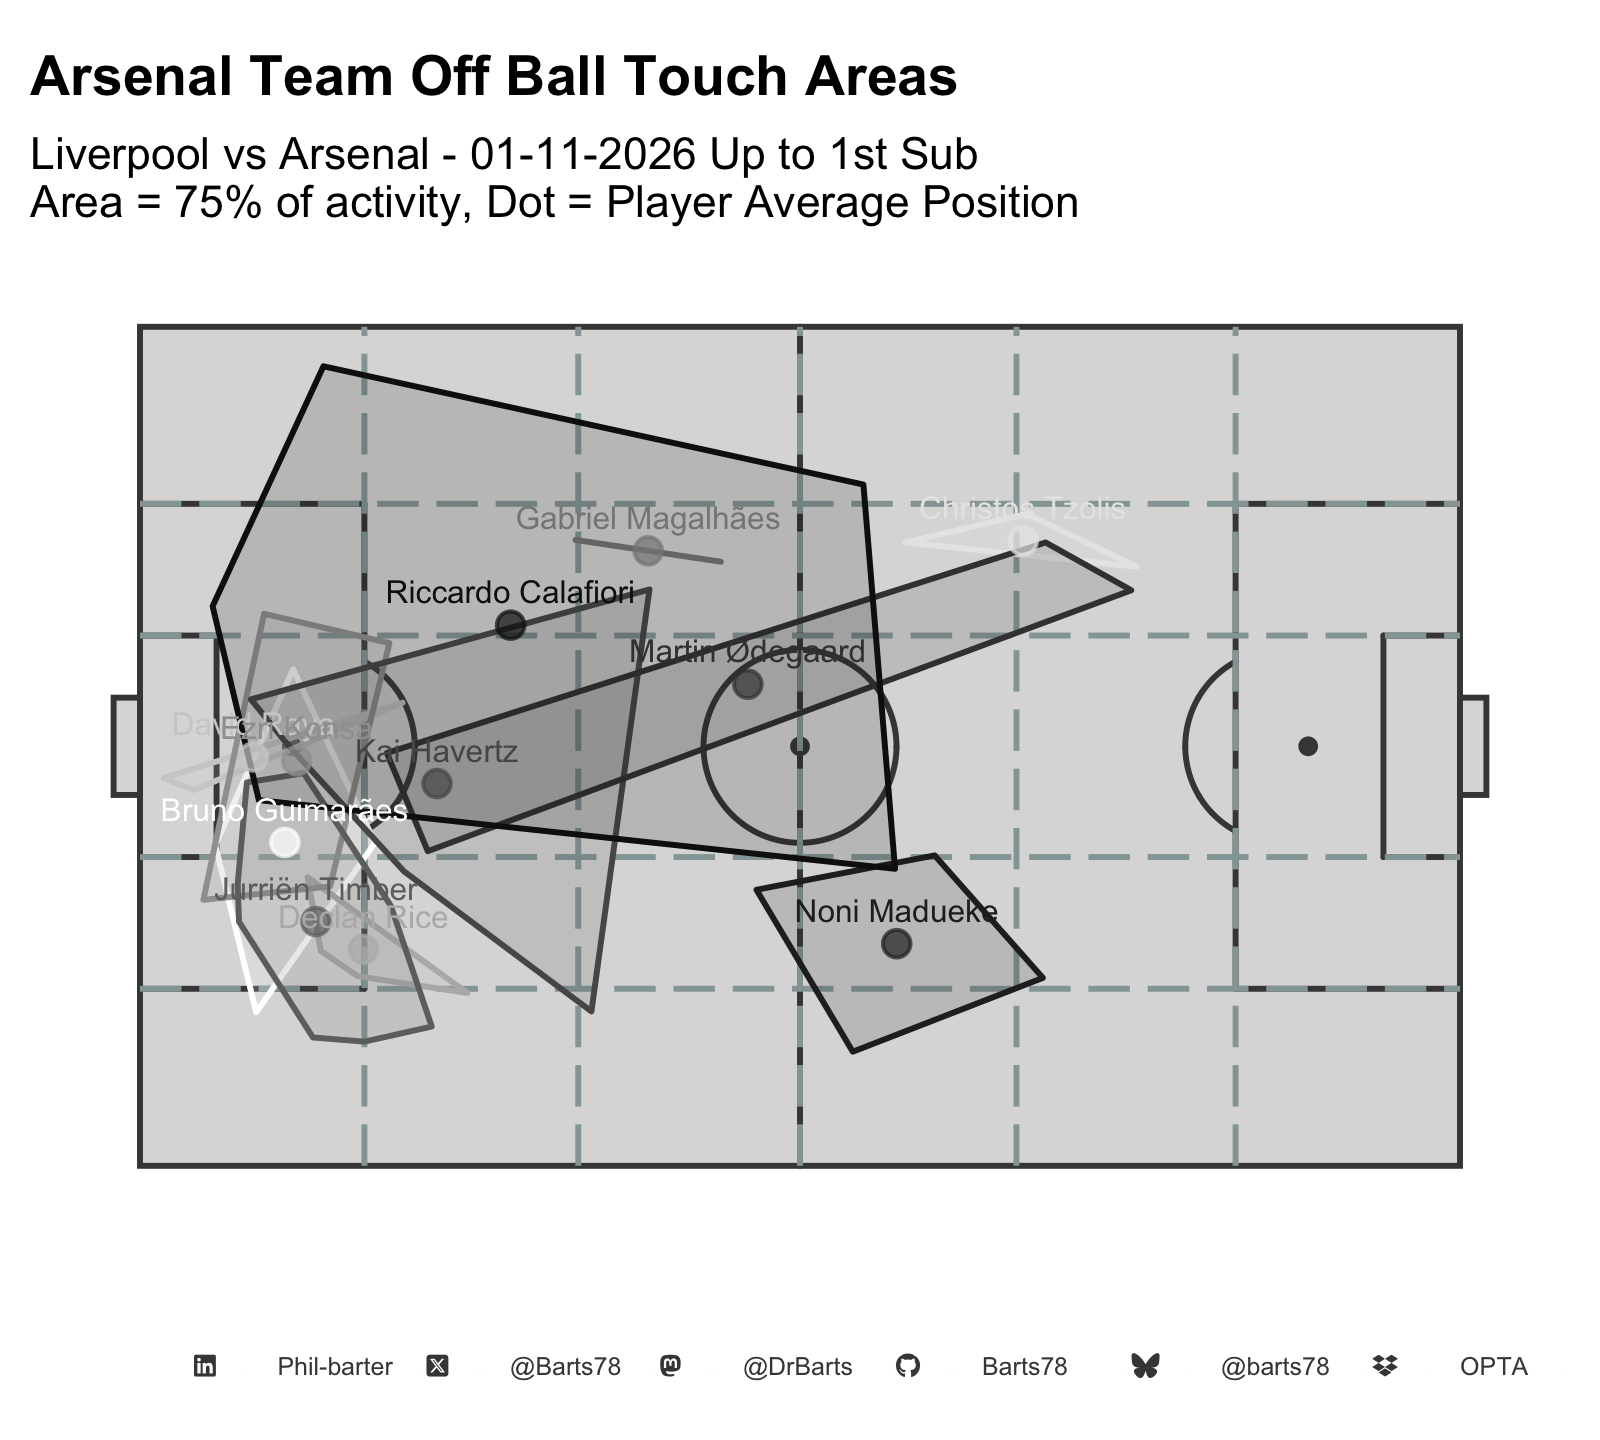
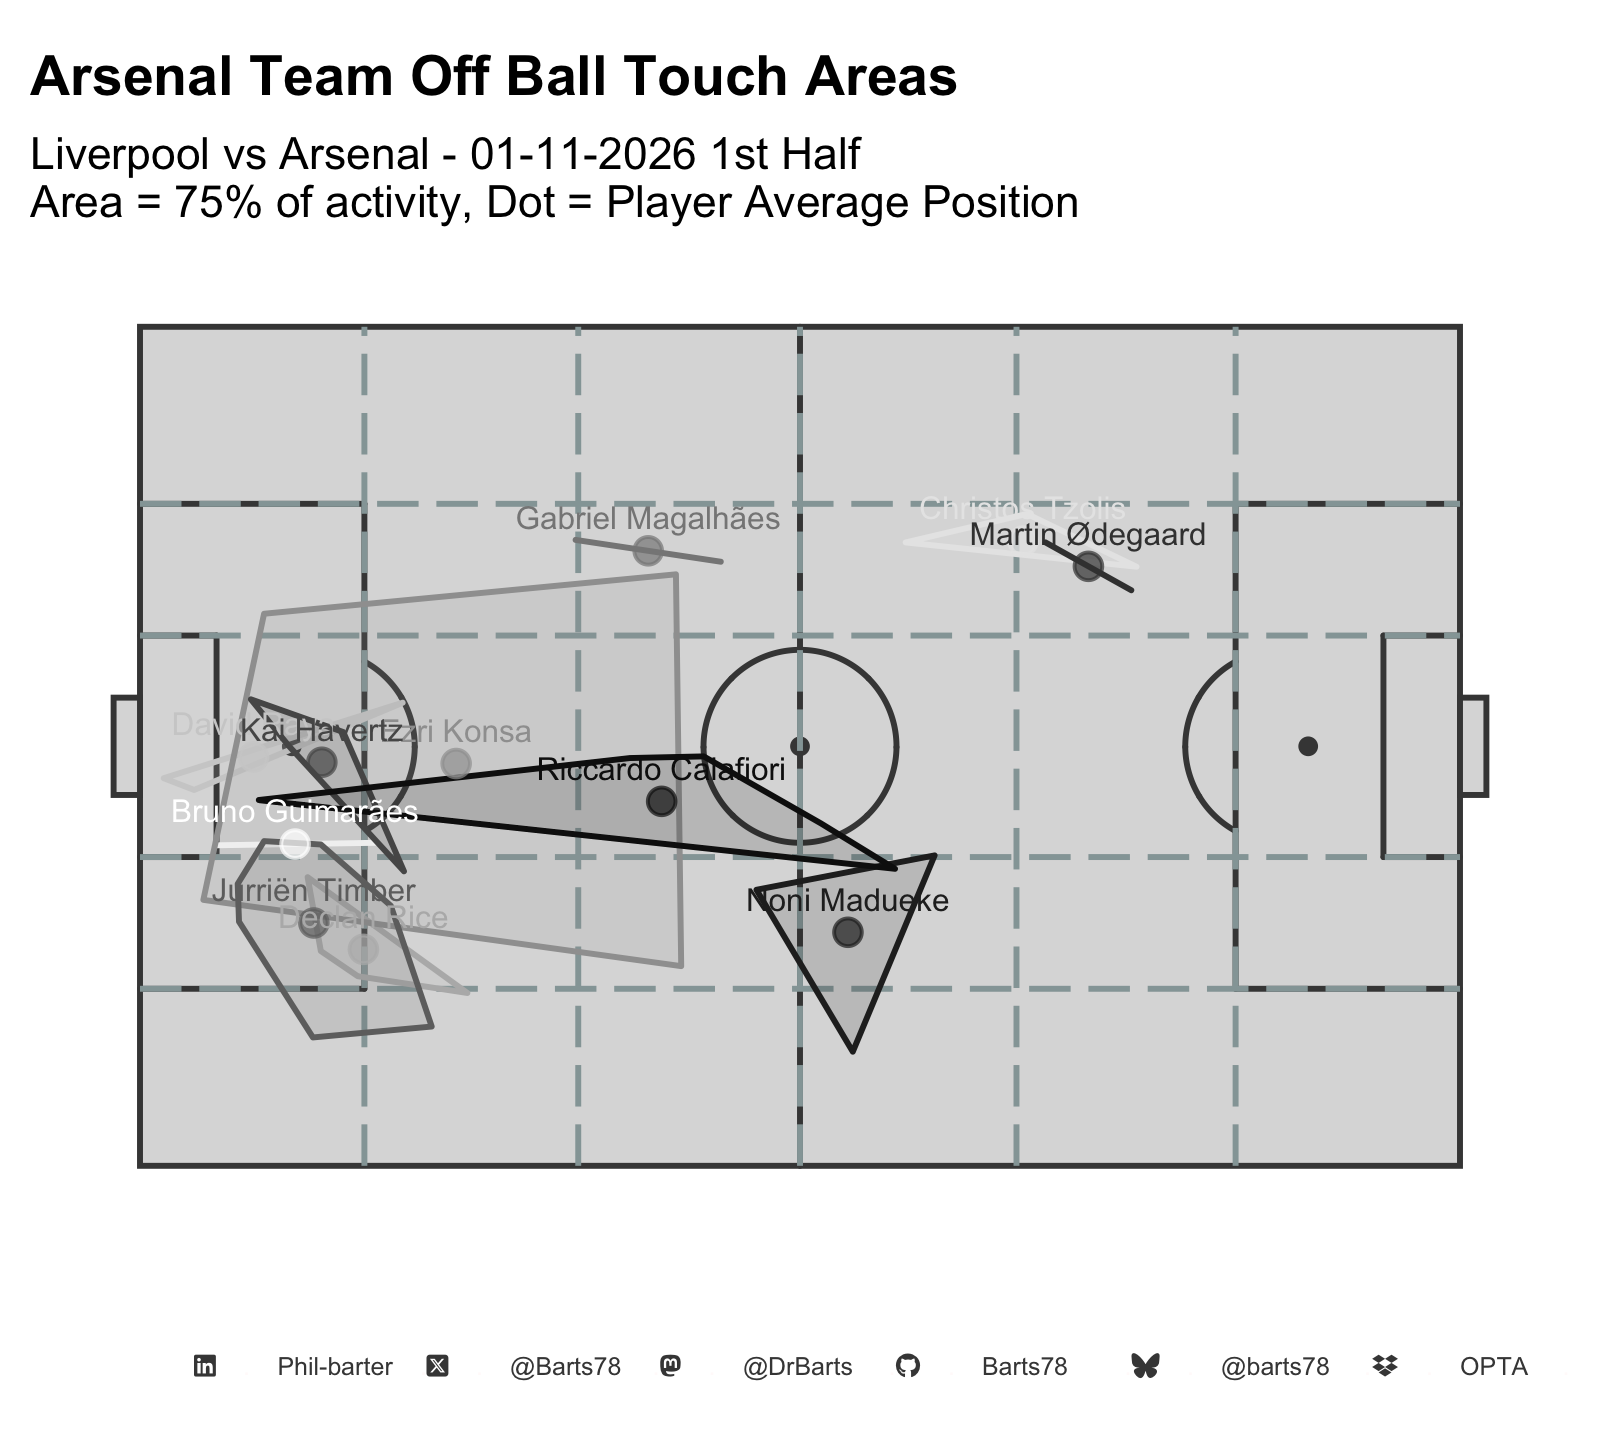
| Liverpool - Transitions | |
| Liverpool vs Arsenal - 01-11-2026 | |
| Liverpool | |
|---|---|
| After winning the ball | |
| Open-play regains | 105 |
| Regains in attacking third | 17 |
| Regains leading to a shot | 9 |
| Shots within 15s of regain | 5 |
| xG within 15s | 0.51 |
| Goals within 15s | 0 |
| Median time regain to shot (s) | 11 |
| After losing the ball | |
| Shots conceded within 15s of losing ball | 3 |
| xG conceded within 15s | 0.72 |
| Goals conceded within 15s | 1 |
| Open-play regain = a sequence started by winning the ball in play (tackle, interception, recovery or an opponent's misplaced pass). | |
| X @Barts78 · Bluesky @barts78 · Mastodon @DrBarts · GitHub Barts78 · LinkedIn Phil-barter · Data: Opta | |
| Arsenal - Transitions | |
| Liverpool vs Arsenal - 01-11-2026 | |
| Arsenal | |
|---|---|
| After winning the ball | |
| Open-play regains | 90 |
| Regains in attacking third | 6 |
| Regains leading to a shot | 6 |
| Shots within 15s of regain | 3 |
| xG within 15s | 0.72 |
| Goals within 15s | 1 |
| Median time regain to shot (s) | 18 |
| After losing the ball | |
| Shots conceded within 15s of losing ball | 5 |
| xG conceded within 15s | 0.51 |
| Goals conceded within 15s | 0 |
| Open-play regain = a sequence started by winning the ball in play (tackle, interception, recovery or an opponent's misplaced pass). | |
| X @Barts78 · Bluesky @barts78 · Mastodon @DrBarts · GitHub Barts78 · LinkedIn Phil-barter · Data: Opta | |
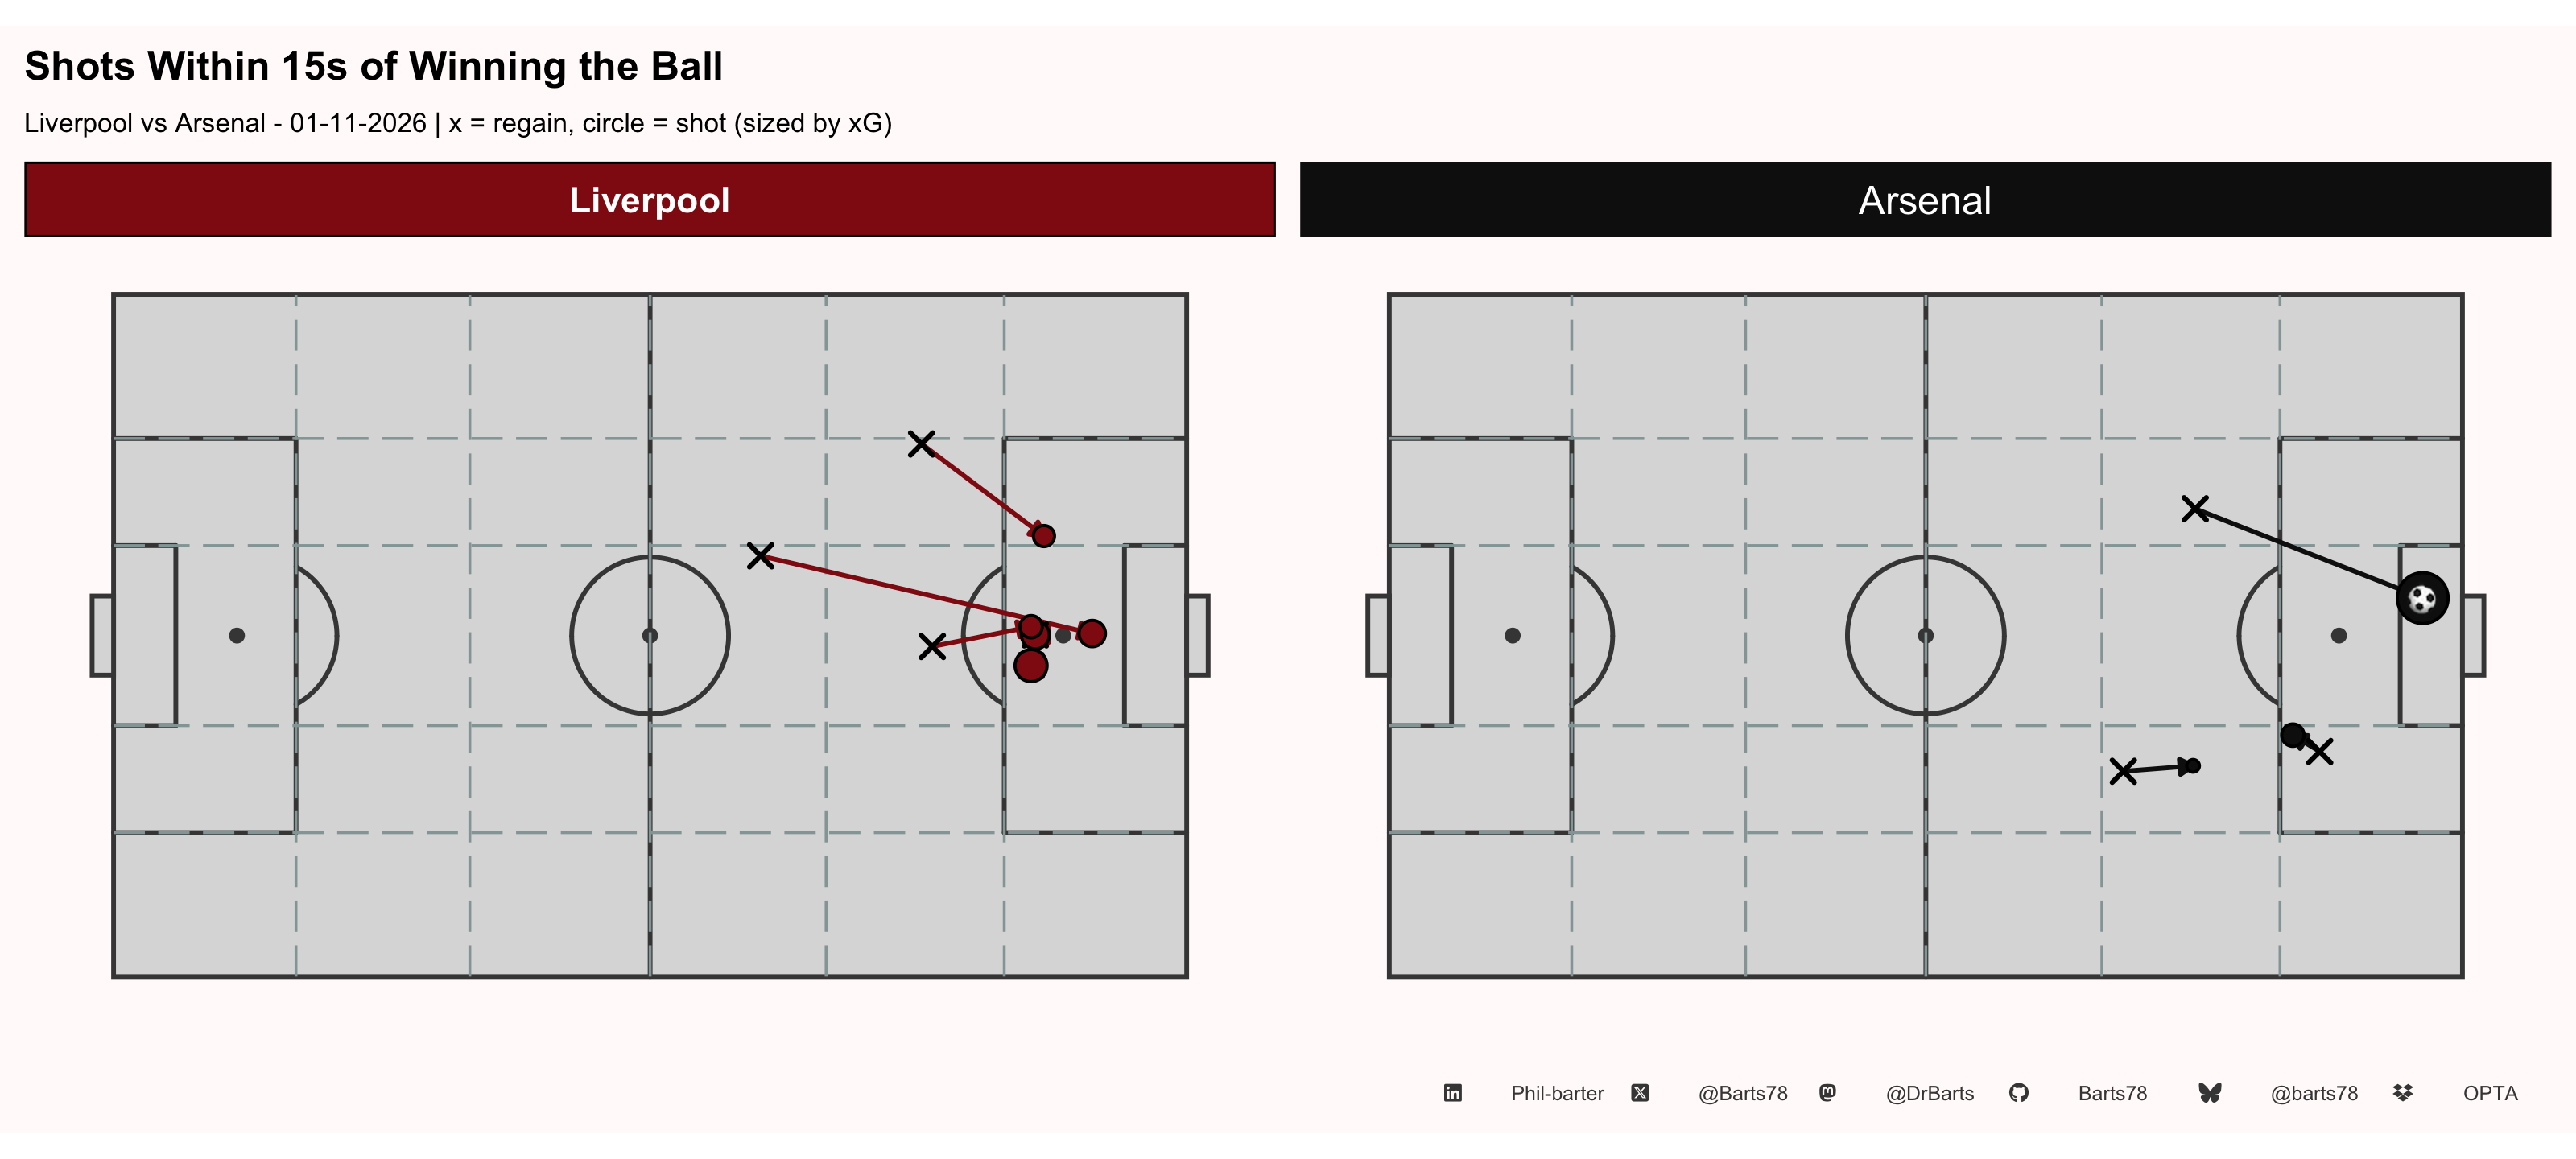
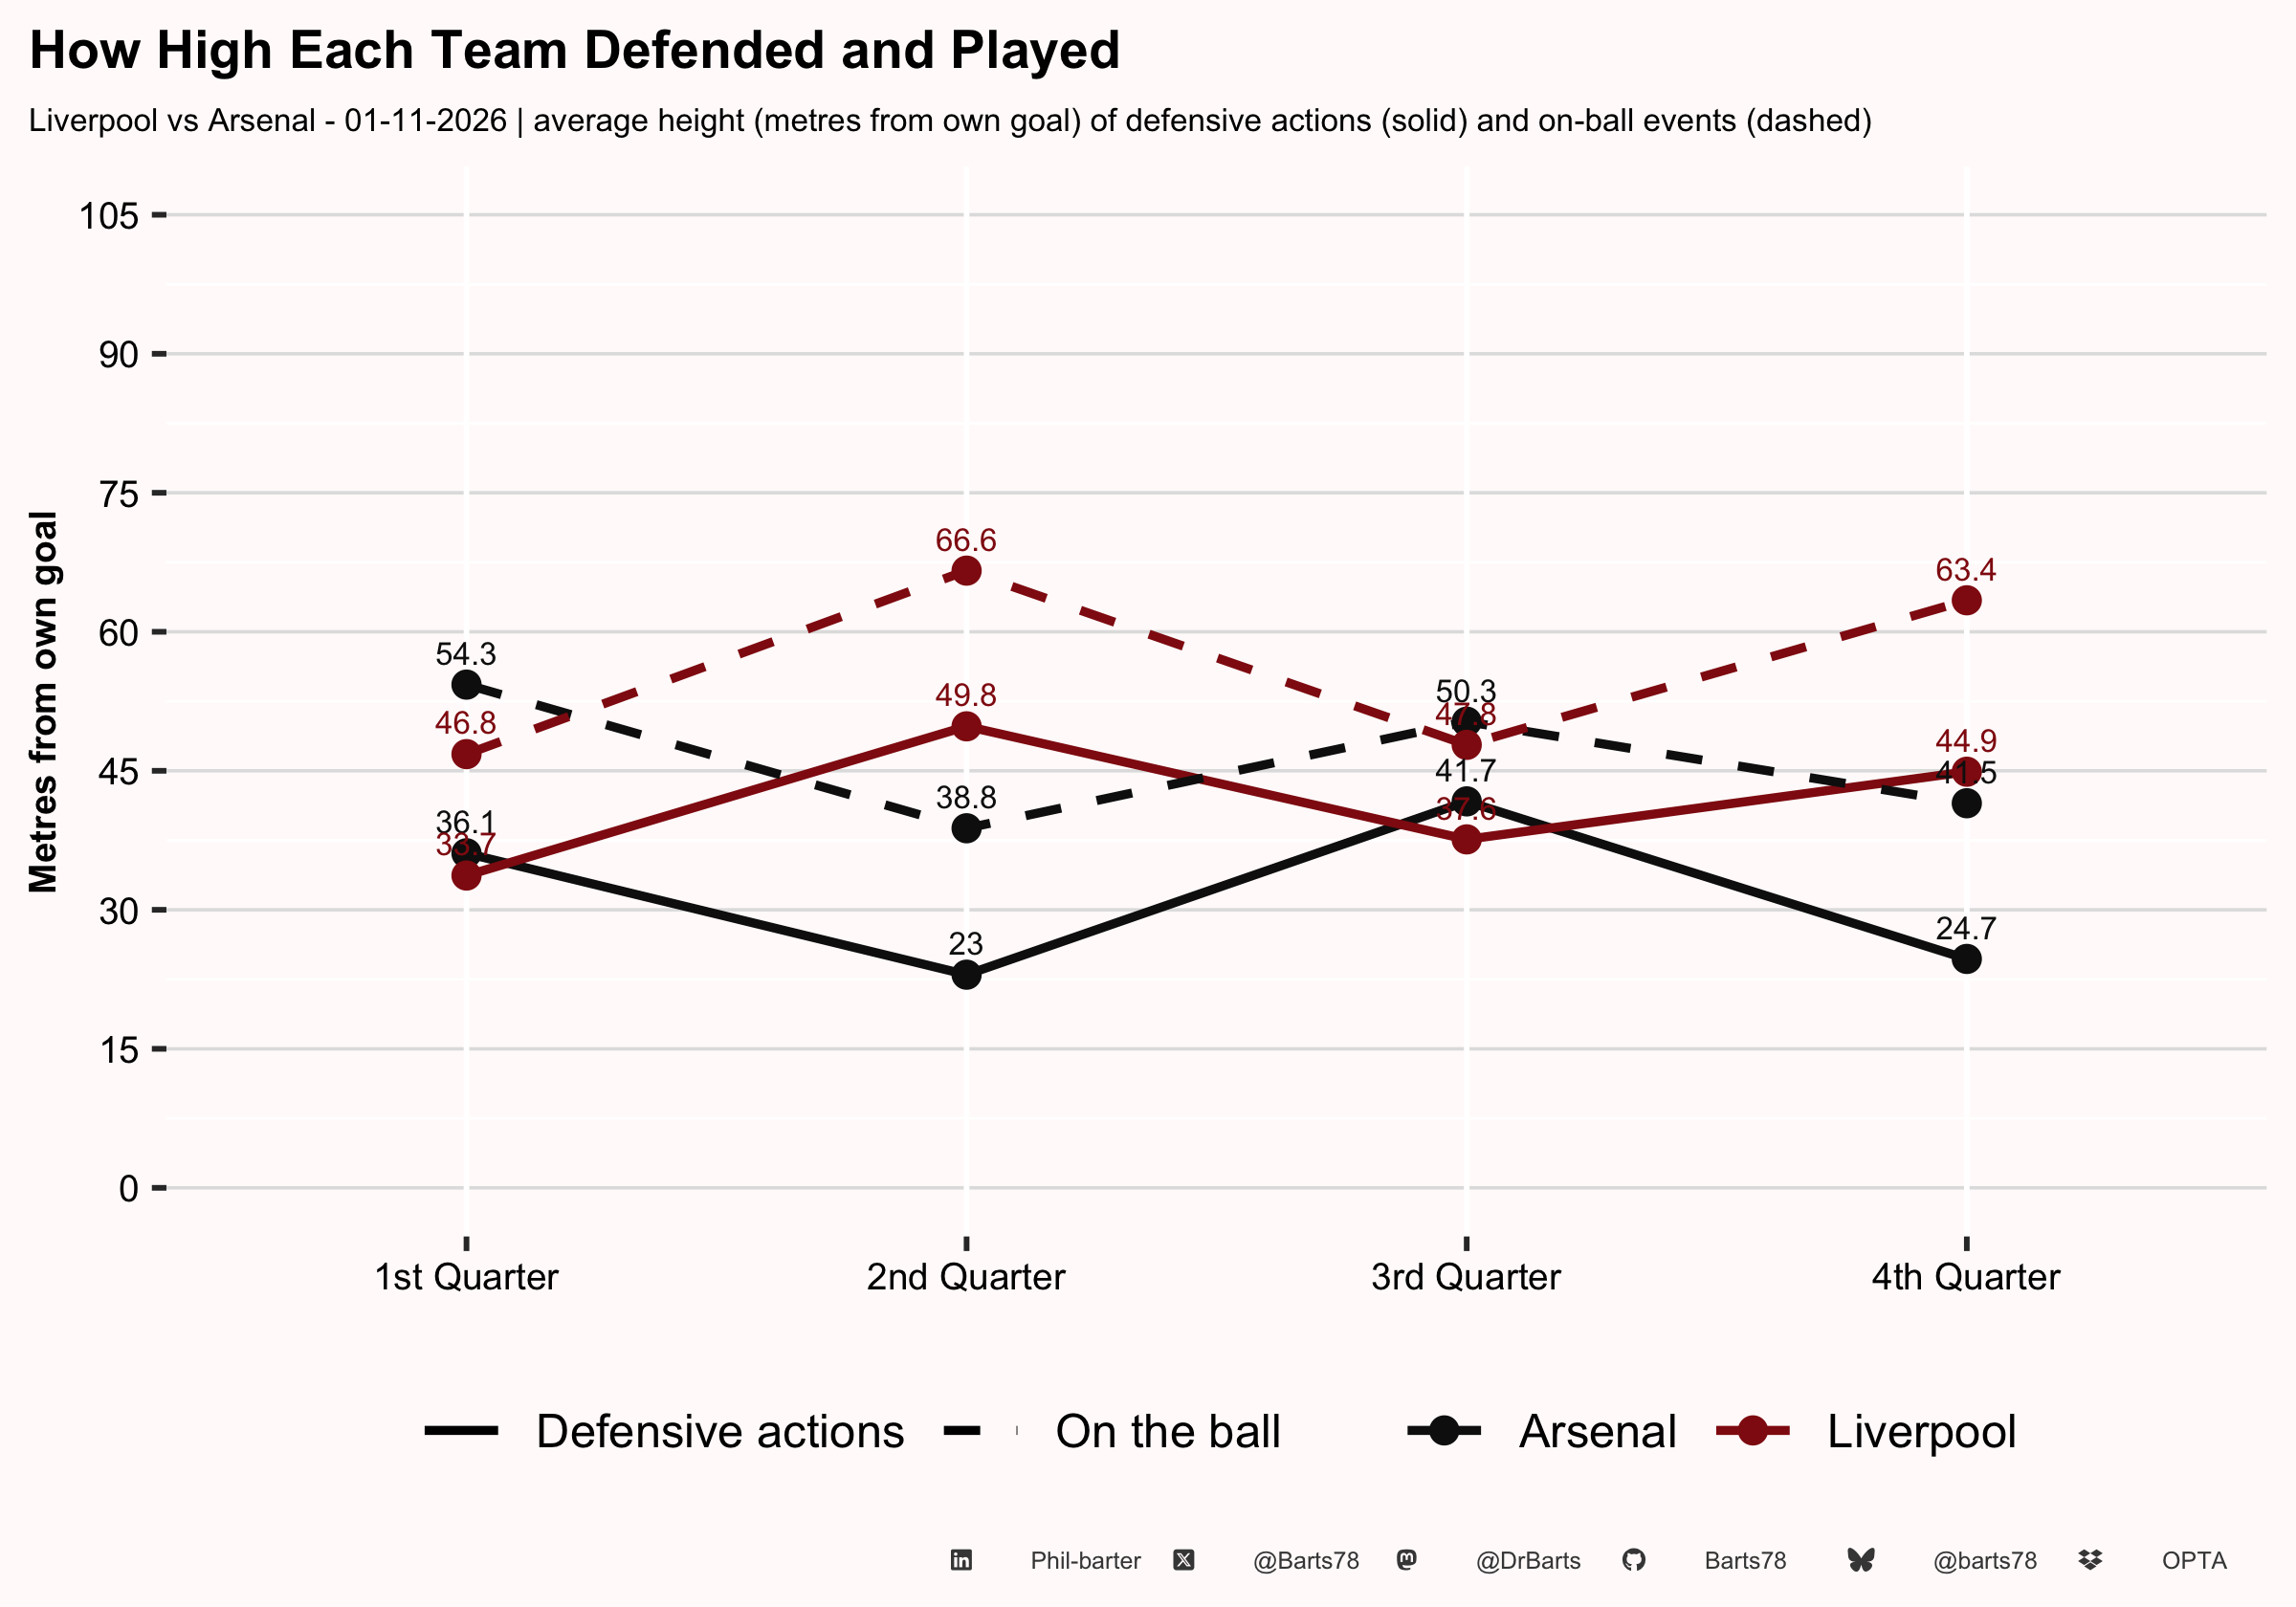
| Defensive Shape by Quarter | ||||||||
| Liverpool vs Arsenal - 01-11-2026 | ||||||||
| Score at start | Def. actions | DA height (m) | Block line (m) | Block depth (m) | Block width (m) | On-ball height (m) | Field tilt % | |
|---|---|---|---|---|---|---|---|---|
| Liverpool | ||||||||
| 1st Quarter | 0-0 | 33 | 33.7 | 30.7 | 63.8 | 54.6 | 46.8 | 27% |
| 2nd Quarter | 0-1 | 27 | 49.8 | 52.2 | 86.9 | 48.1 | 66.6 | 79% |
| 3rd Quarter | 0-1 | 33 | 37.6 | 34.1 | 82.9 | 65.8 | 47.8 | 45% |
| 4th Quarter | 0-1 | 28 | 44.9 | 44.9 | 98.4 | 49.9 | 63.4 | 79% |
| Arsenal | ||||||||
| 1st Quarter | 0-0 | 29 | 36.1 | 34.6 | 79.7 | 49.9 | 54.3 | 73% |
| 2nd Quarter | 0-1 | 33 | 23.0 | 16.2 | 31.3 | 27.8 | 38.8 | 21% |
| 3rd Quarter | 0-1 | 30 | 41.7 | 35.3 | 91.8 | 61.5 | 50.3 | 55% |
| 4th Quarter | 0-1 | 32 | 24.7 | 18.4 | 29.4 | 65.4 | 41.5 | 21% |
| Block line / depth / width use the median +/- 1.5 MAD of defensive-action positions (block line = median). DA height = mean position. Higher = defending further up the pitch. | ||||||||
| X @Barts78 · Bluesky @barts78 · Mastodon @DrBarts · GitHub Barts78 · LinkedIn Phil-barter · Data: Opta | ||||||||
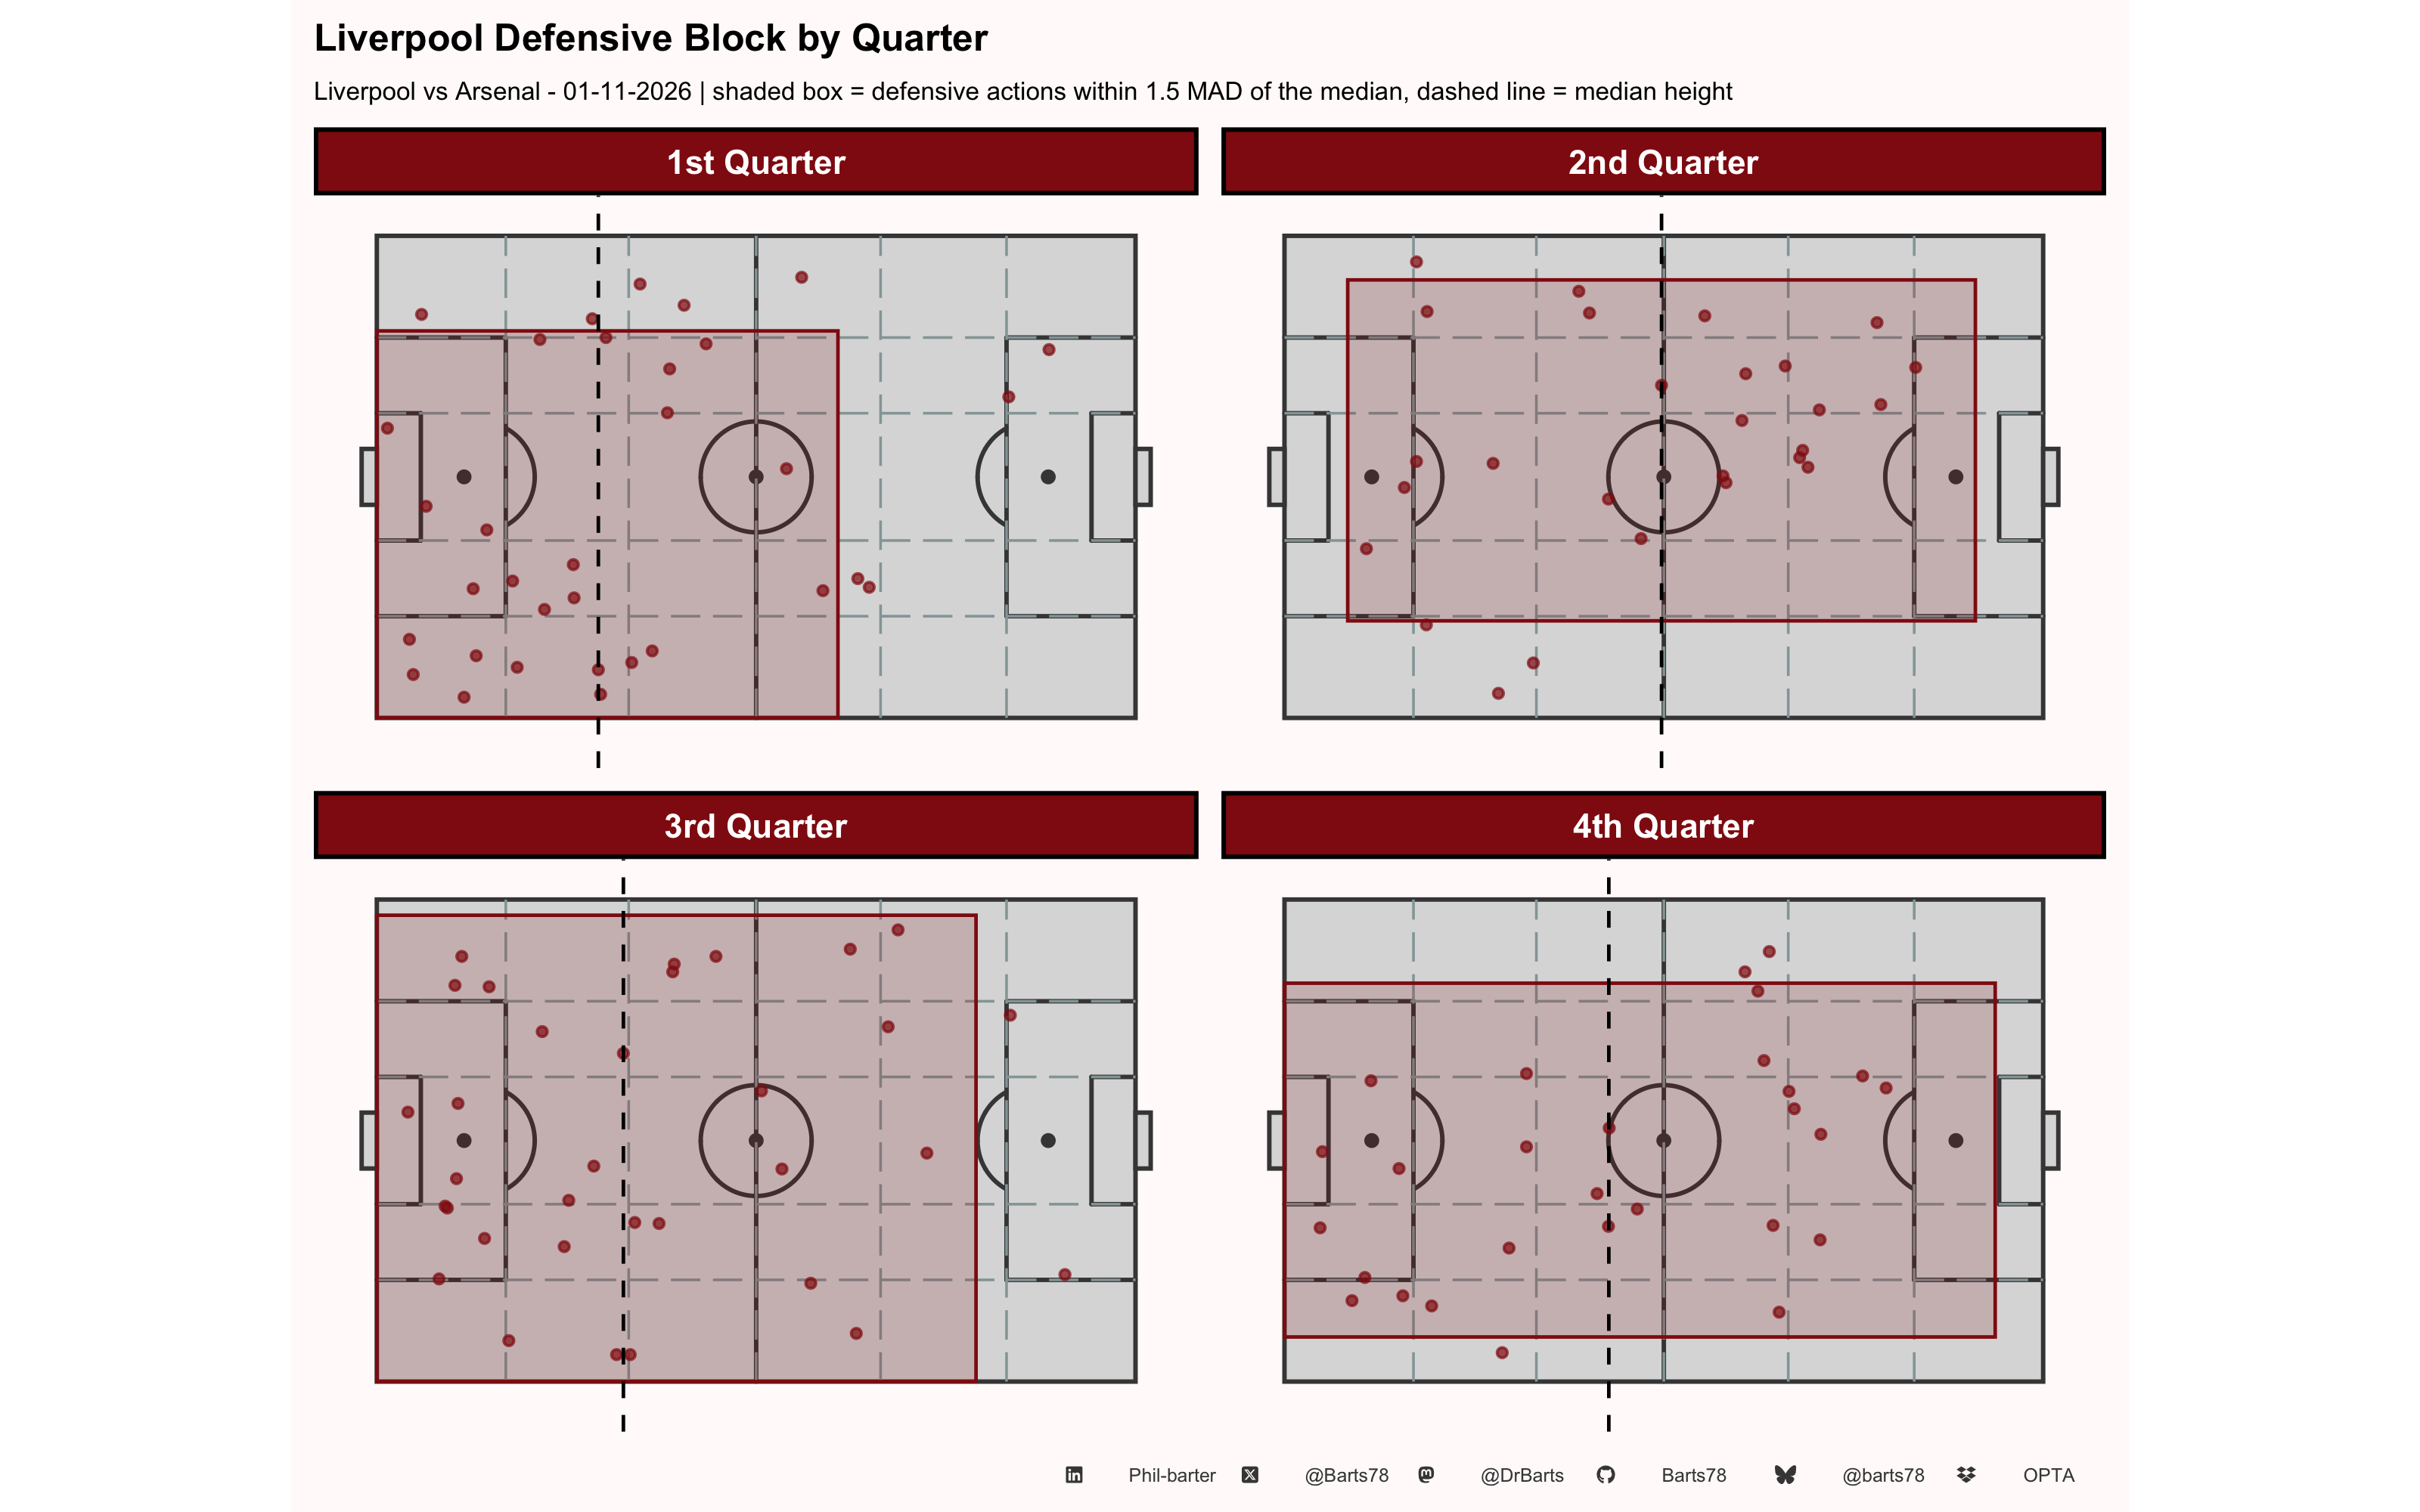
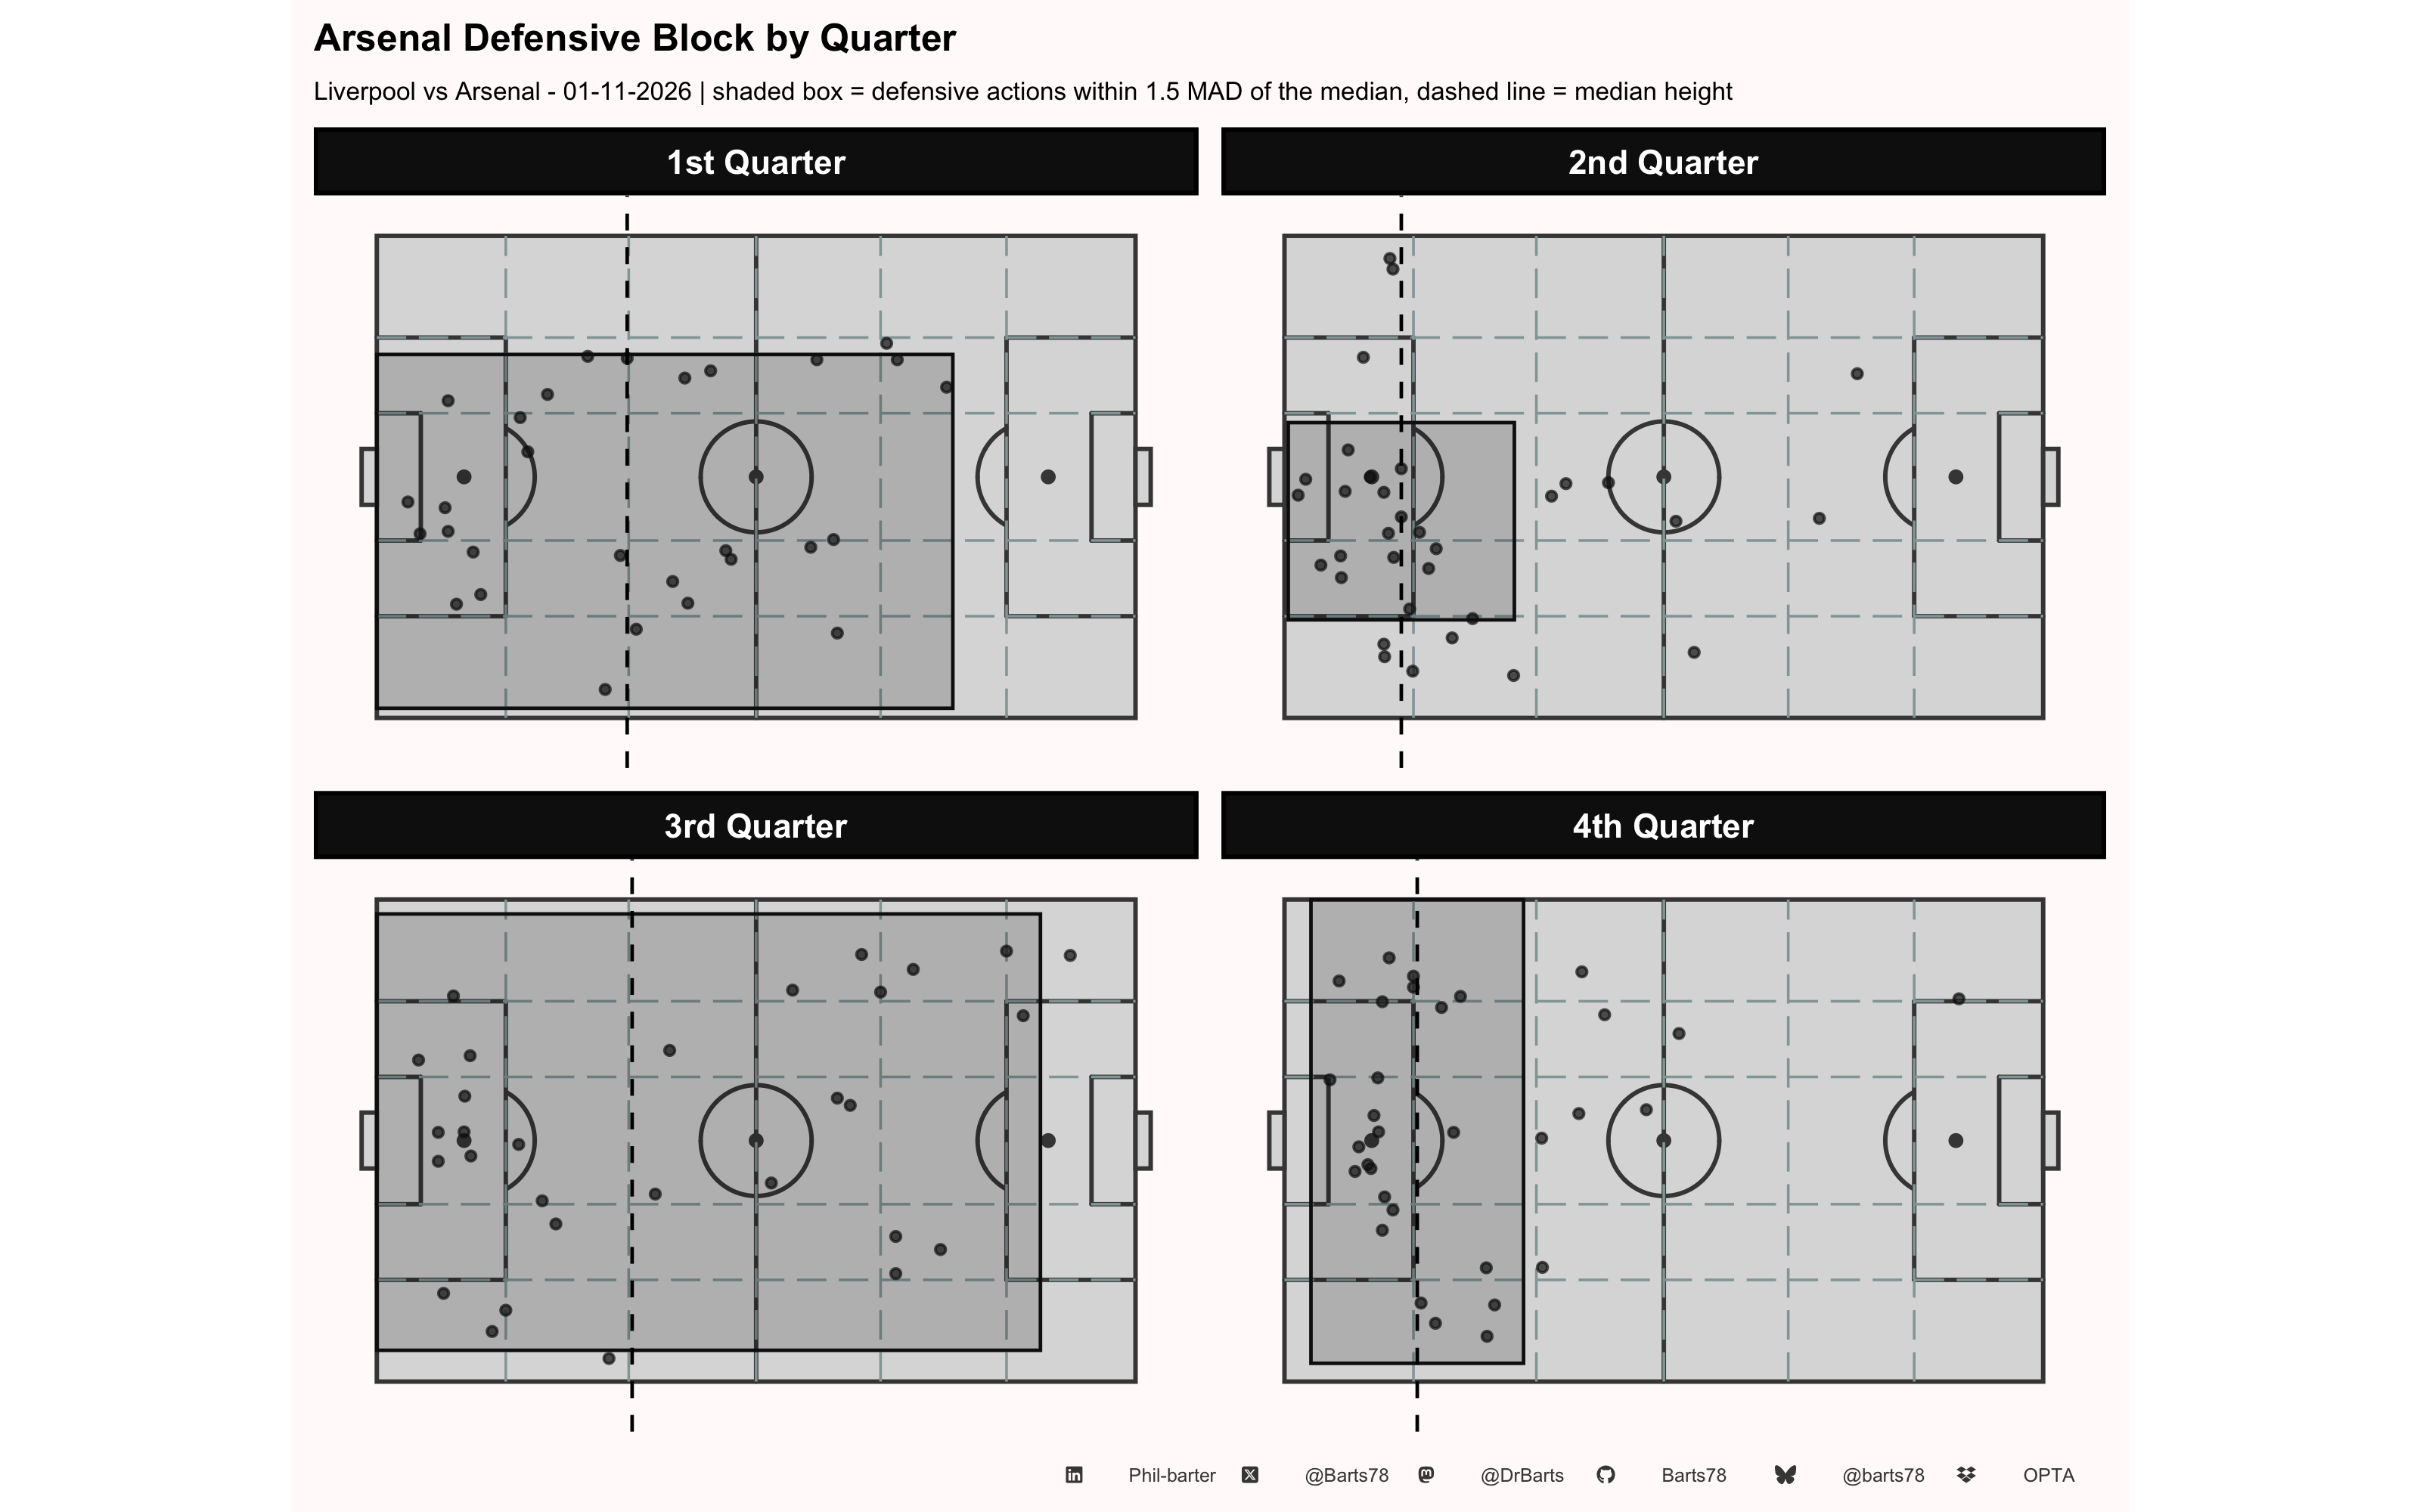
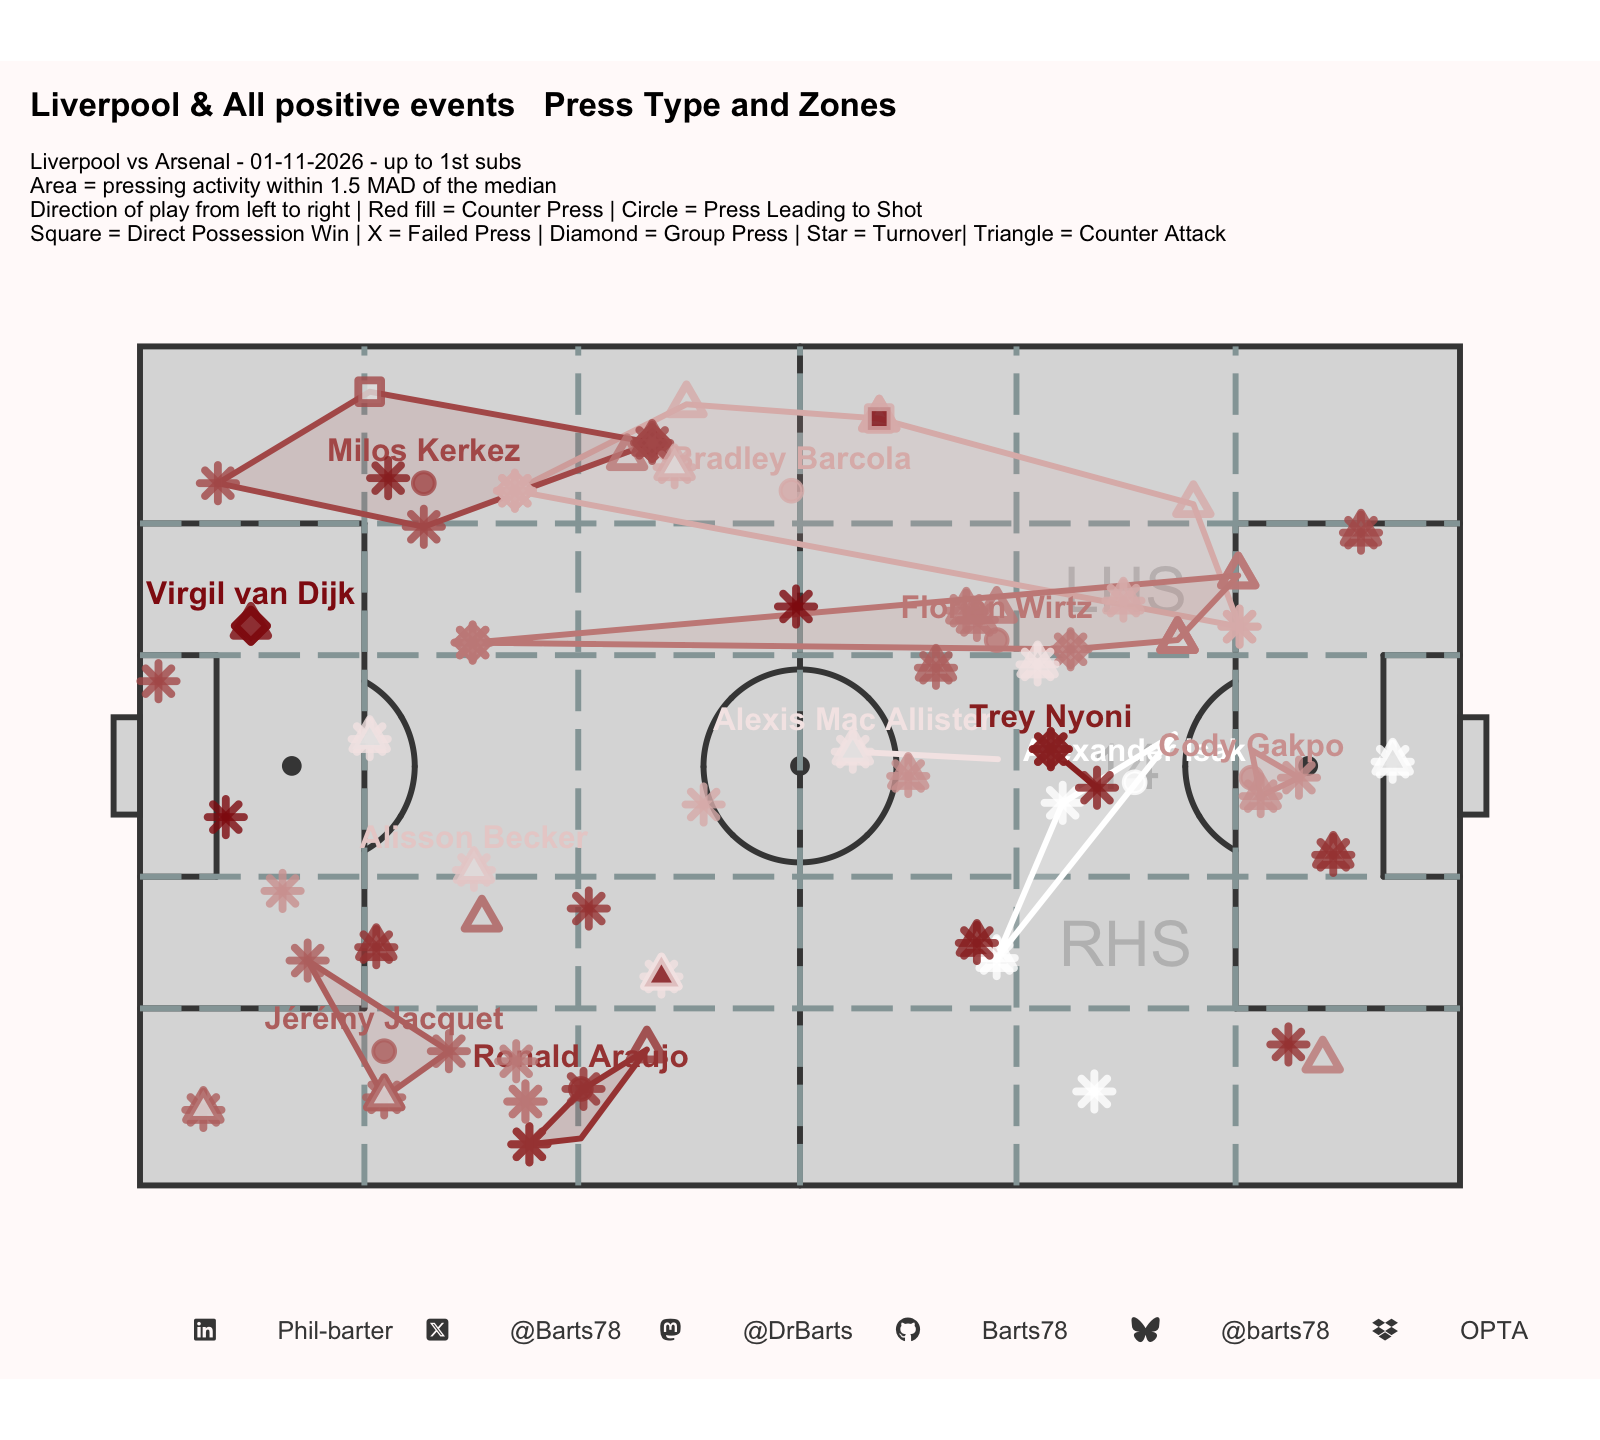
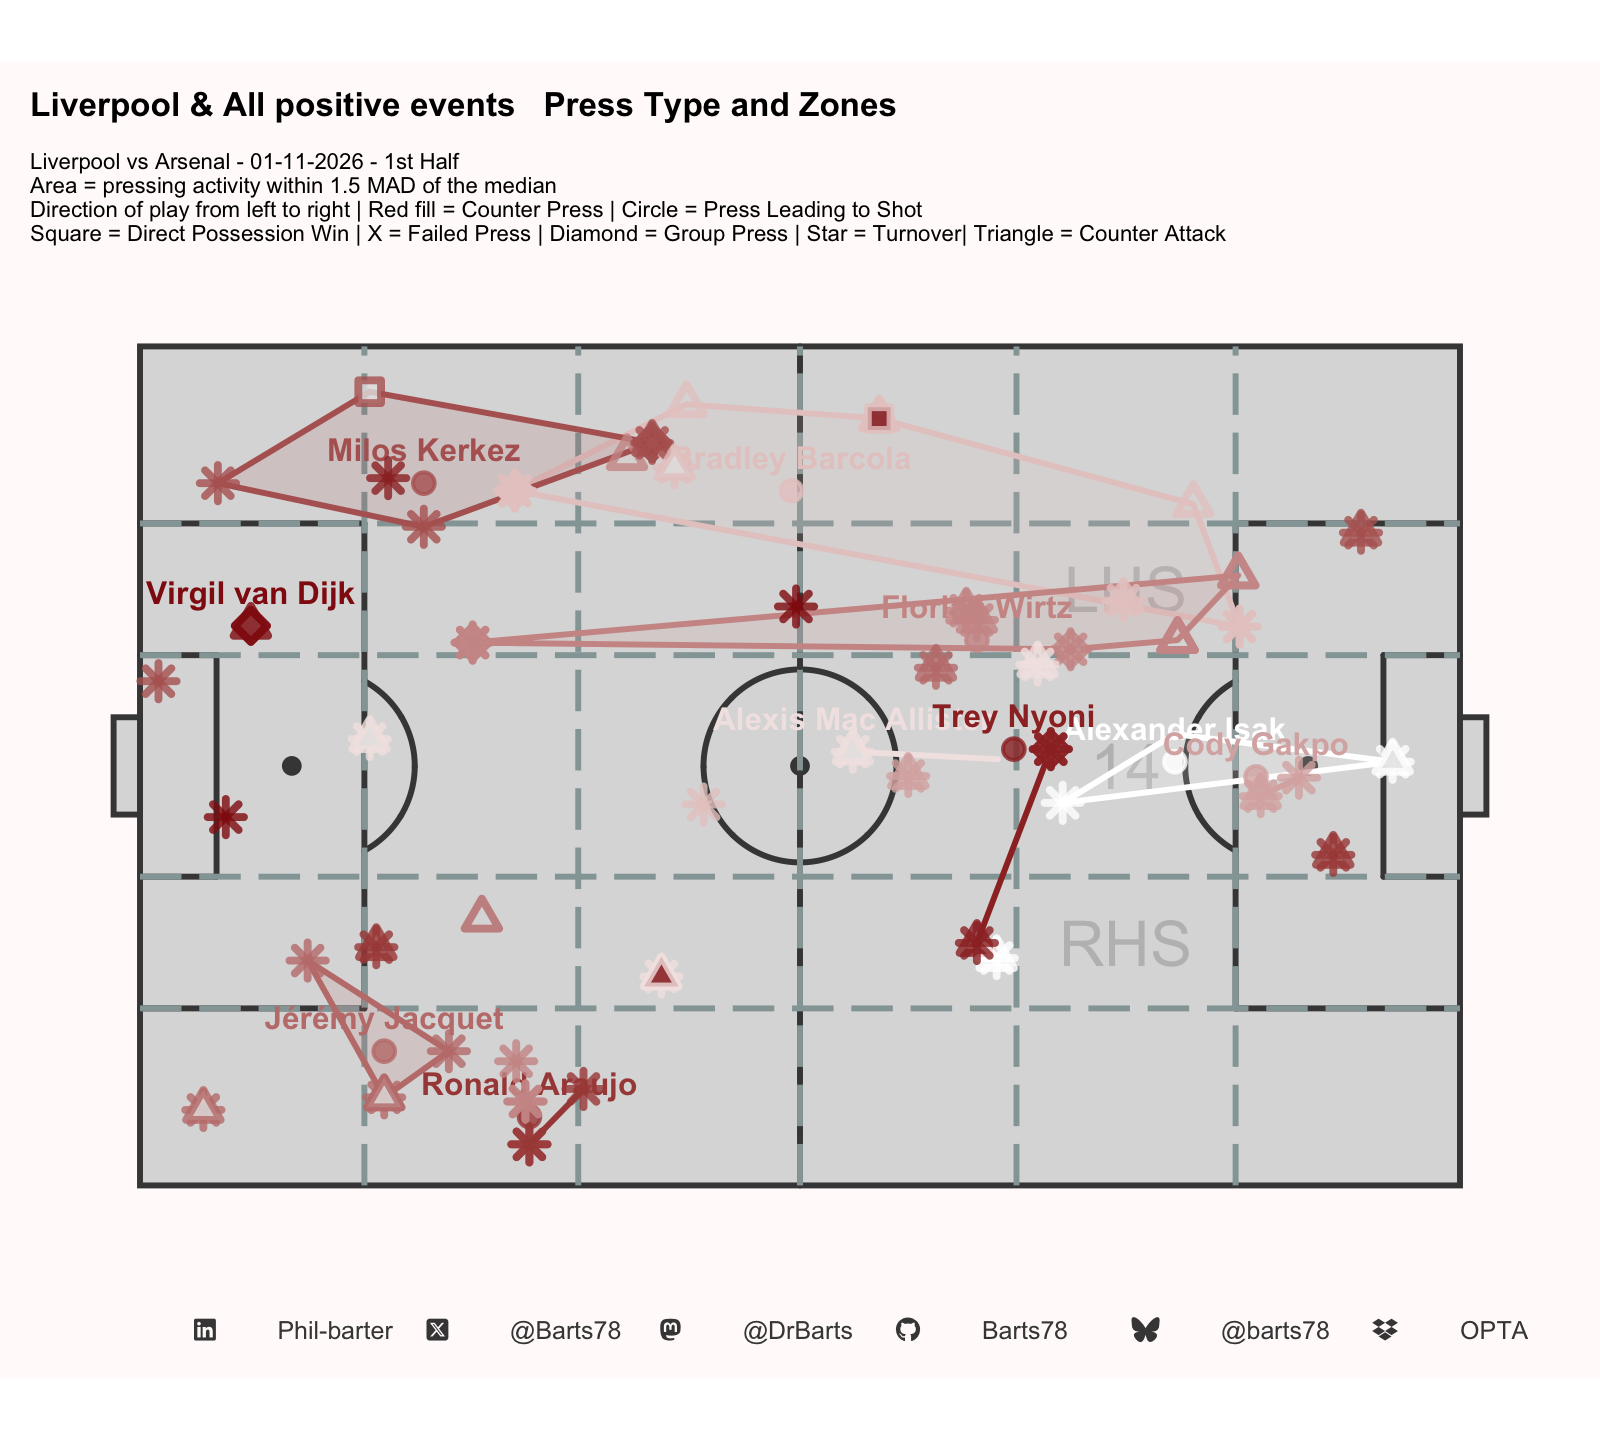
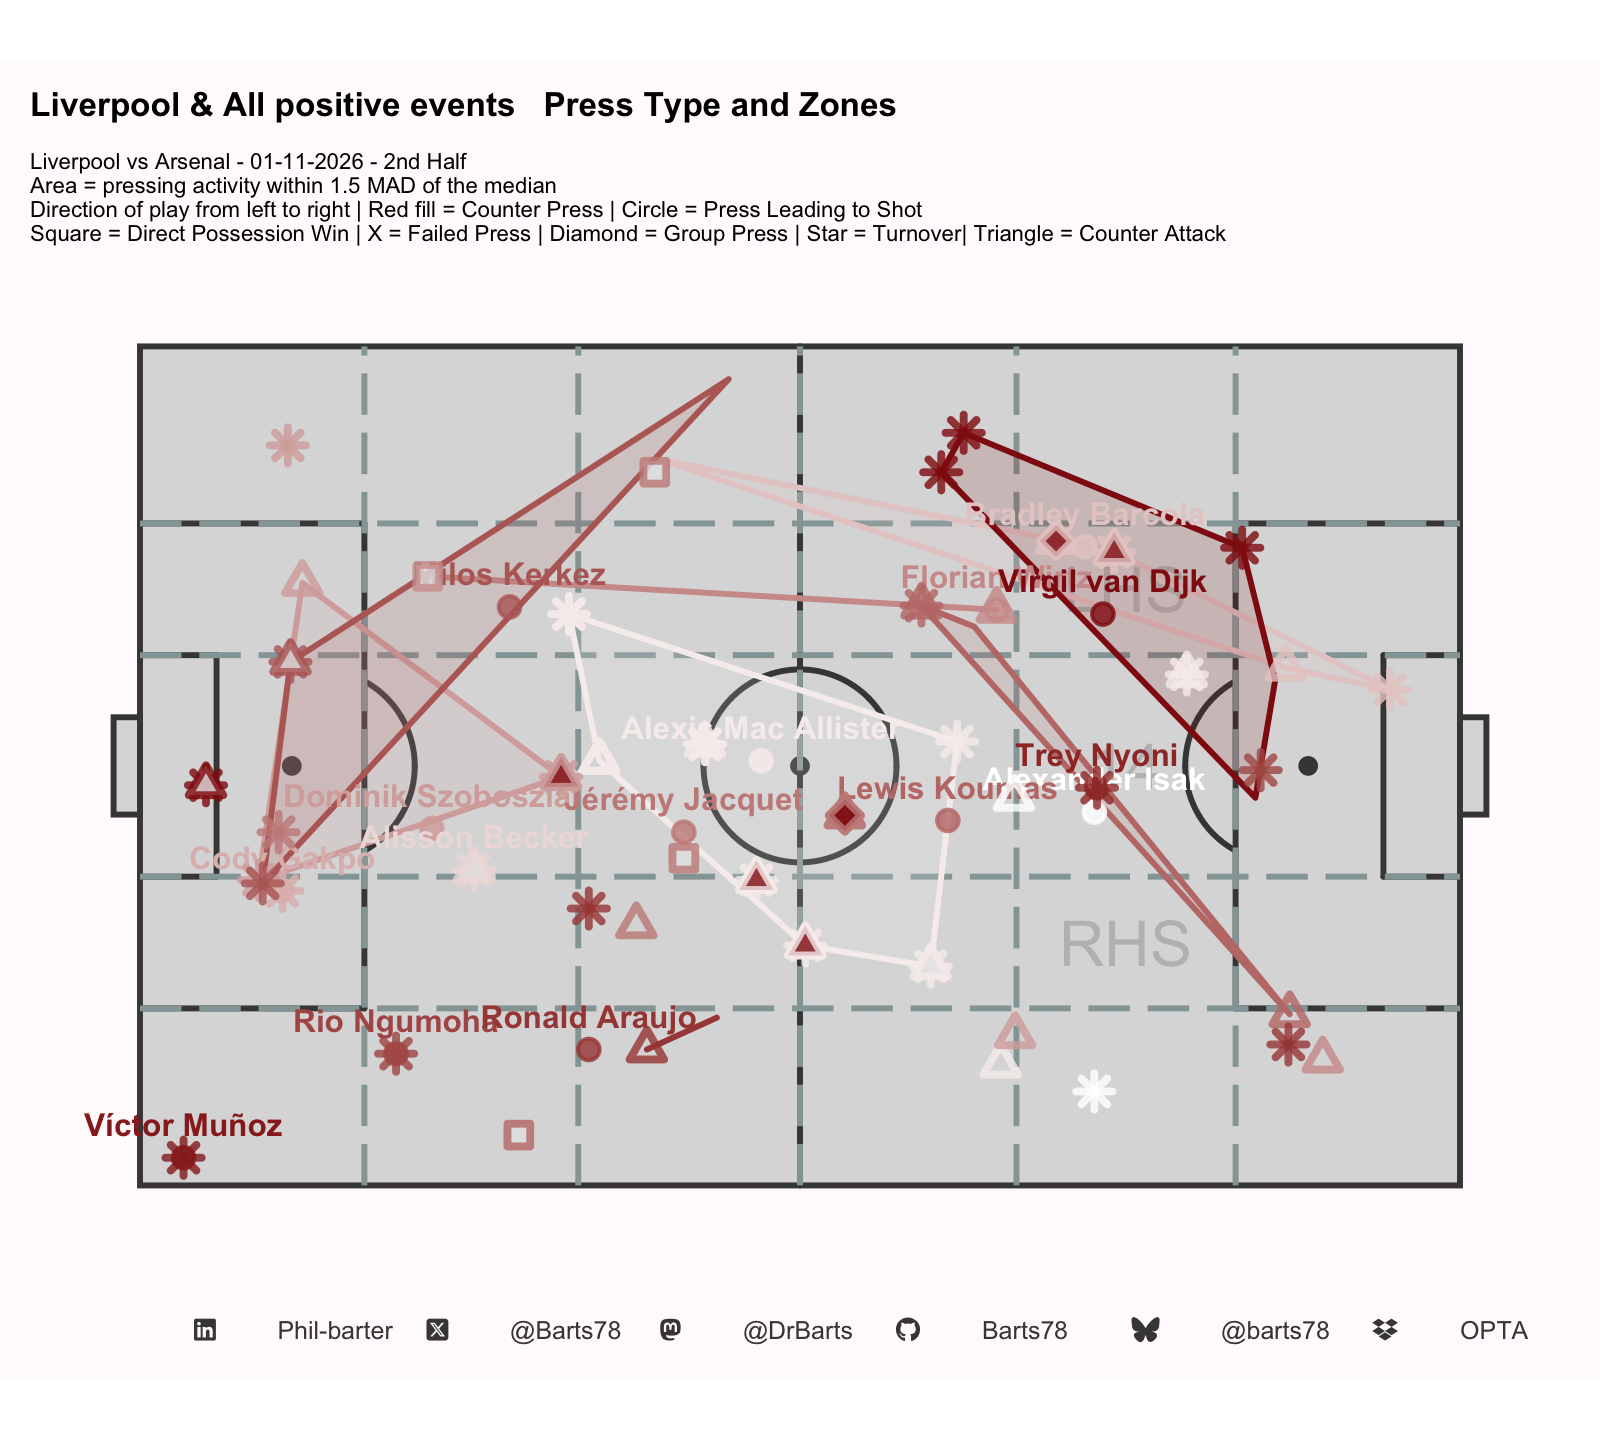
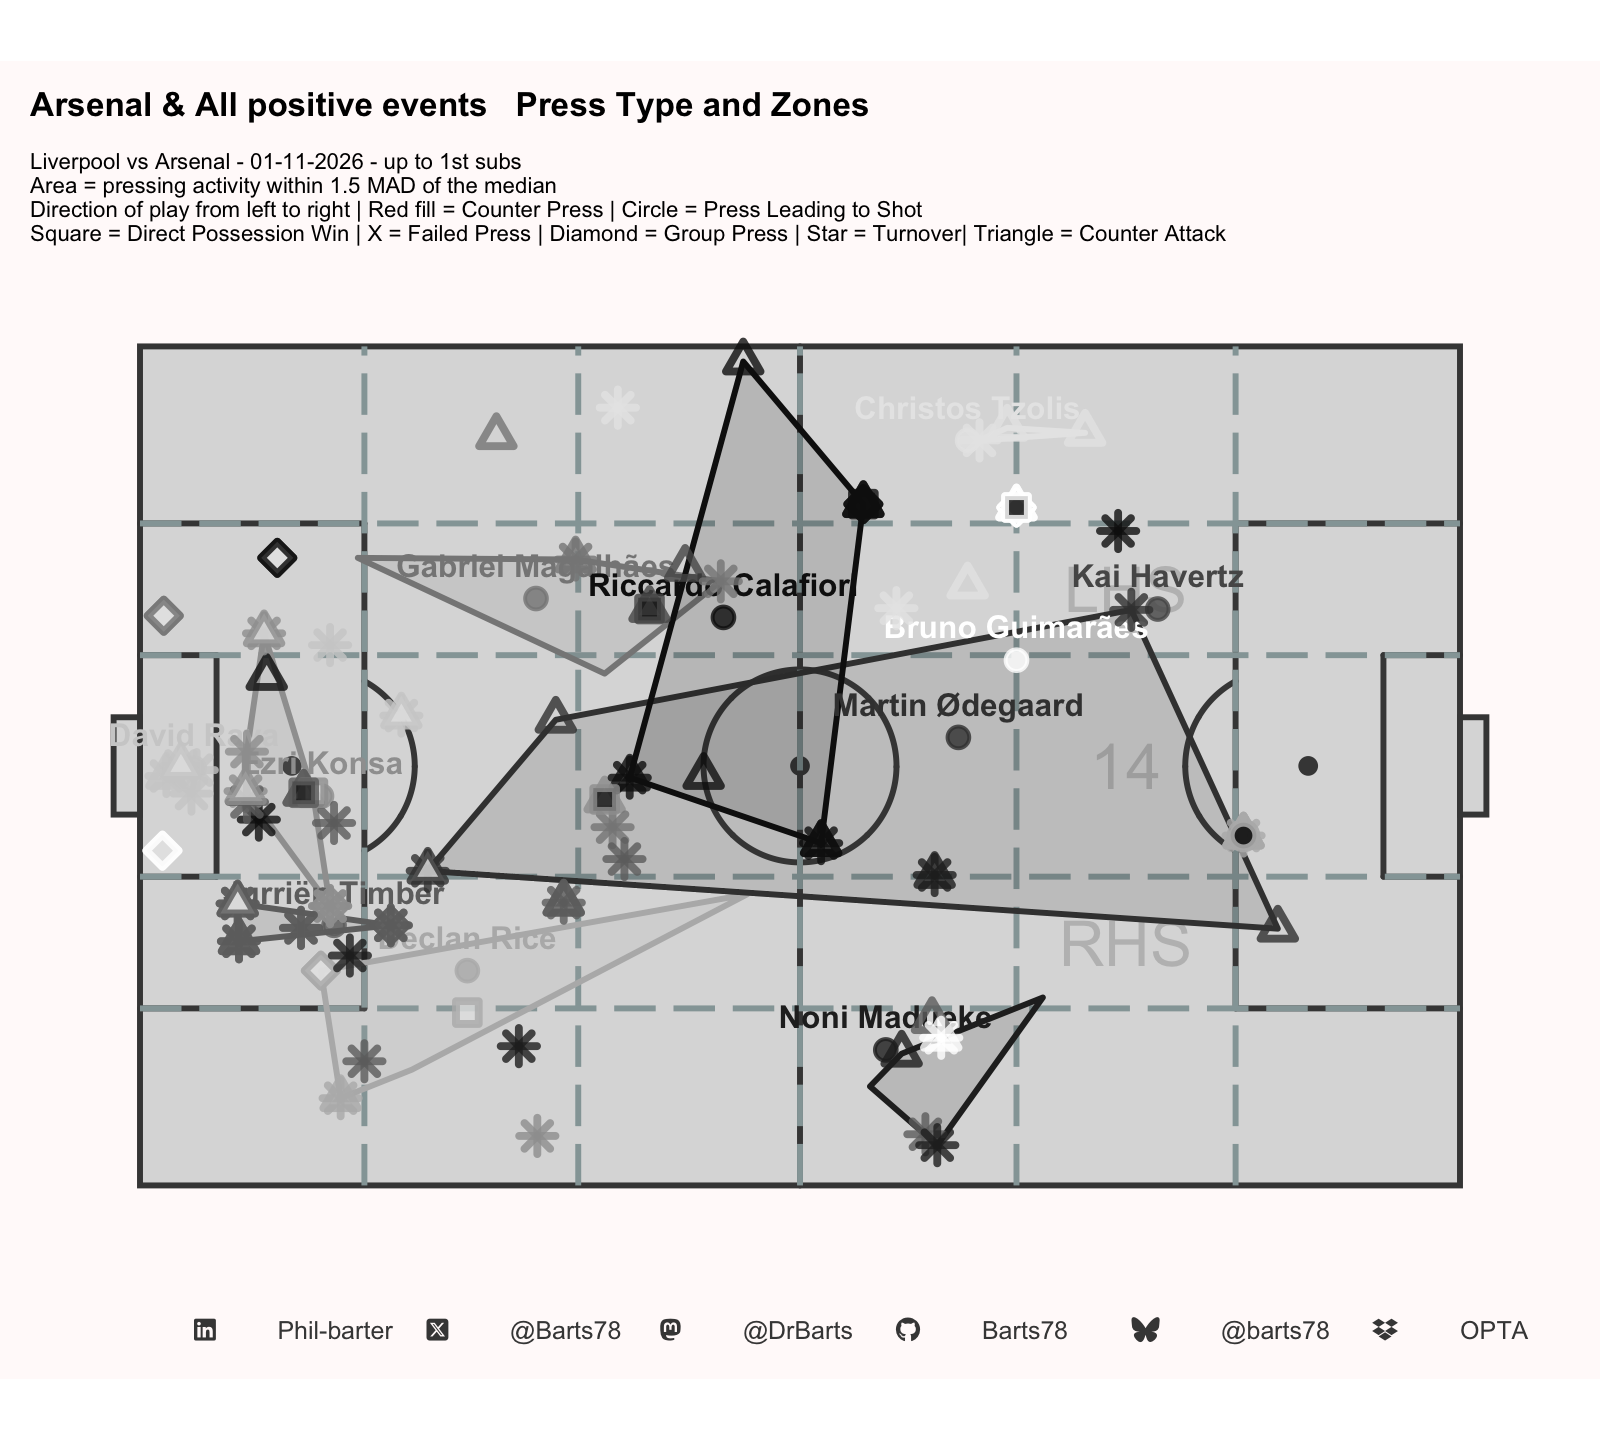
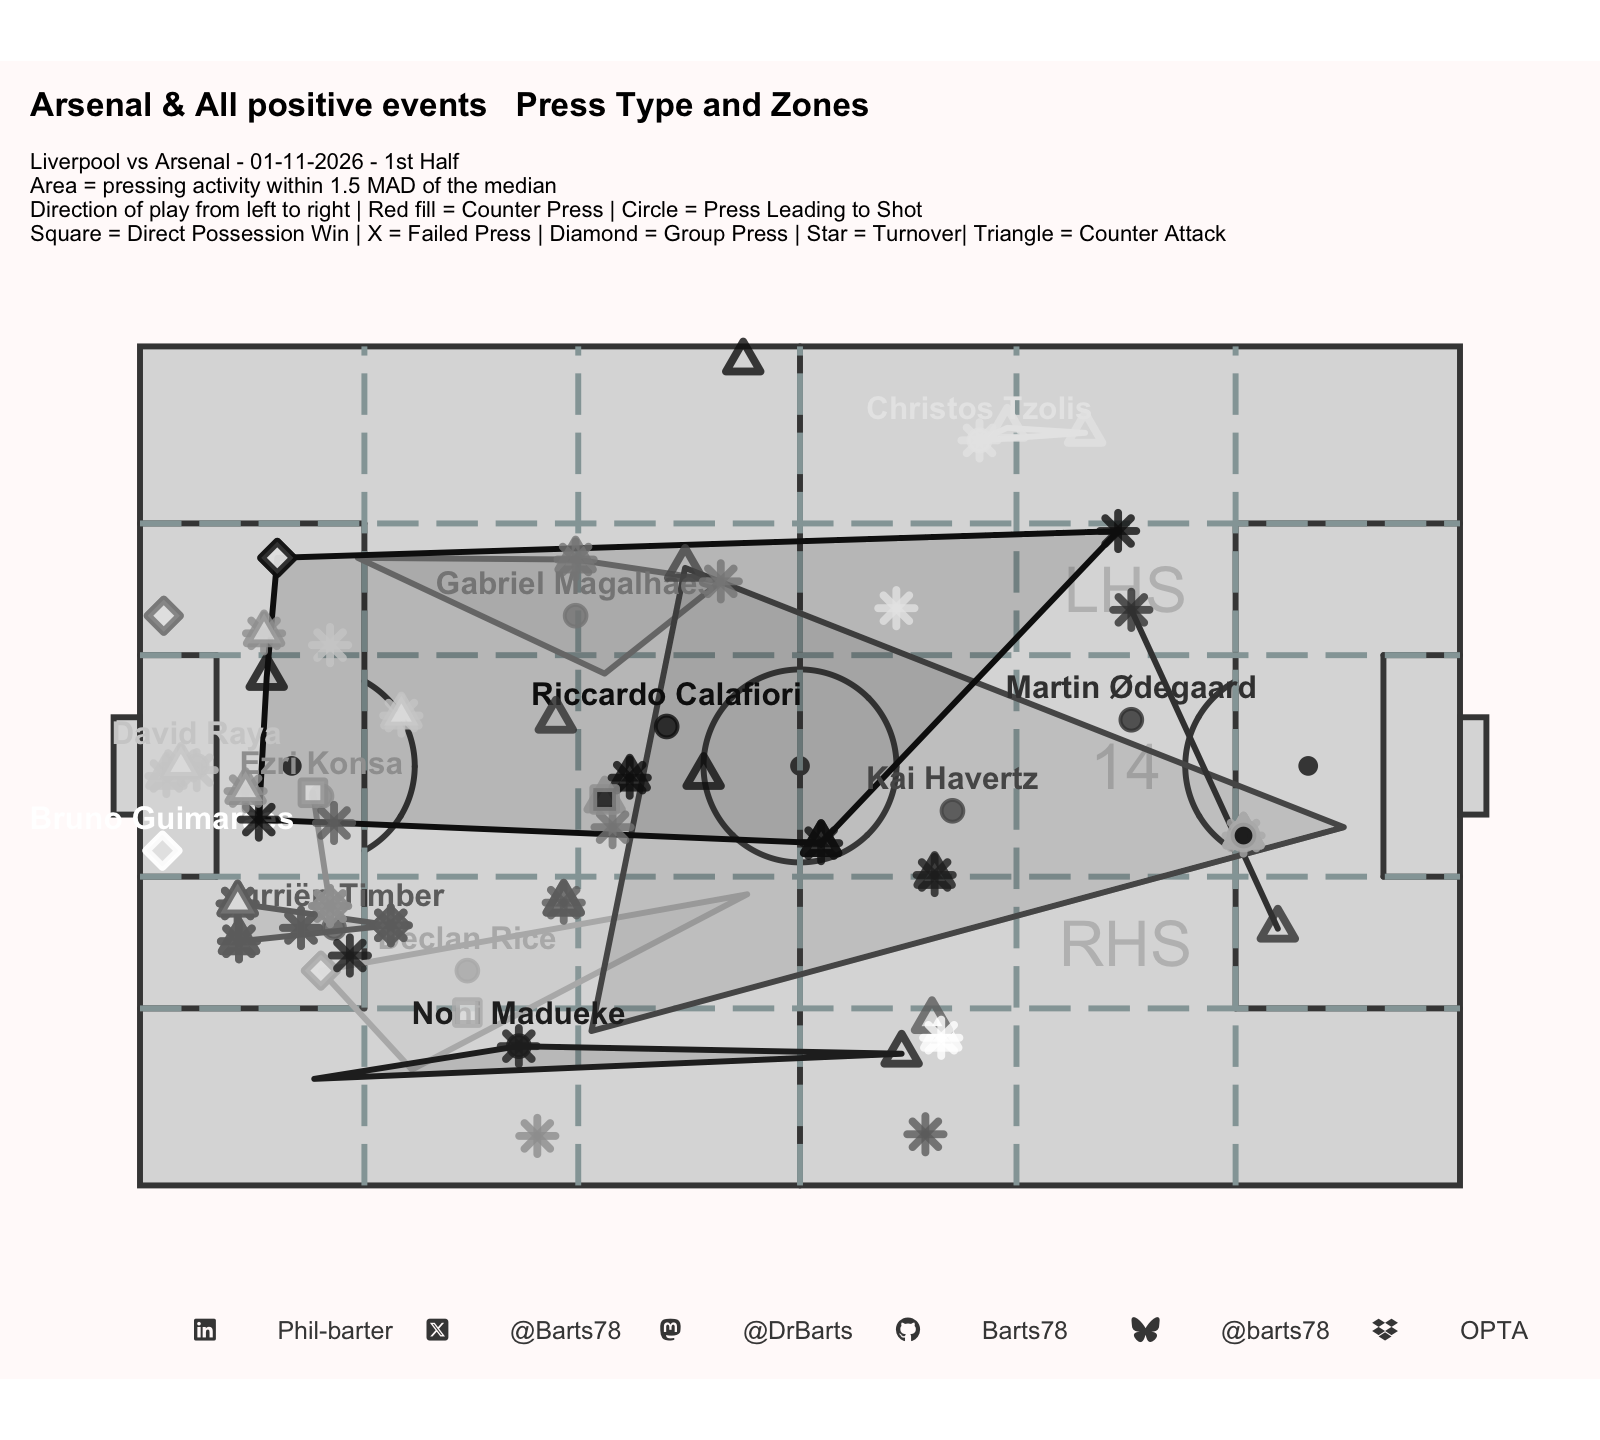
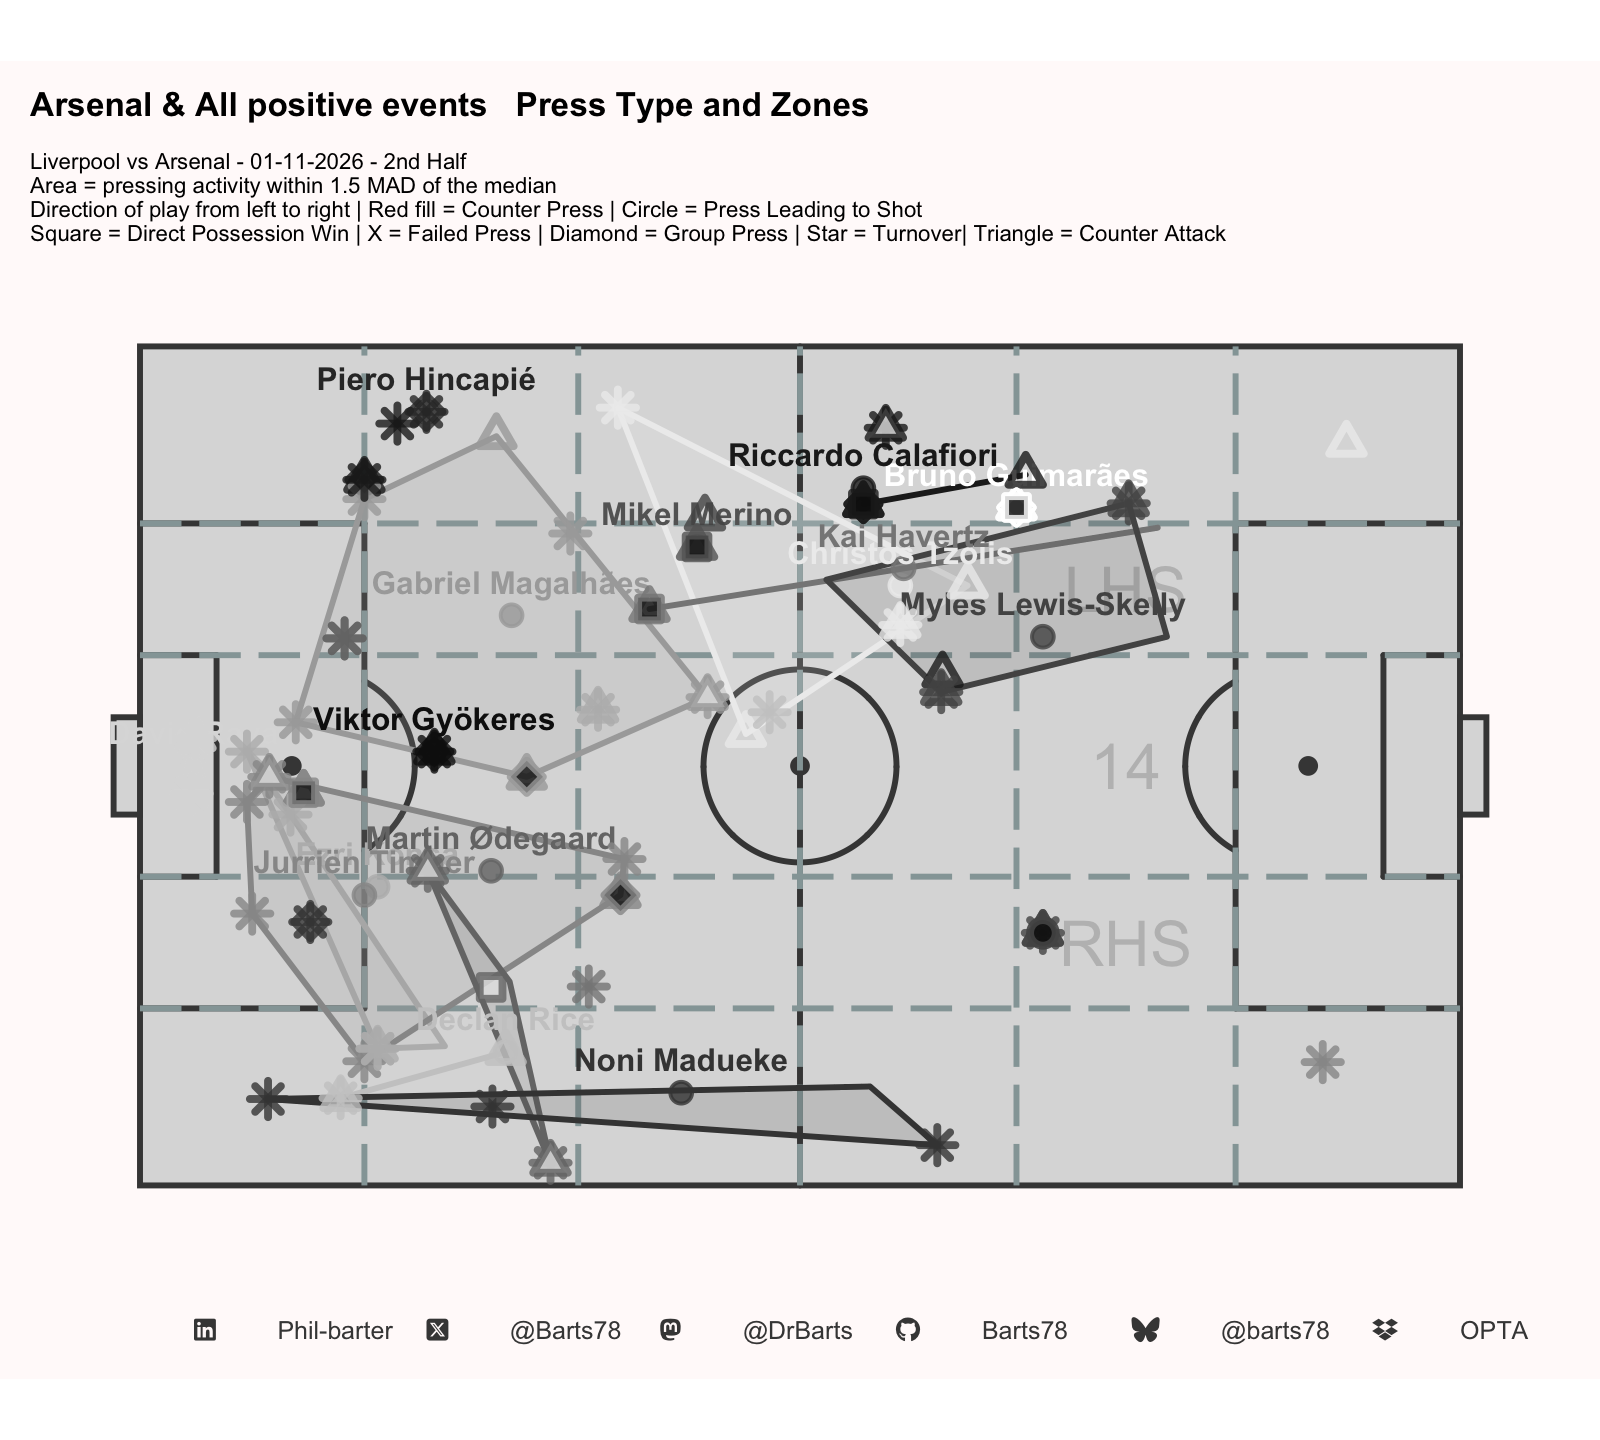
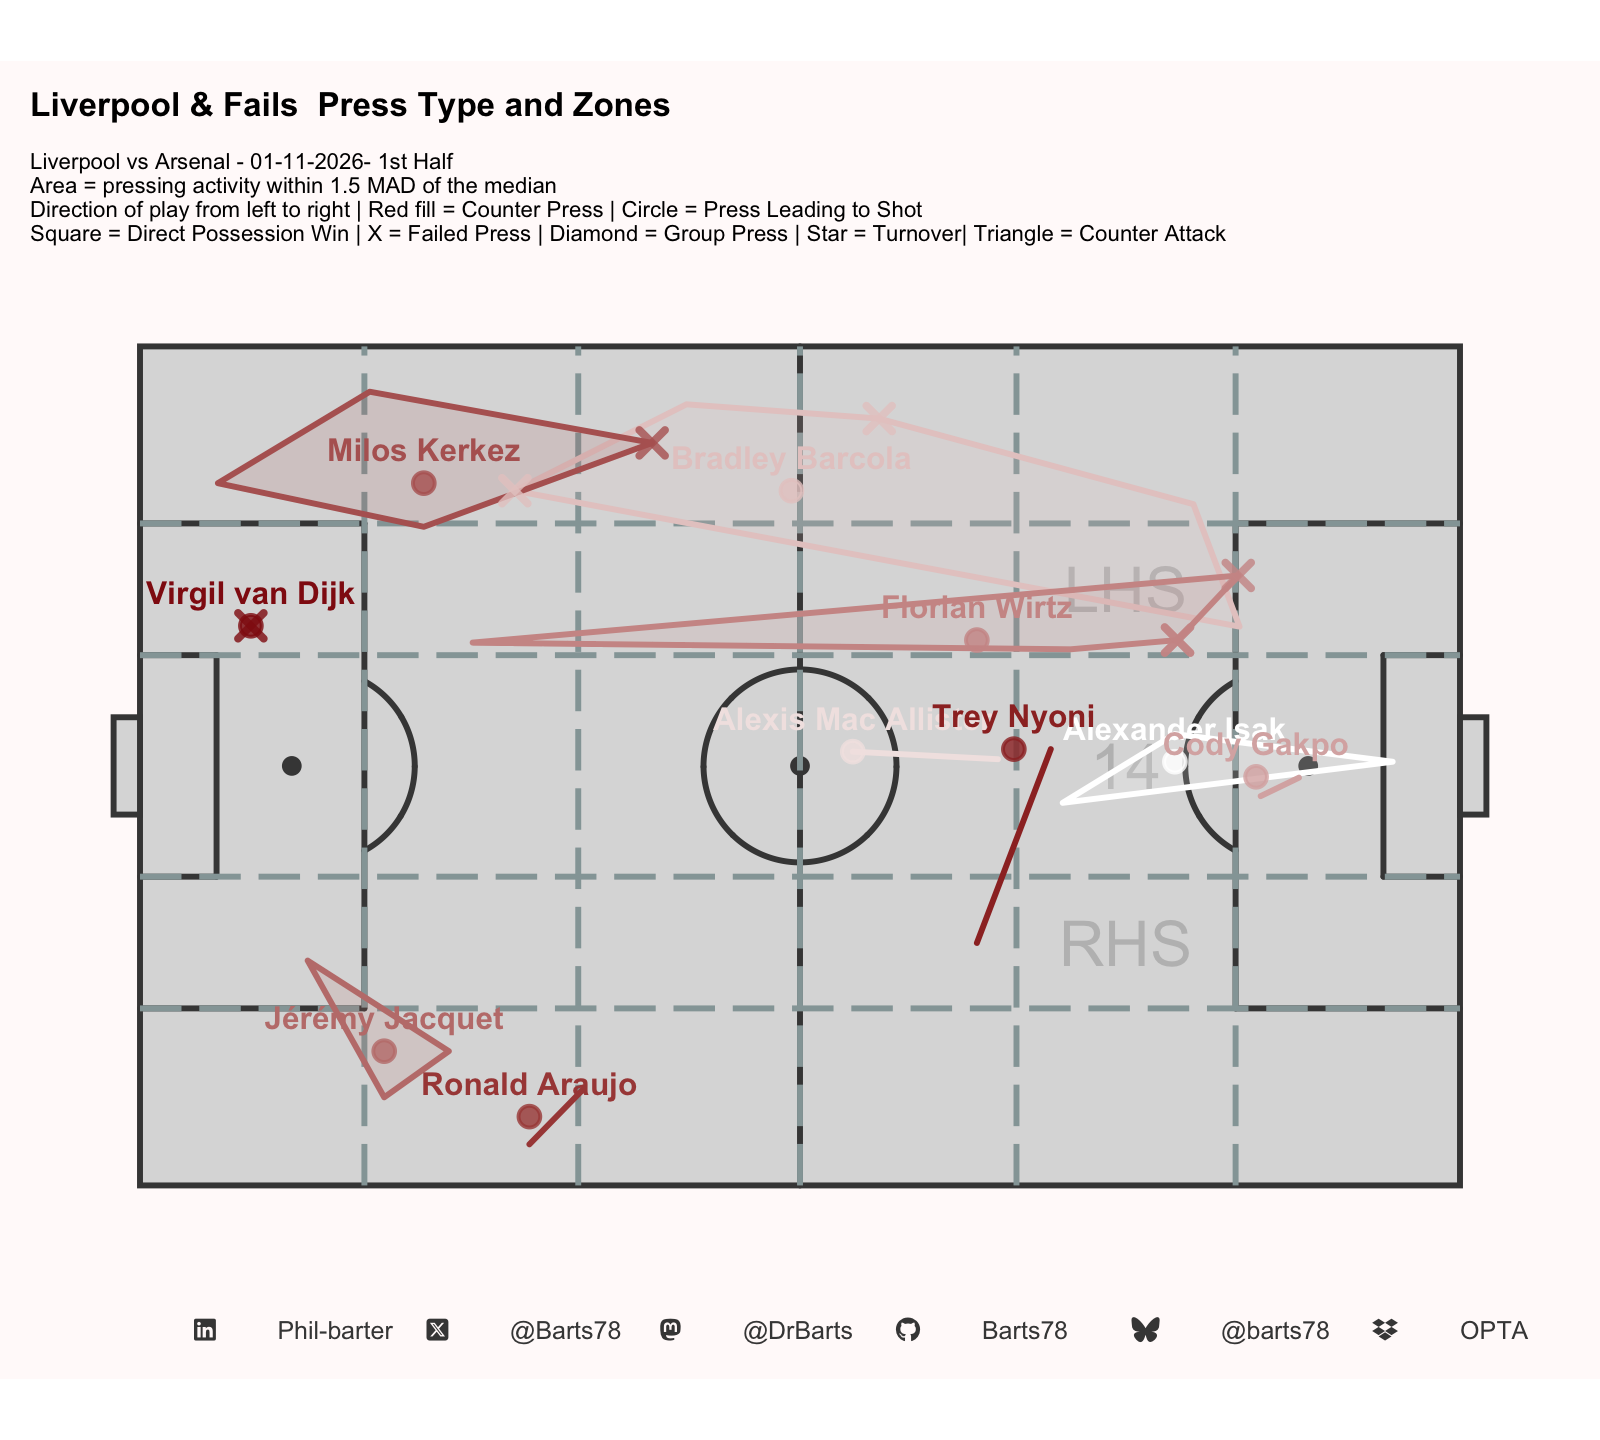
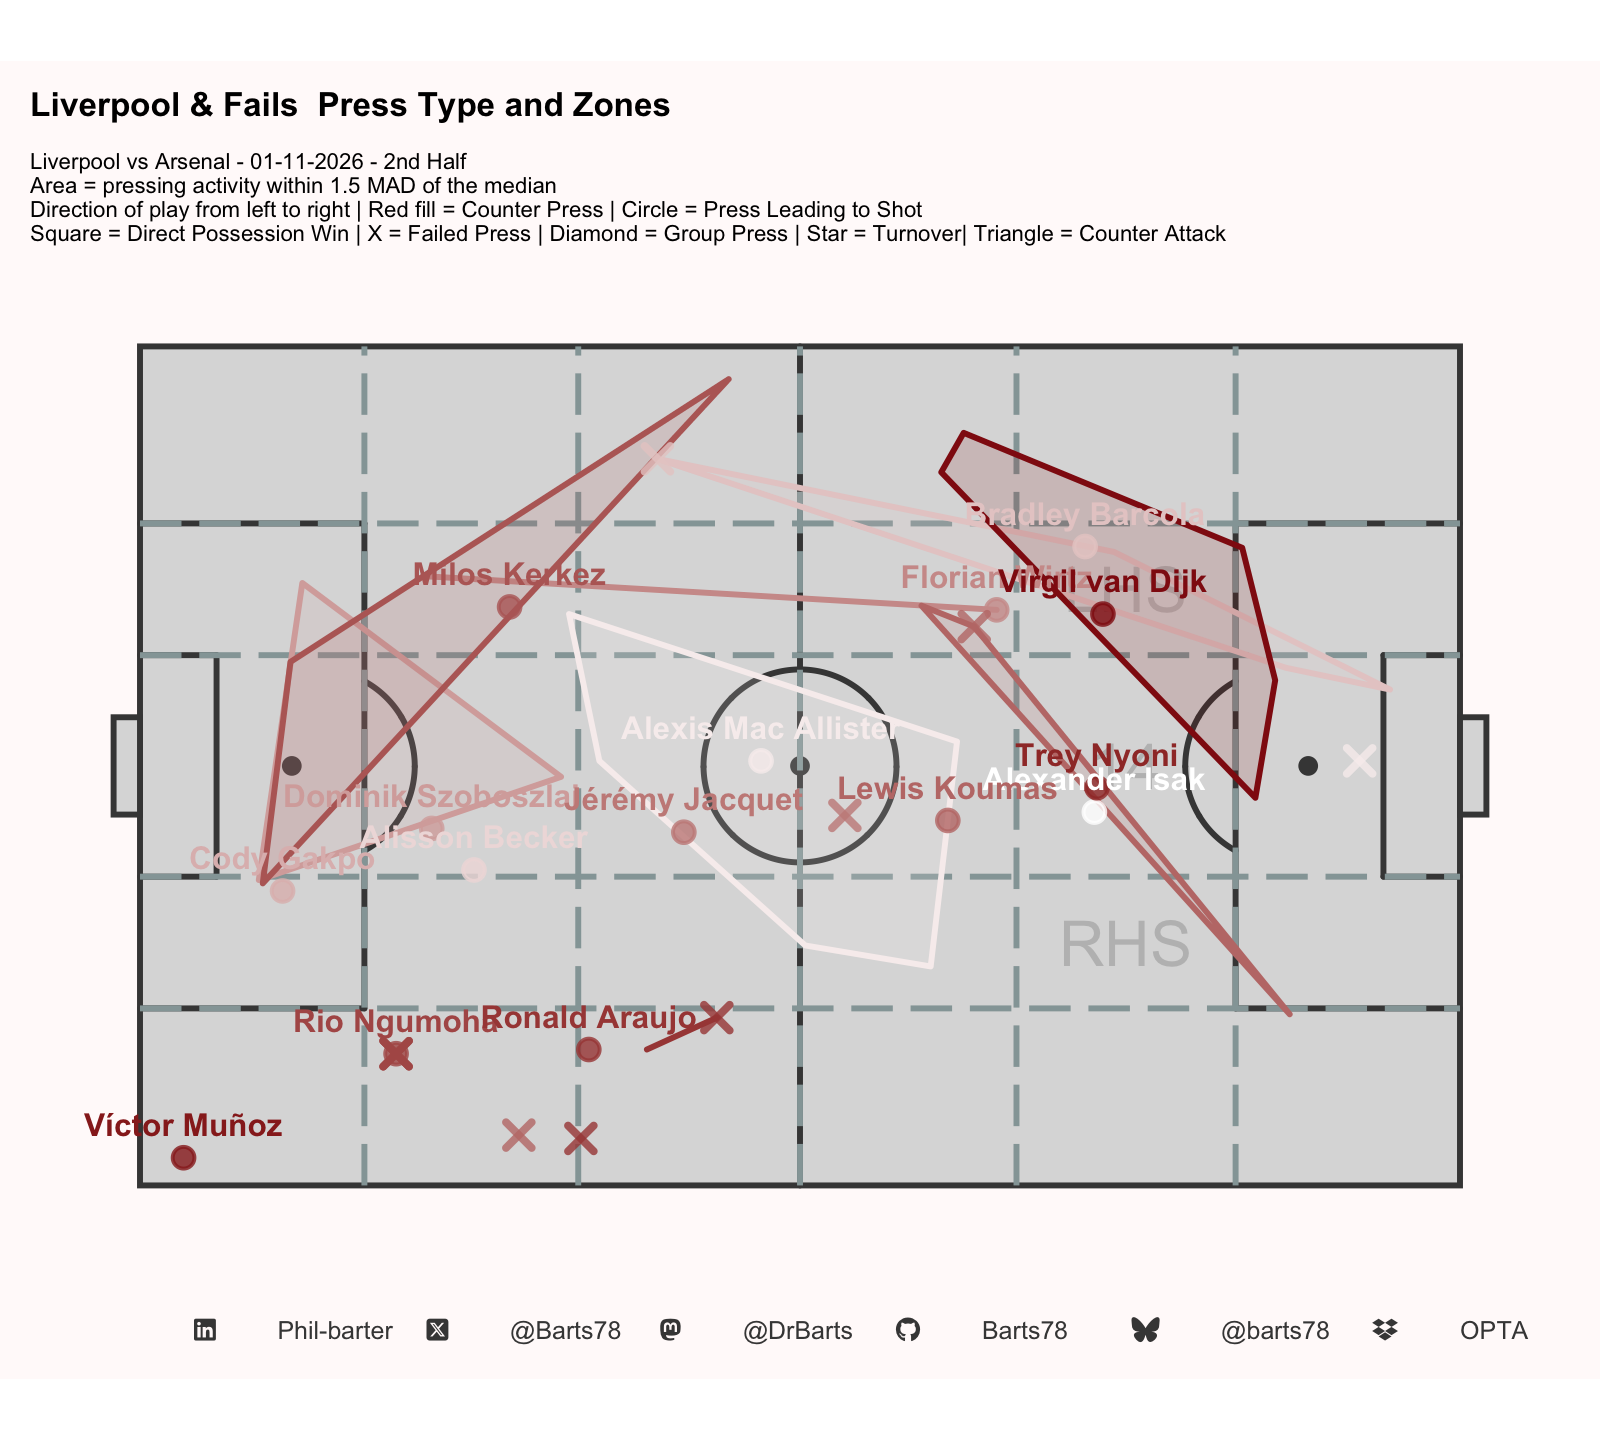
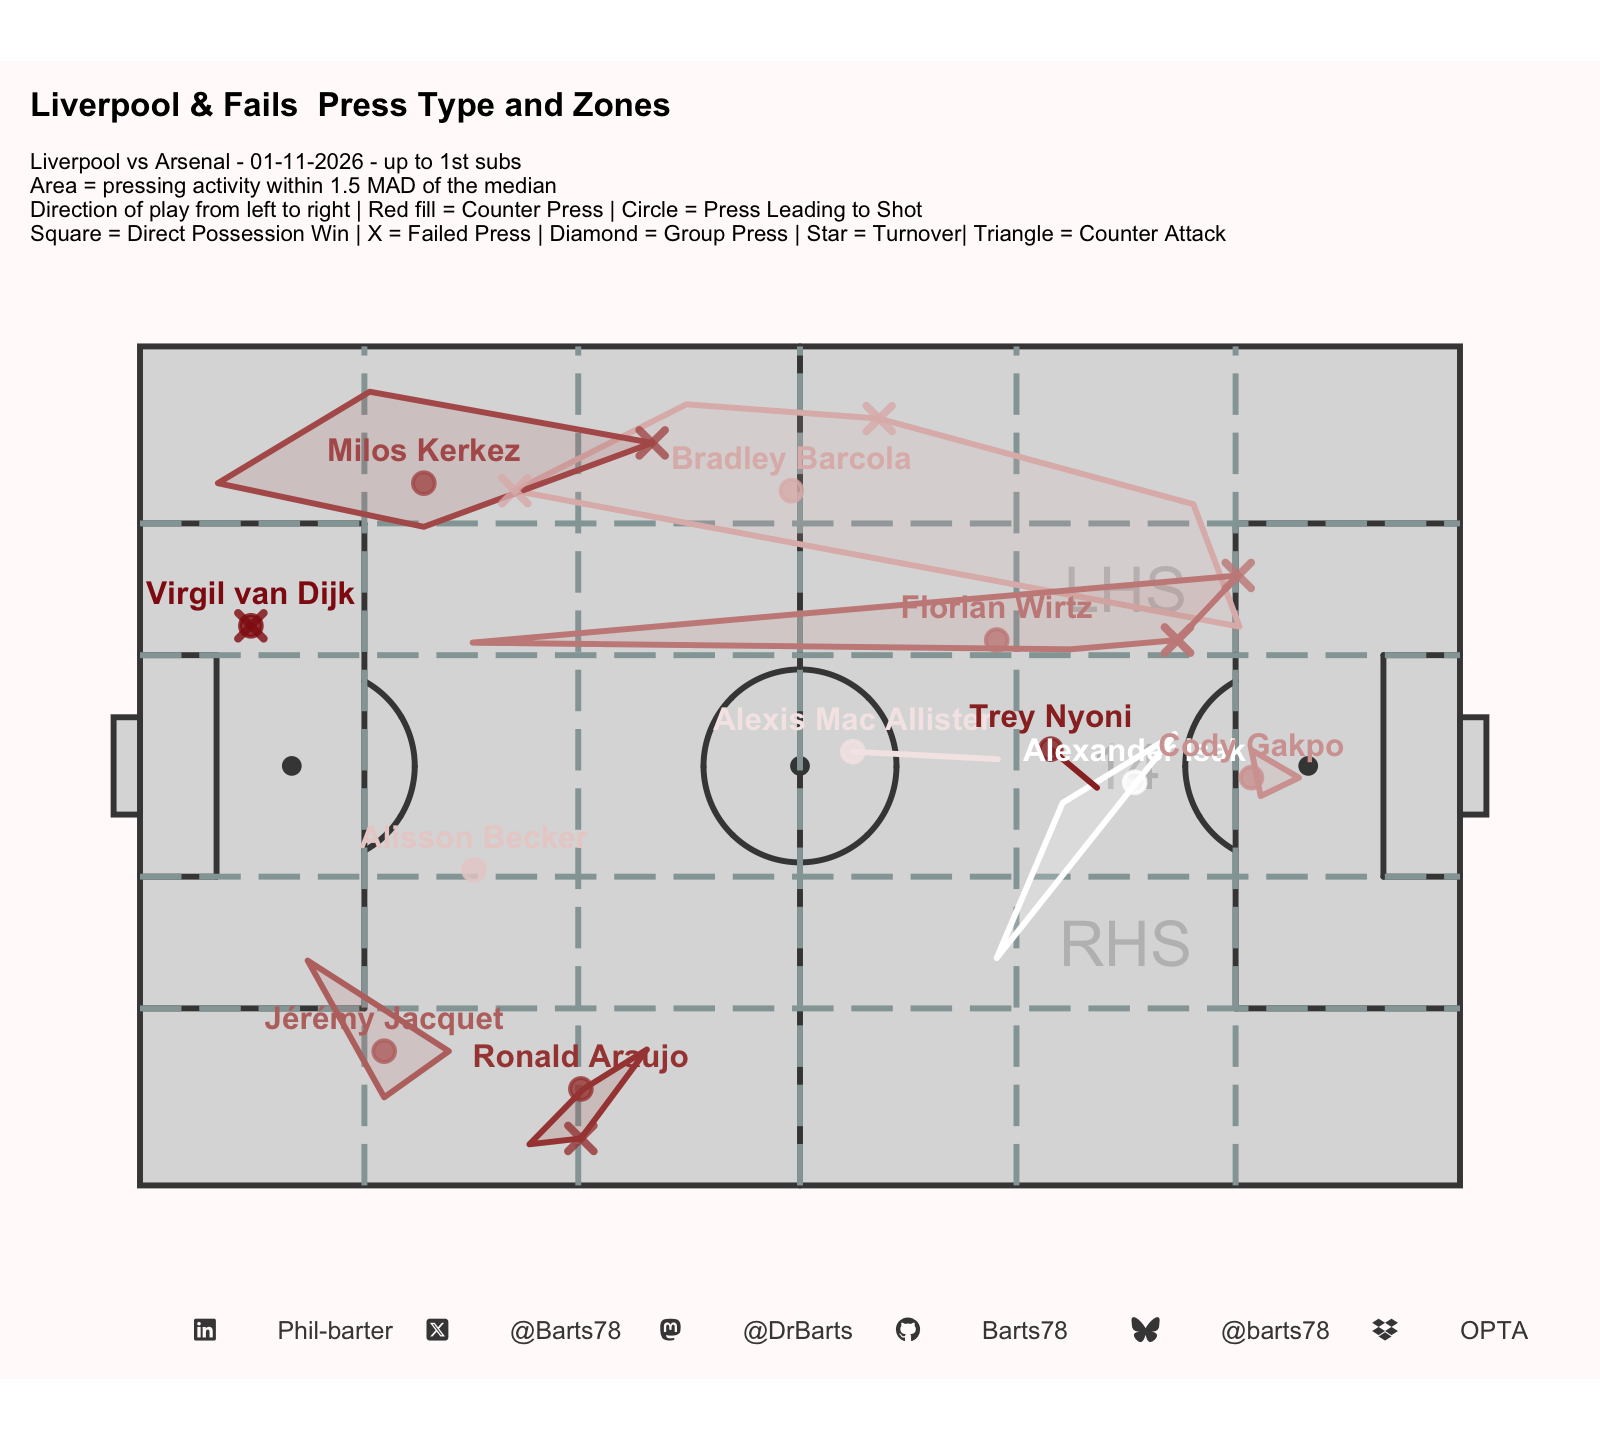
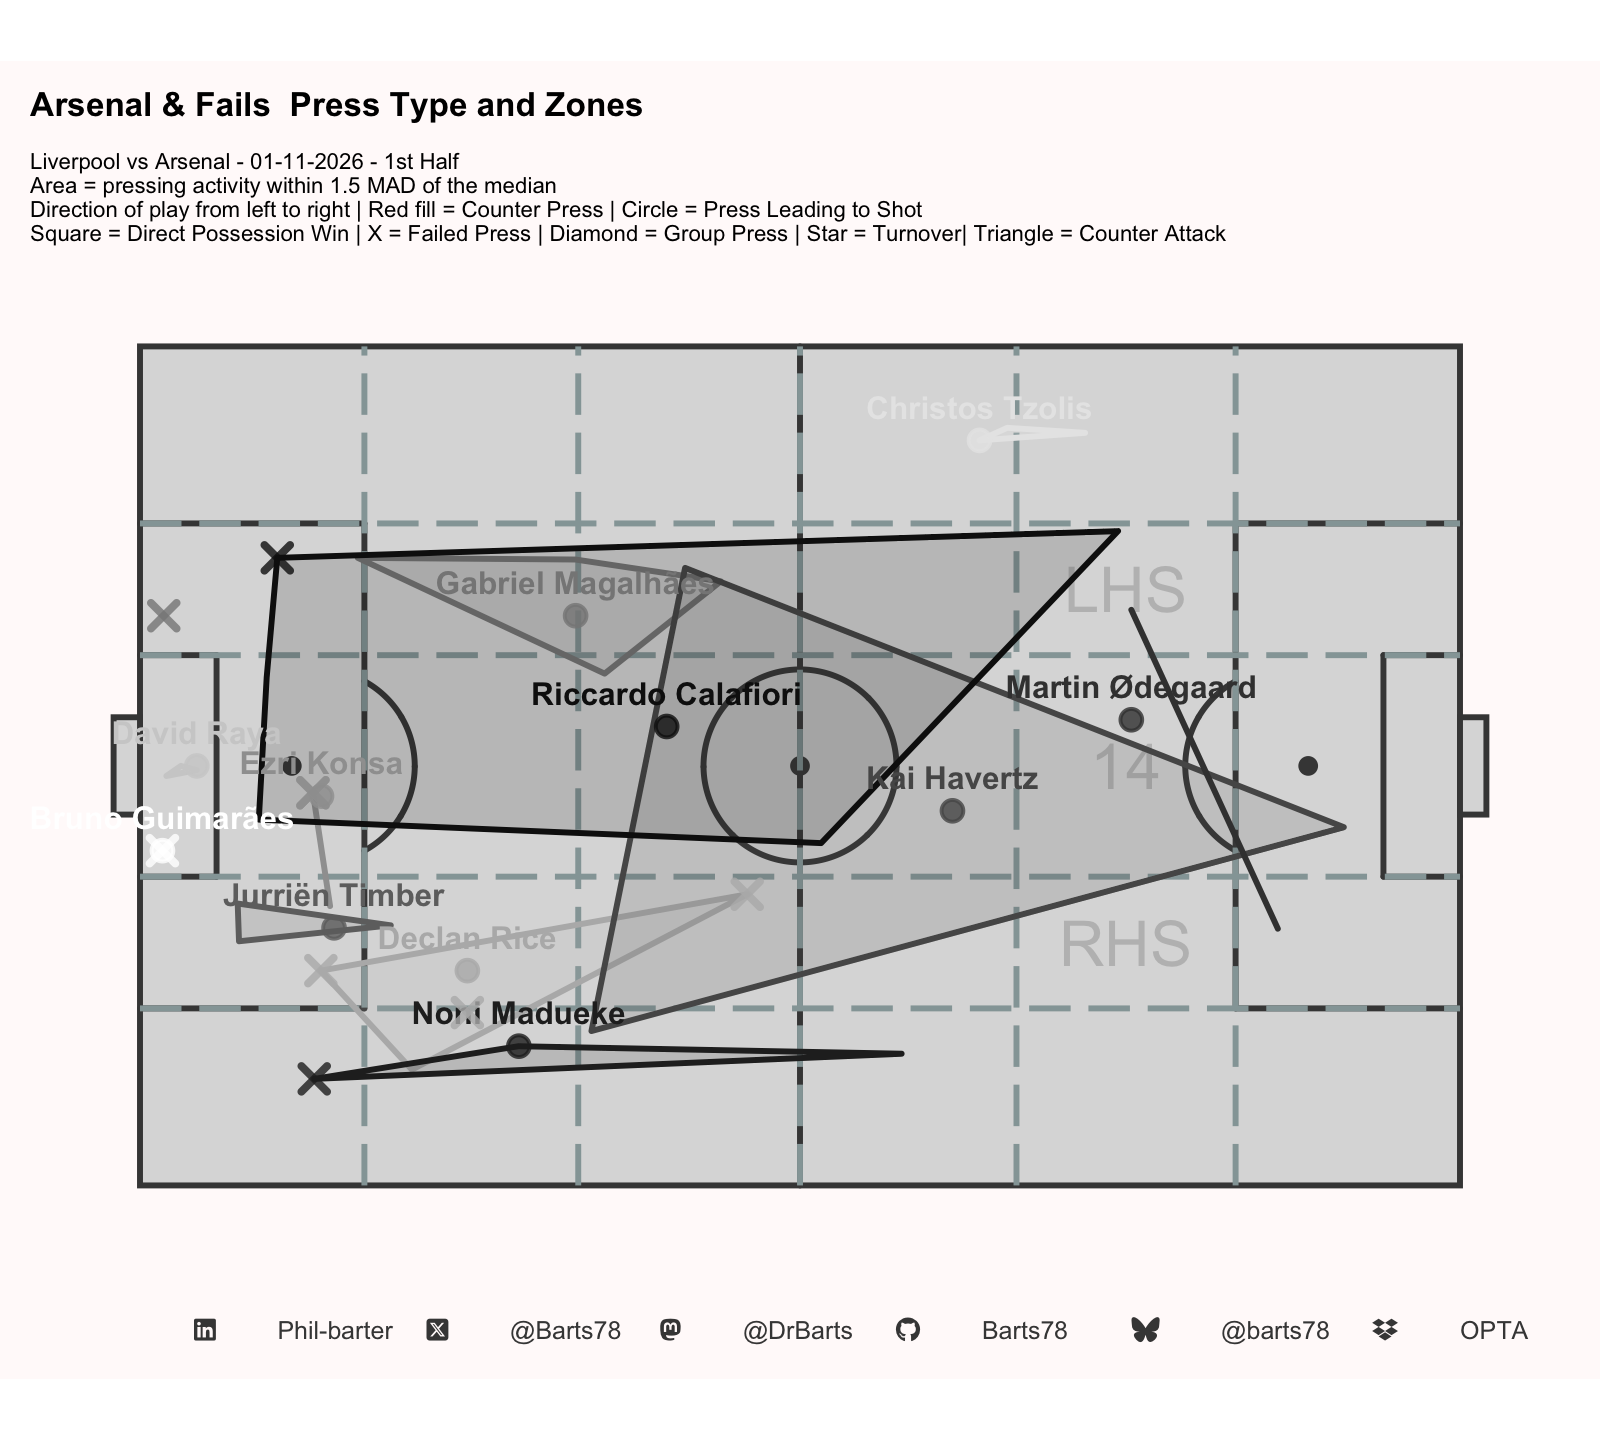
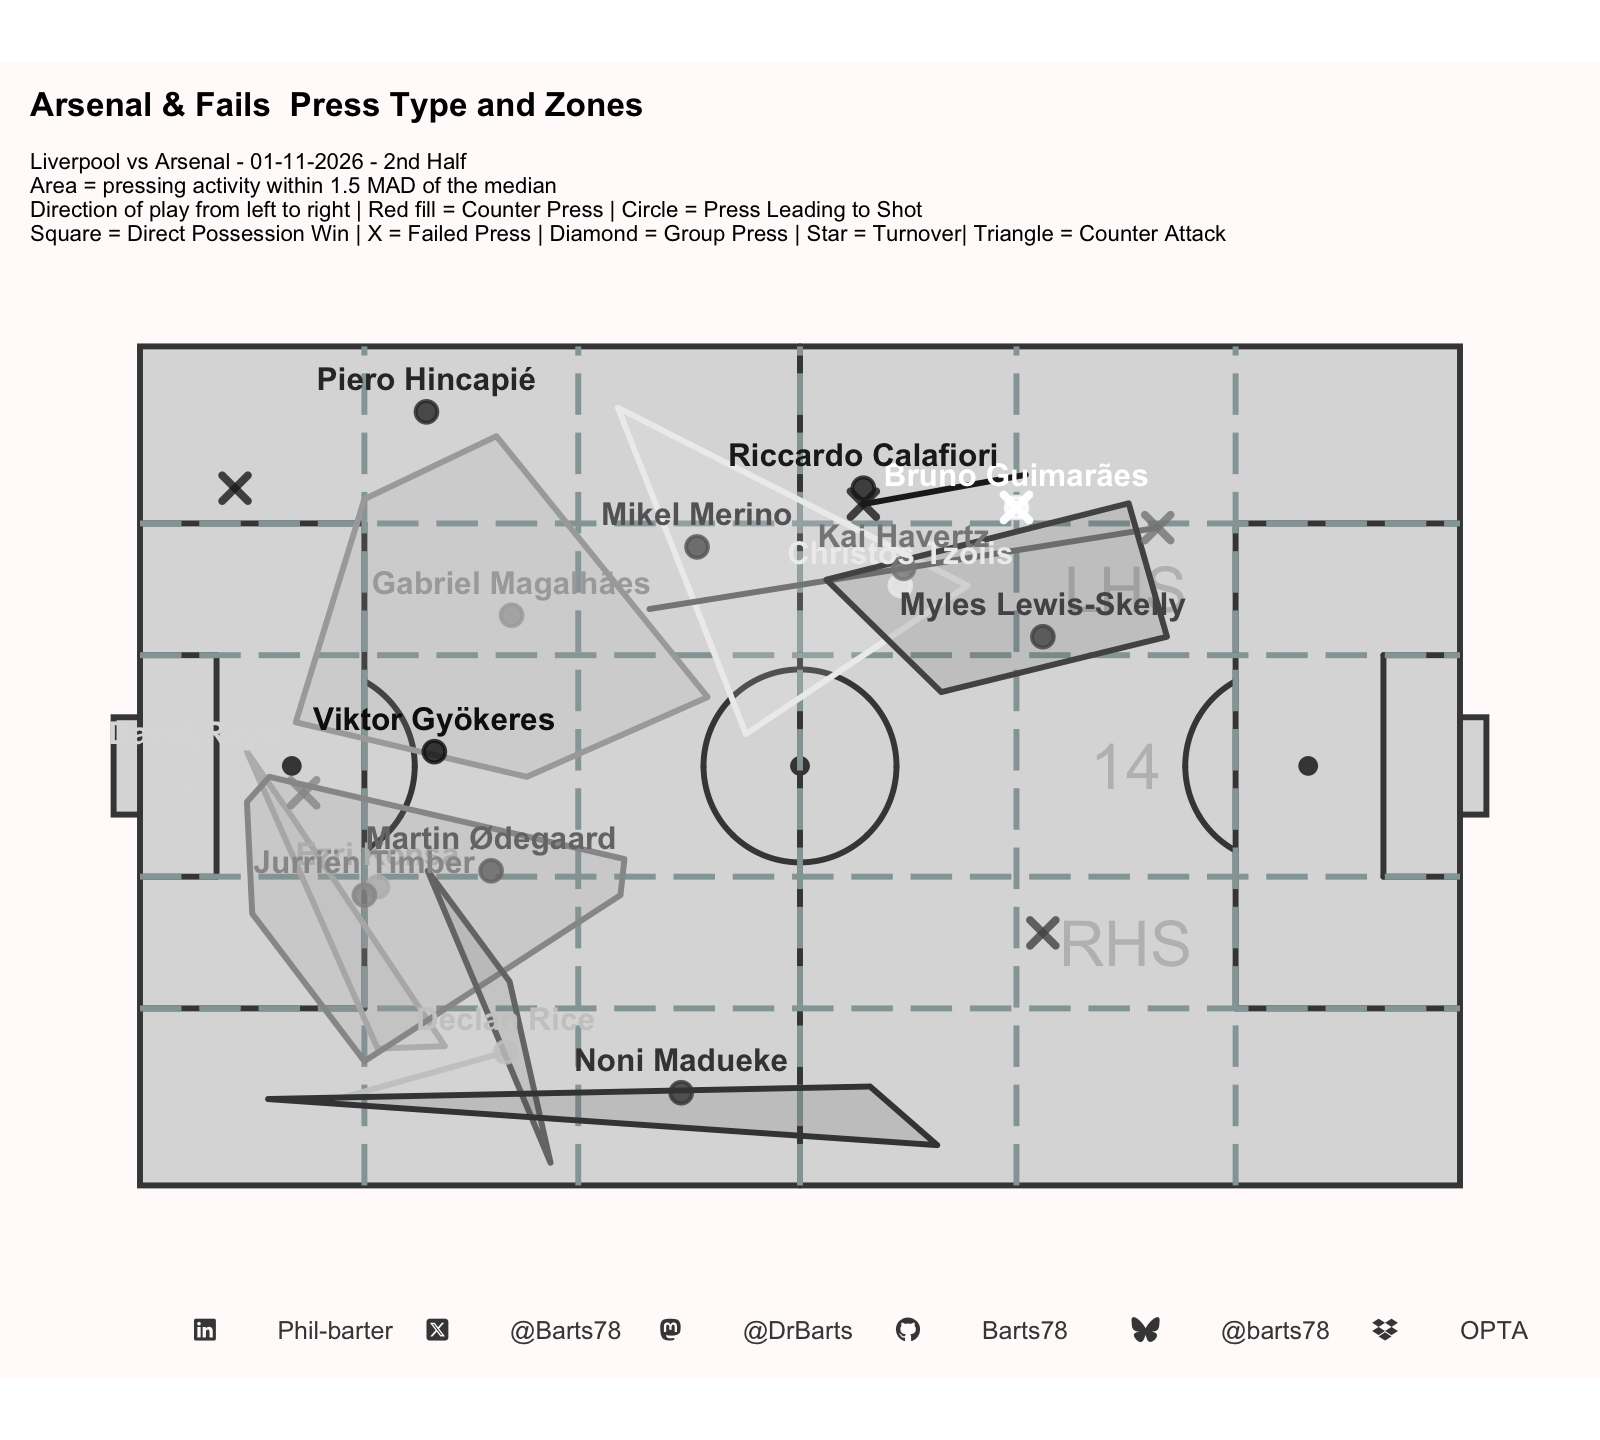
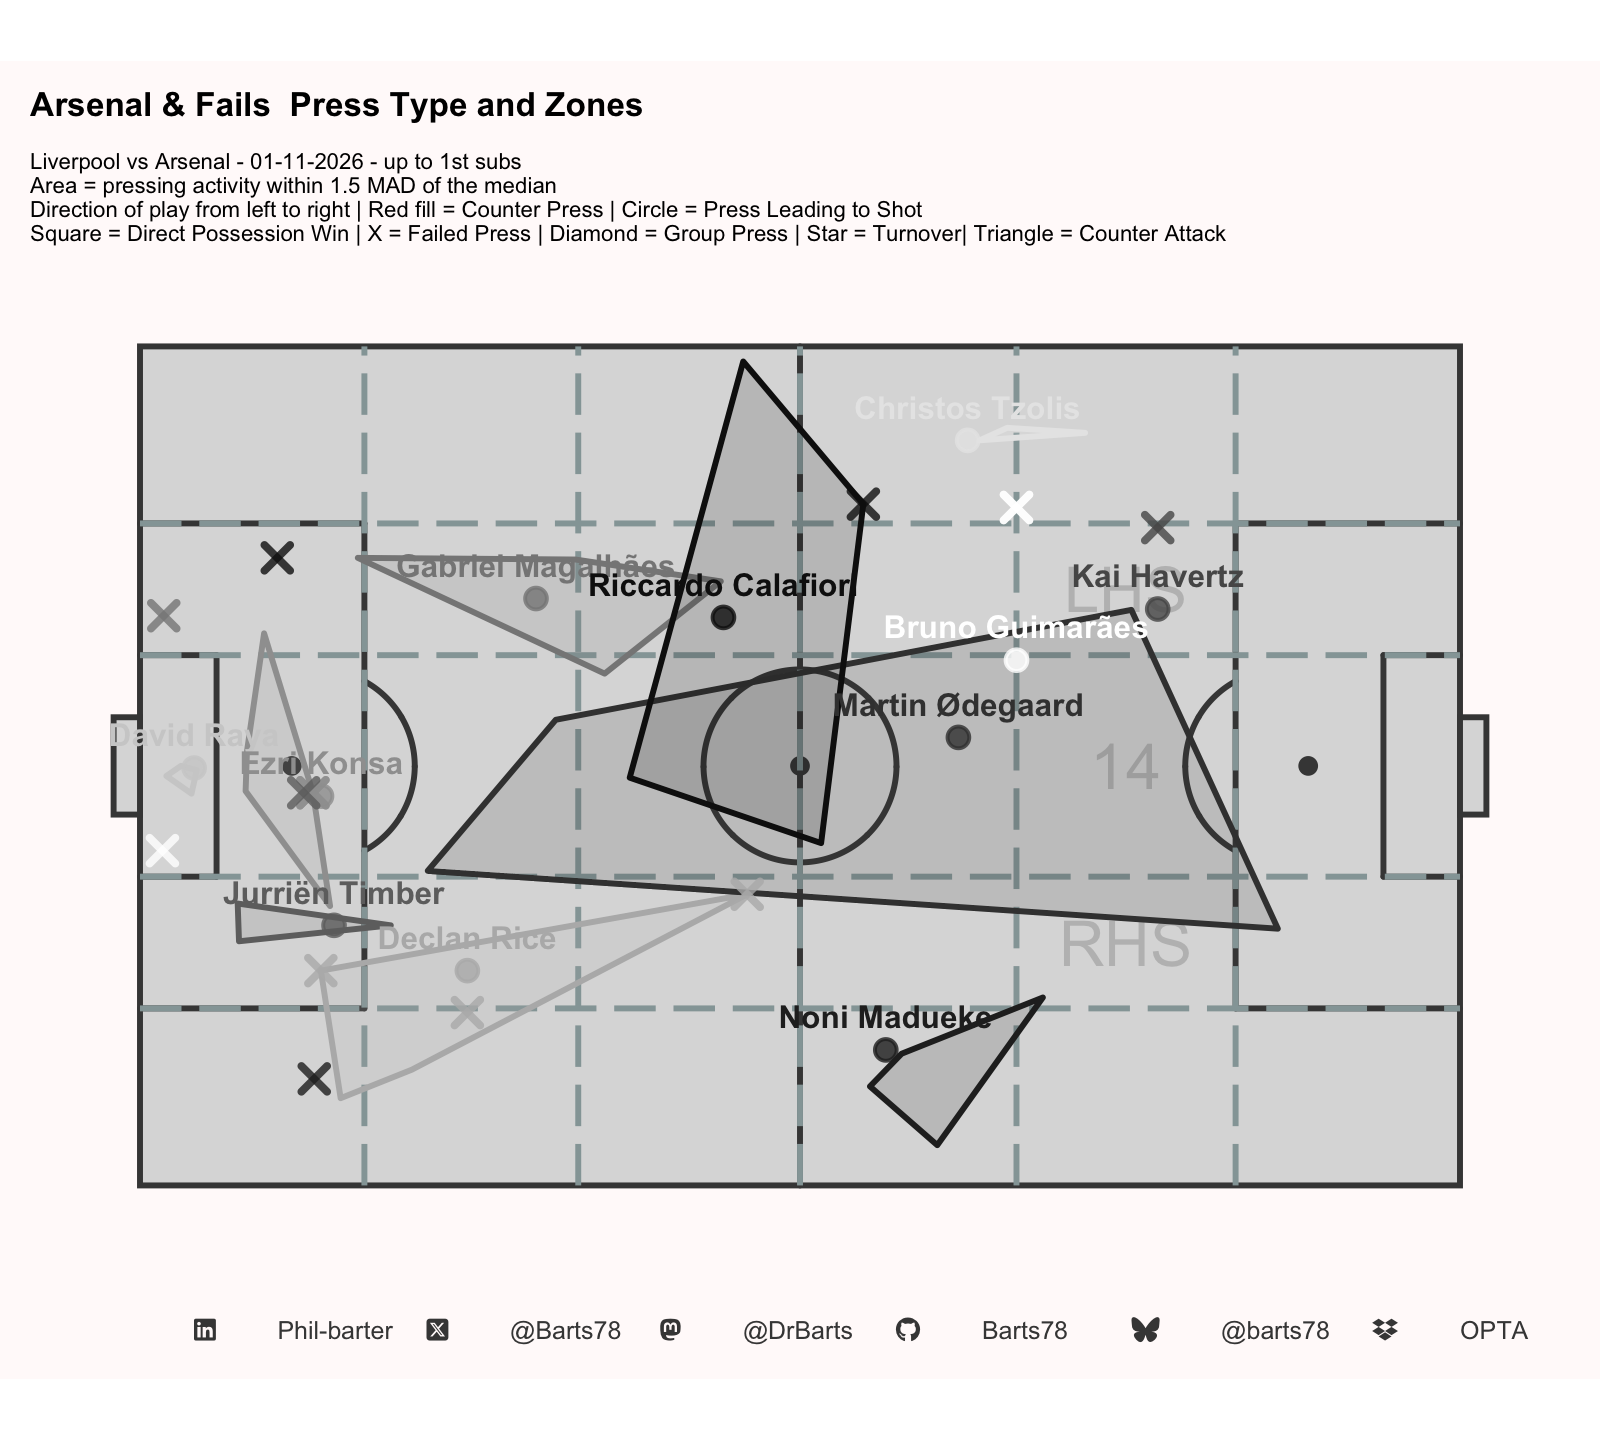
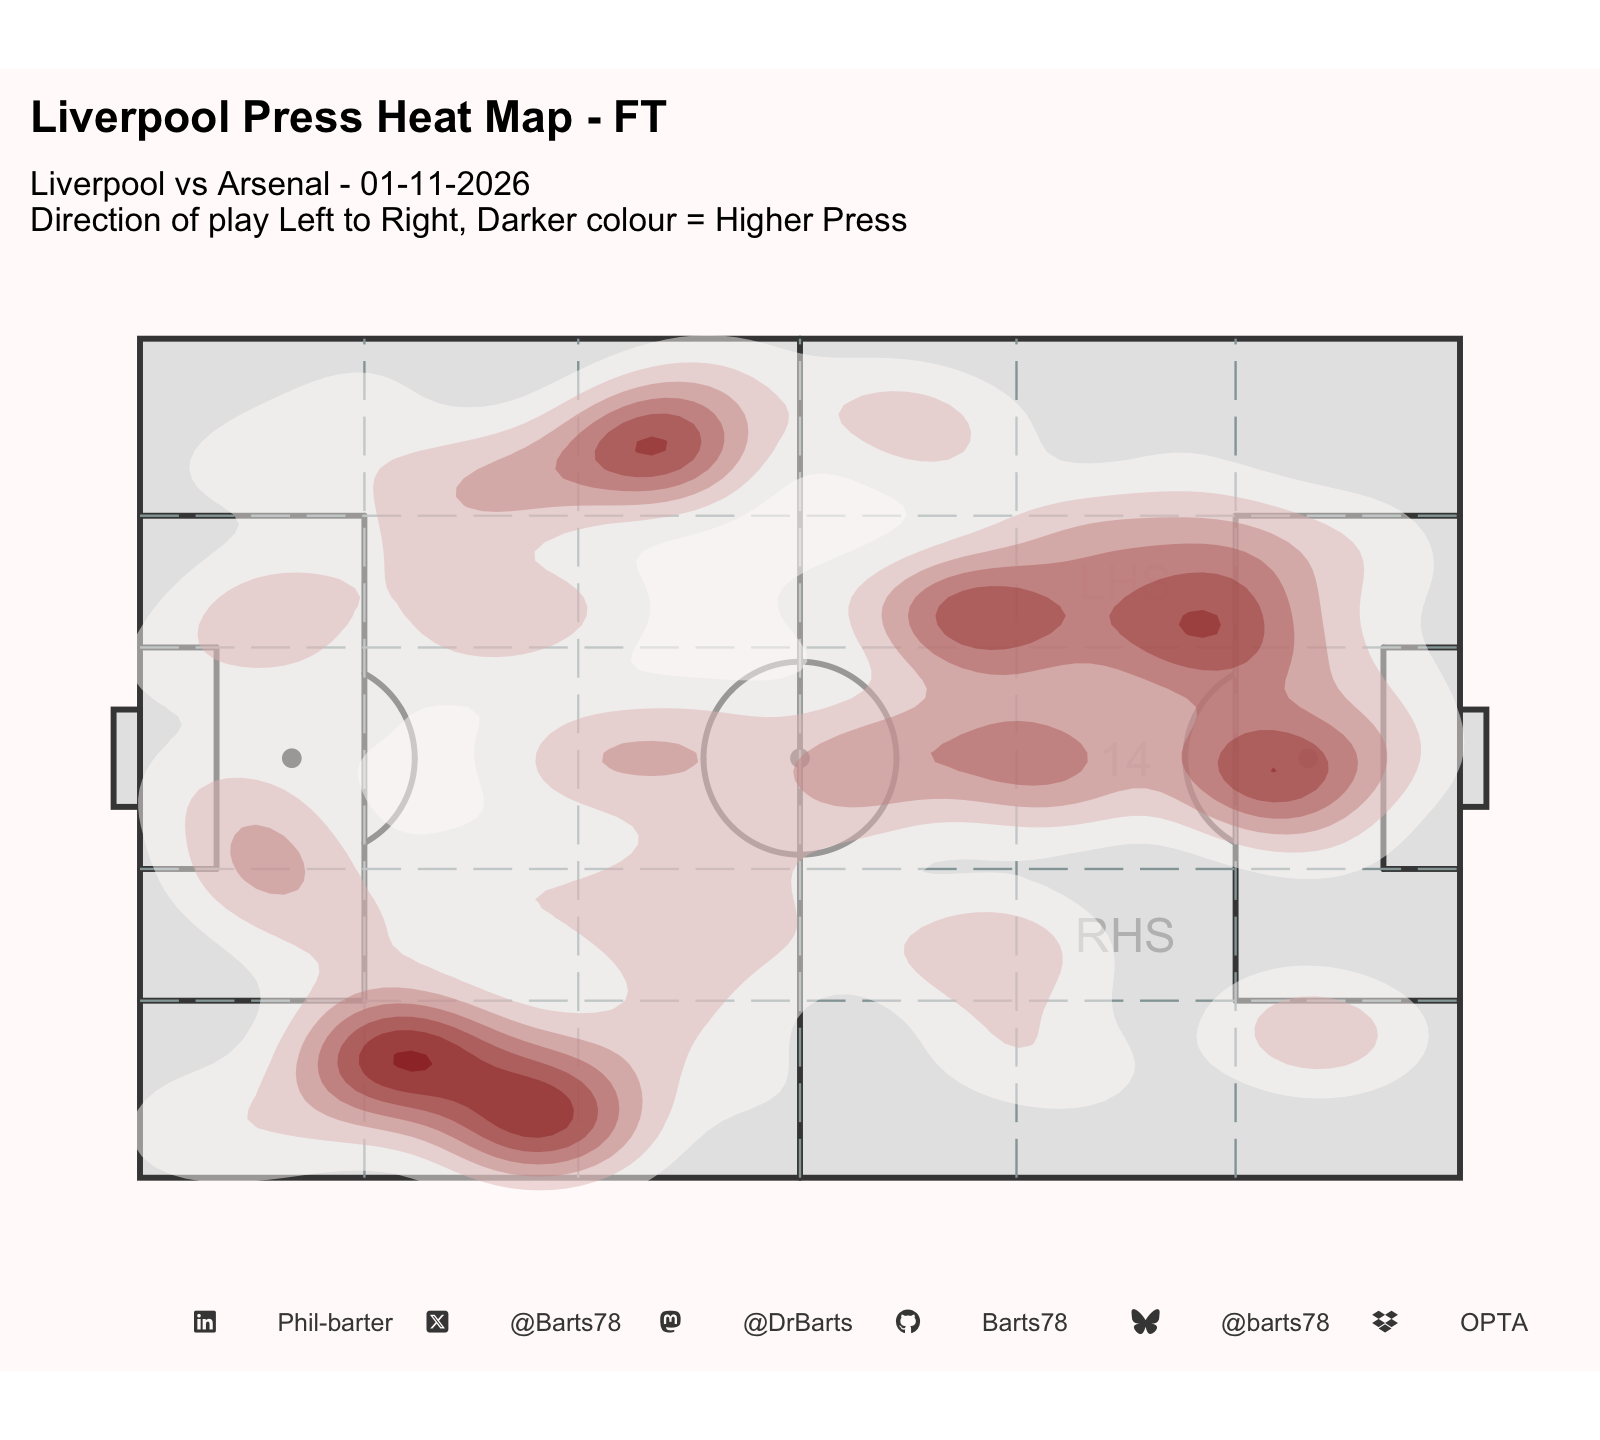
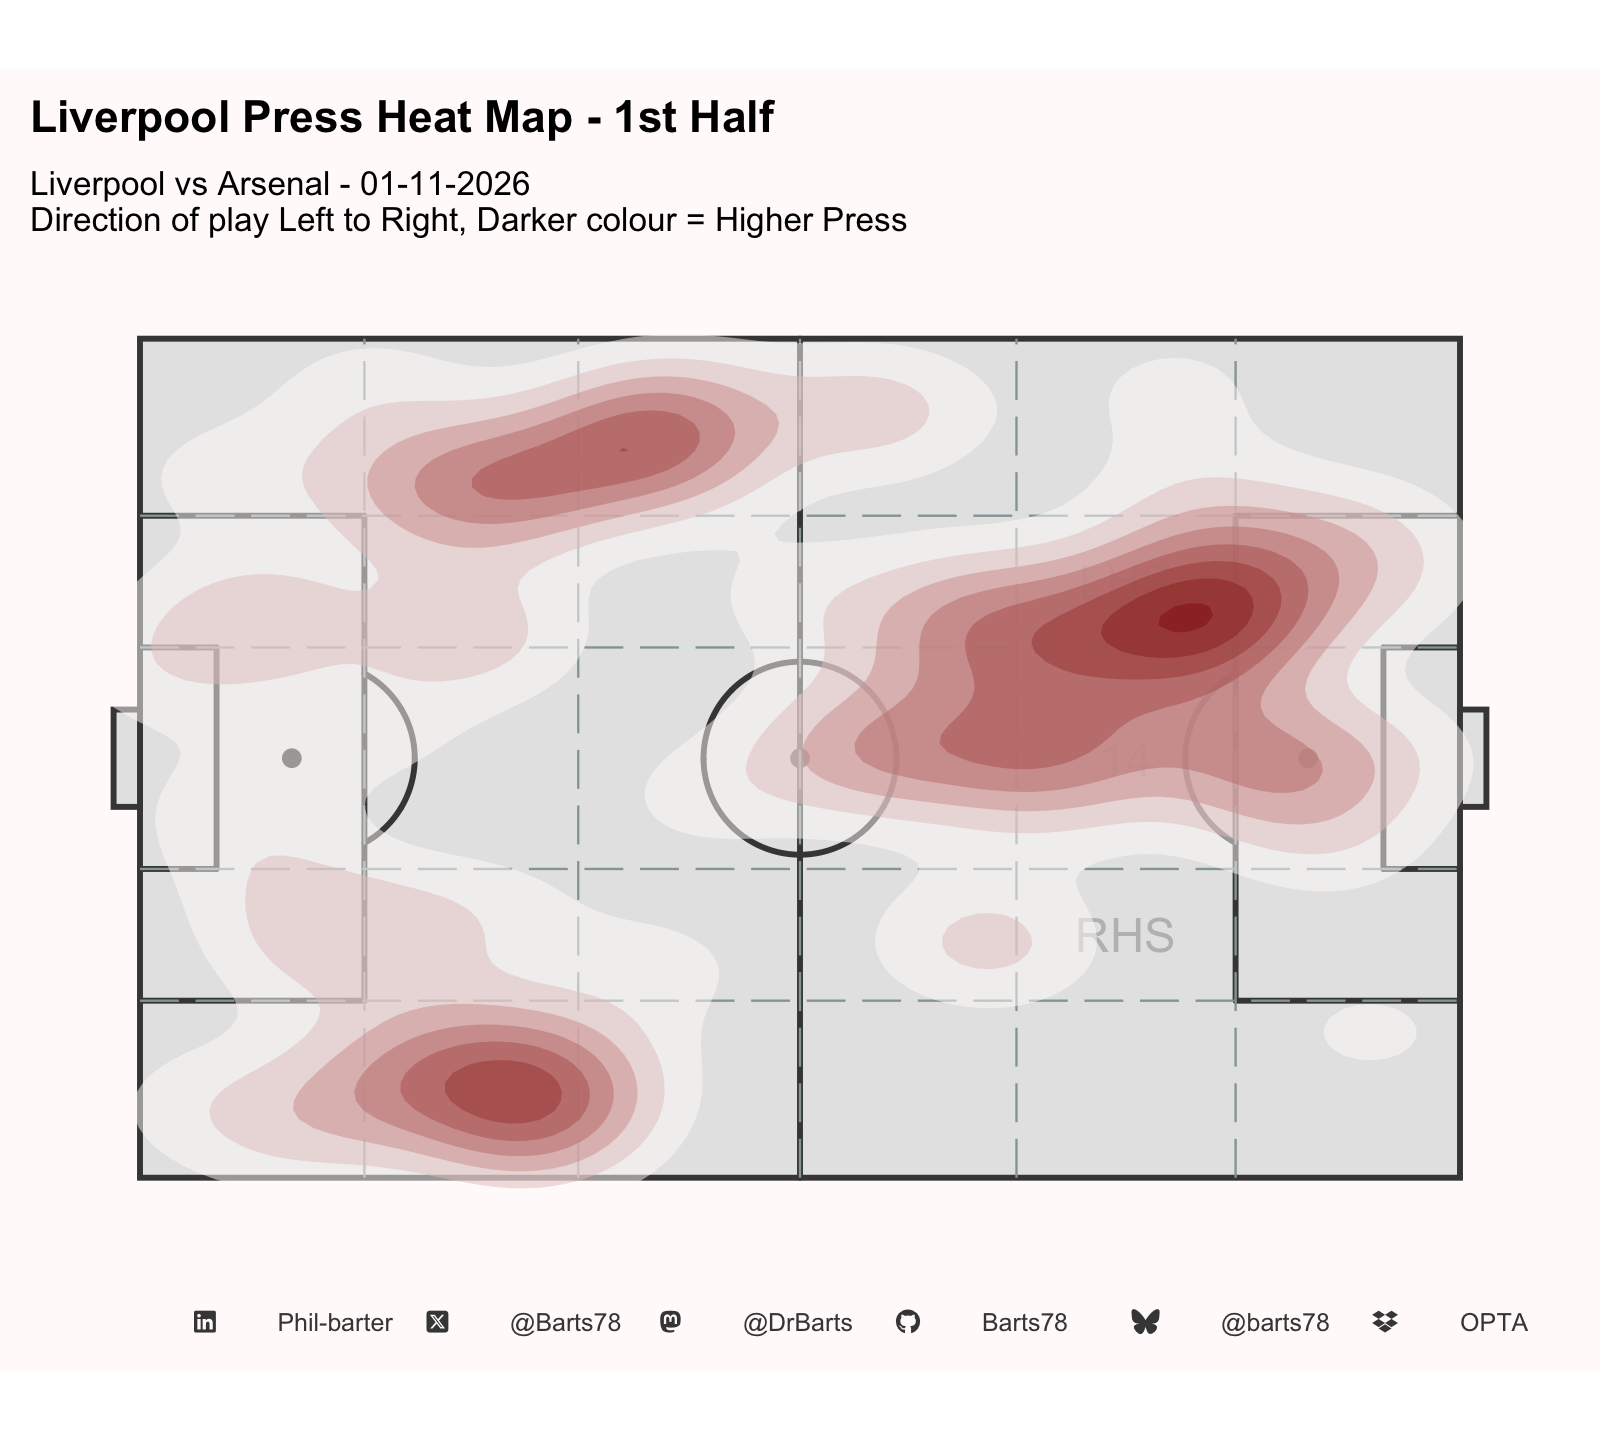
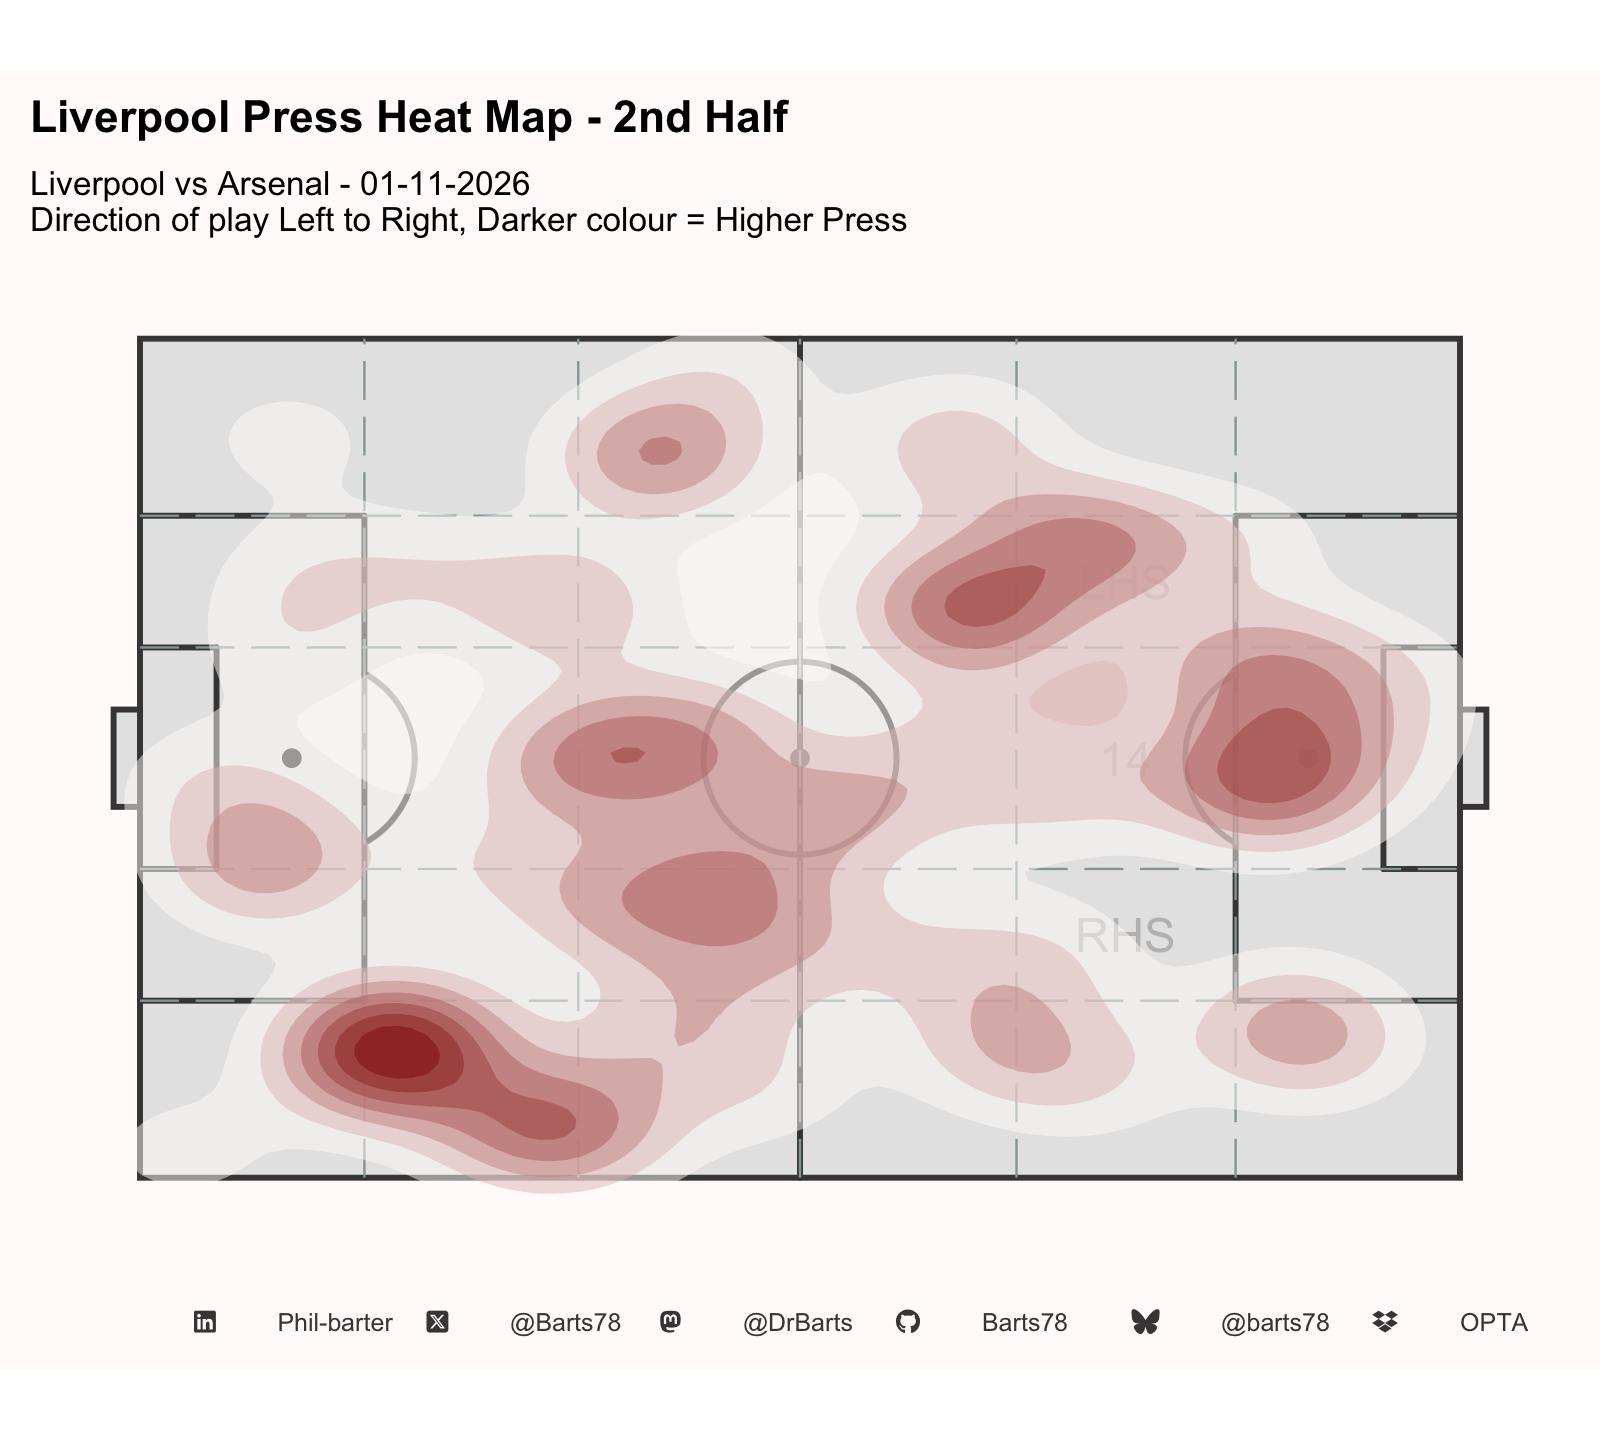
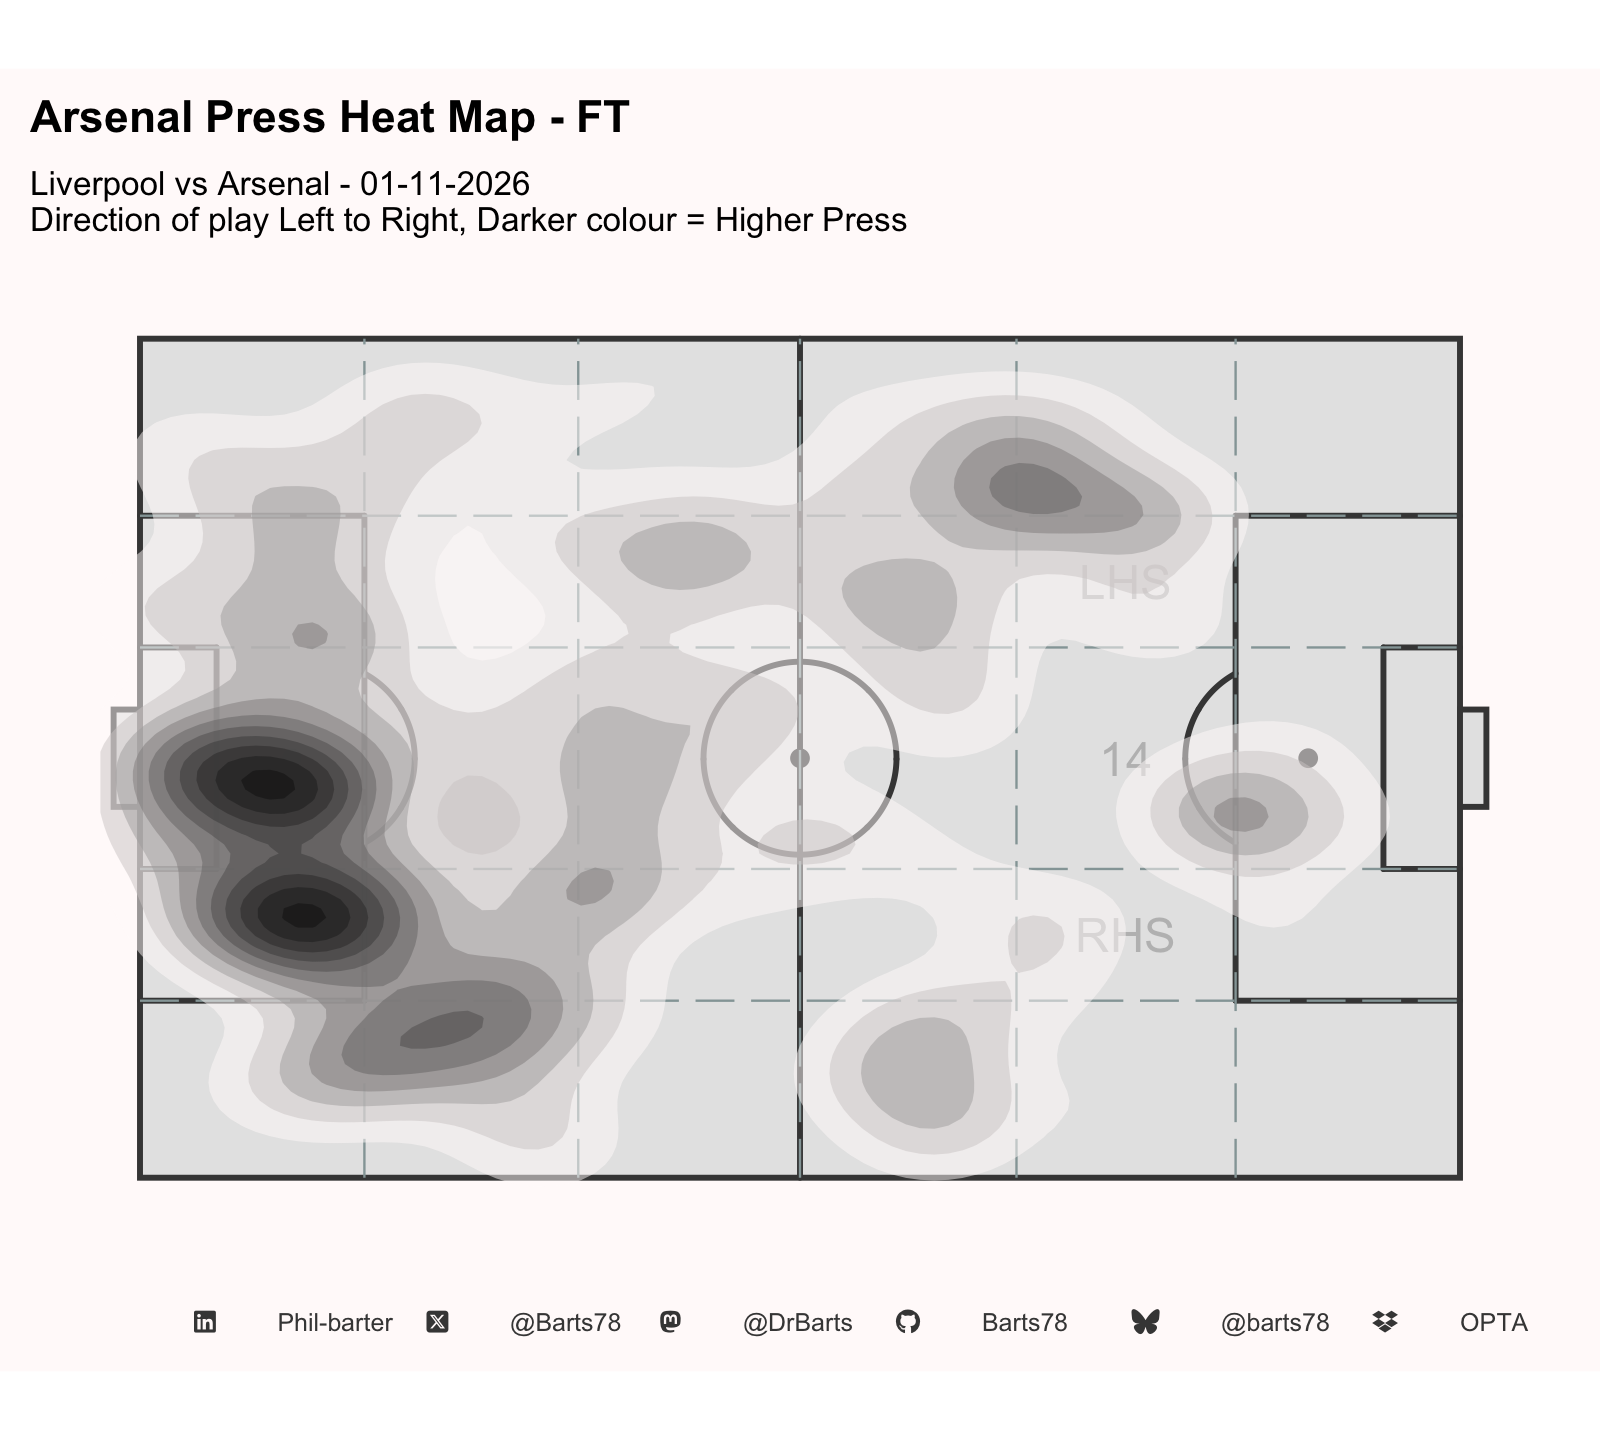
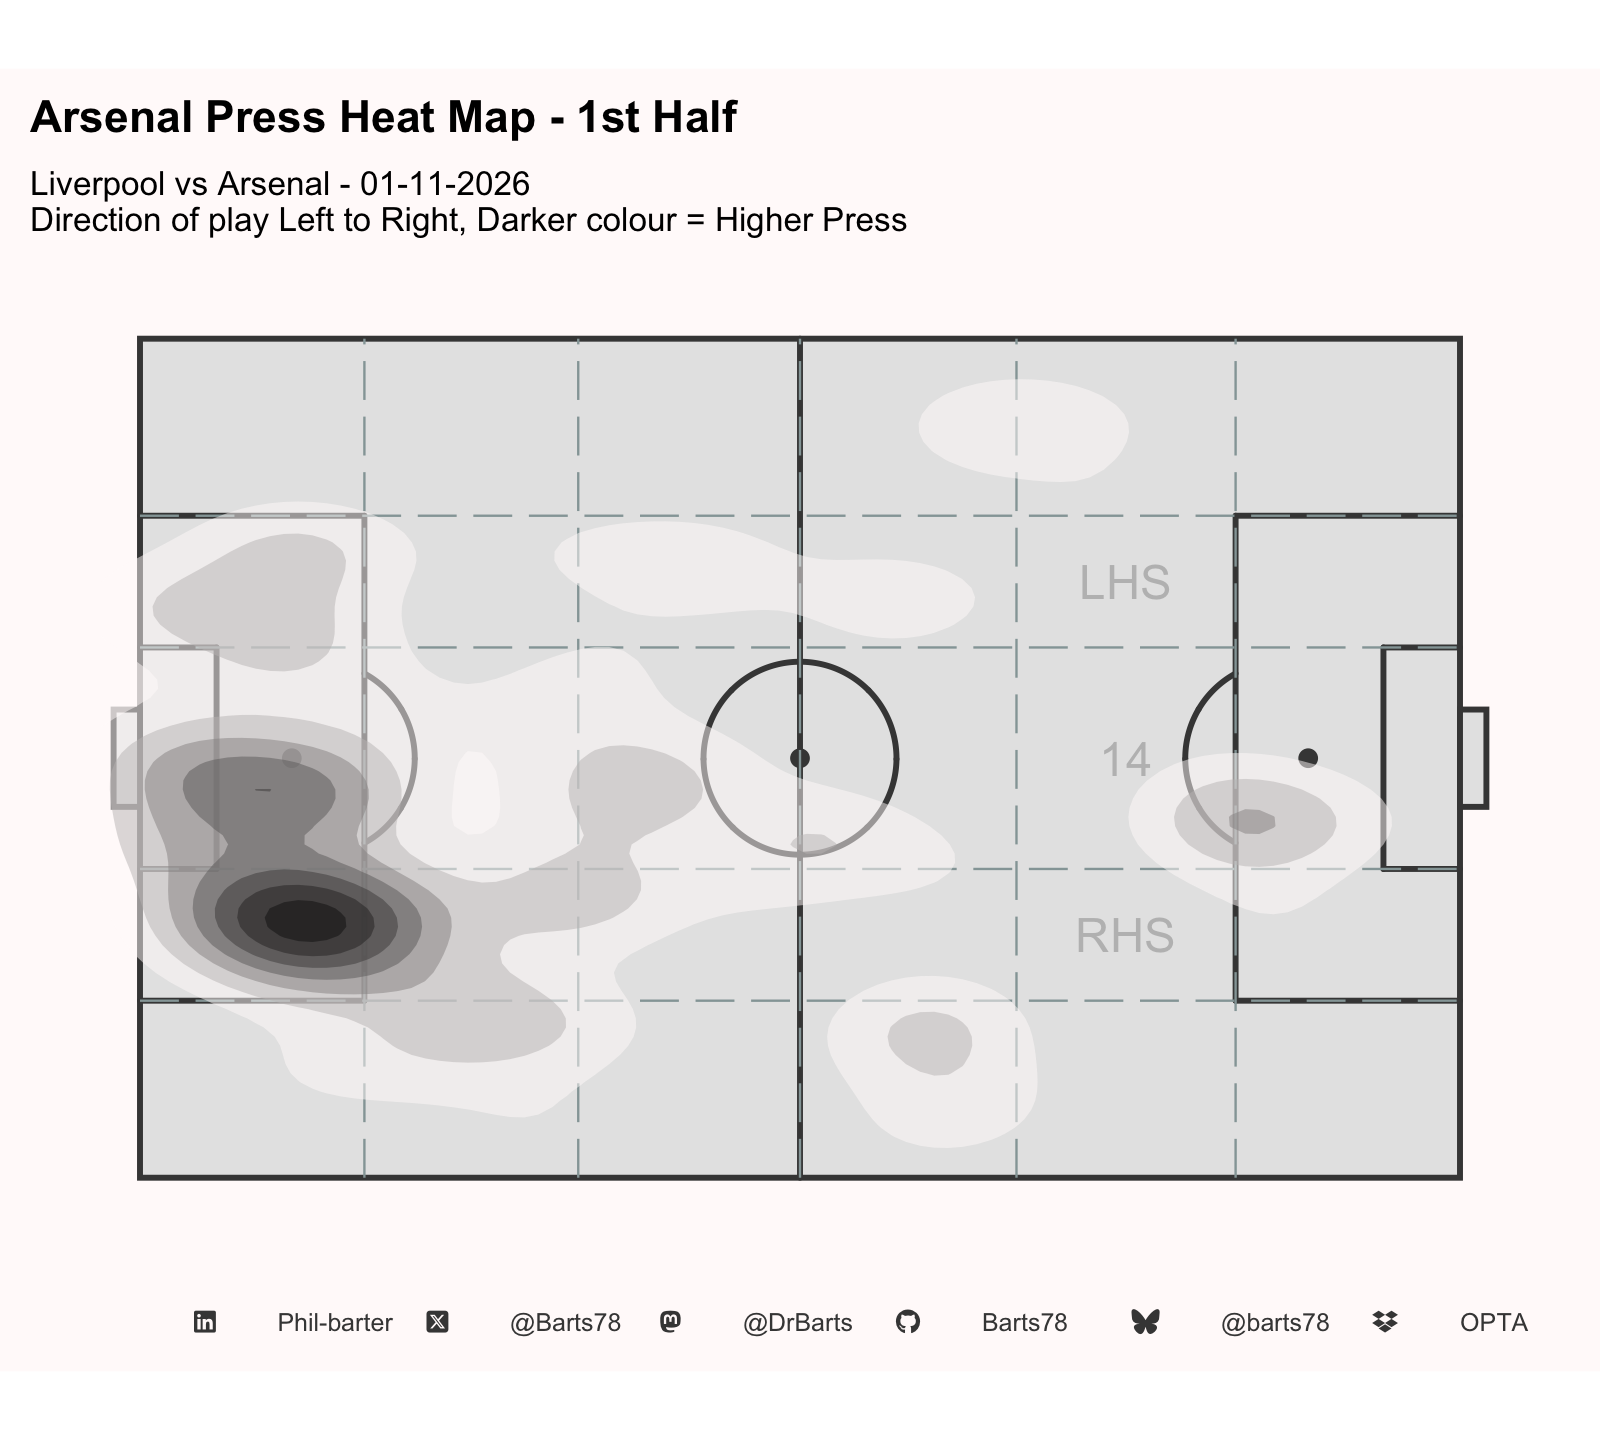
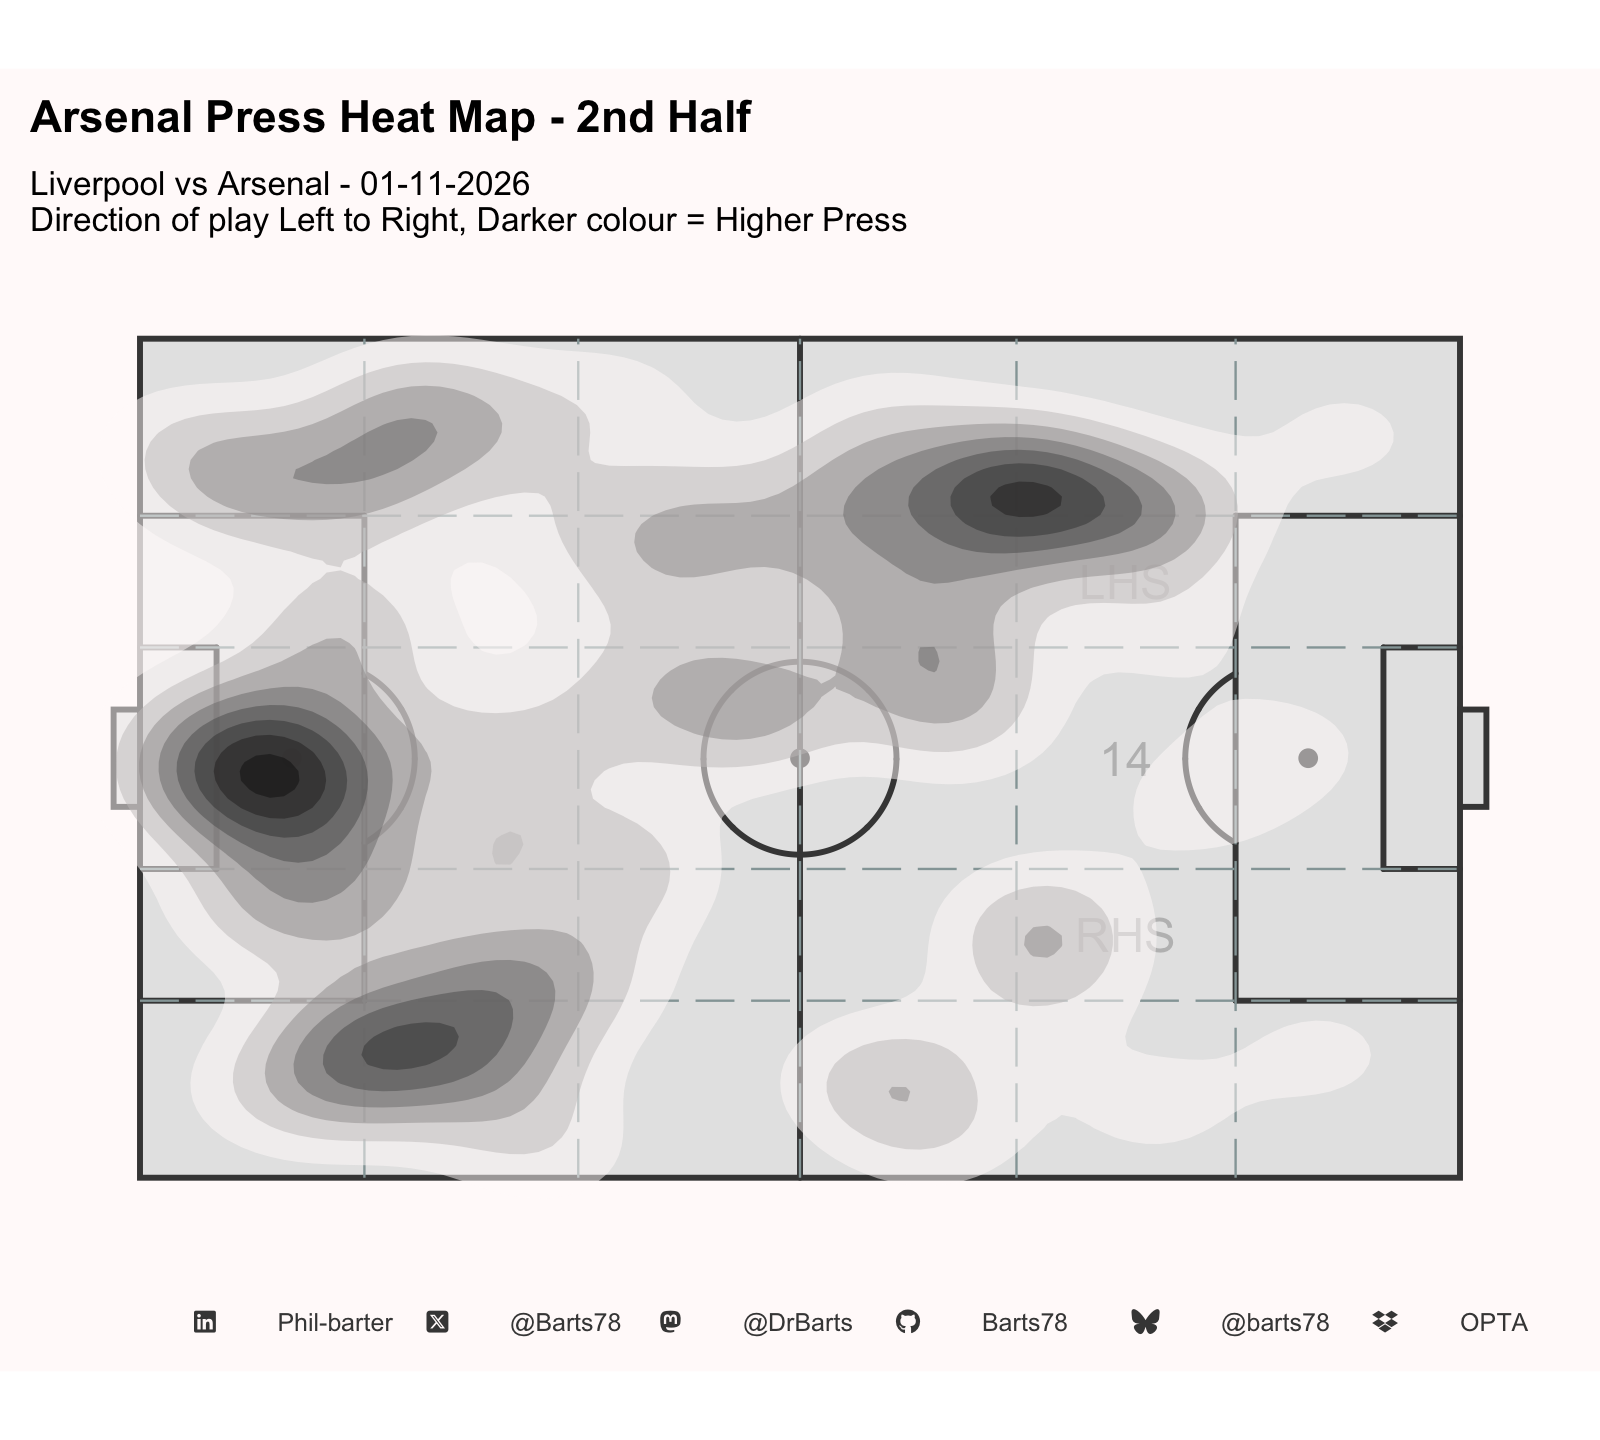
| Liverpool Individual Player Pressing Stats | |||||||||||||||||||||
| Liverpool vs Arsenal - 01-11-2026 | |||||||||||||||||||||
| Mins Played |
Summary
|
Positive Actions
|
Negative Actions
|
||||||||||||||||||
|---|---|---|---|---|---|---|---|---|---|---|---|---|---|---|---|---|---|---|---|---|---|
| Total Presses | PAdj Presses | Total Successful Presses | Total Failed Presses | Net | Press Efficiency | Solo Press | Group Press | Pushed Opponent Back | Direct Possession Win | Counter Attack | Counter Press | Won Possession | Led to Shot | Led to Goal | High Value Presses | Conceded Cross | Conceded Shot | Conceded Free Kick | Failed Press | ||
| Forward | |||||||||||||||||||||
| Alexander Isak | 99.48 | 8 | 8.4 | 8 | 0 | 8 | 100.0 | 8 | 0 | 0 | 0 | 1 | 2 | 4 | 0 | 0 | 4 | 0 | 0 | 0 | 0 |
| Unit Mean | — | 8.0 | 8.4 | 8.0 | 0.0 | 8.0 | 100.0 | 8.0 | 0.0 | 0.0 | 0.0 | 1.0 | 2.0 | 4.0 | 0.0 | 0.0 | 4.0 | 0.0 | 0.0 | 0.0 | 0.0 |
| Midfielder | |||||||||||||||||||||
| Alexis Mac Allister | 99.48 | 21 | 22.0 | 20 | 1 | 19 | 95.2 | 21 | 0 | 0 | 0 | 6 | 9 | 13 | 0 | 0 | 13 | 0 | 0 | 0 | 1 |
| Bradley Barcola | 99.48 | 18 | 18.9 | 15 | 3 | 12 | 83.3 | 14 | 4 | 1 | 1 | 2 | 8 | 10 | 0 | 0 | 10 | 0 | 0 | 0 | 3 |
| Cody Gakpo | 69.57 | 5 | 5.2 | 5 | 0 | 5 | 100.0 | 5 | 0 | 0 | 0 | 0 | 2 | 4 | 0 | 0 | 4 | 0 | 0 | 0 | 0 |
| Dominik Szoboszlai | 38.55 | 6 | 6.3 | 6 | 0 | 6 | 100.0 | 6 | 0 | 1 | 0 | 1 | 3 | 3 | 0 | 0 | 3 | 0 | 0 | 0 | 0 |
| Florian Wirtz | 83.90 | 18 | 18.9 | 15 | 3 | 12 | 83.3 | 15 | 3 | 0 | 1 | 0 | 10 | 9 | 0 | 0 | 9 | 0 | 0 | 0 | 3 |
| Lewis Koumas | 15.58 | 6 | 6.3 | 4 | 2 | 2 | 66.7 | 6 | 0 | 1 | 1 | 0 | 2 | 2 | 0 | 0 | 2 | 0 | 0 | 0 | 2 |
| Rio Ngumoha | 29.92 | 7 | 7.3 | 3 | 4 | -1 | 42.9 | 7 | 0 | 0 | 0 | 0 | 0 | 2 | 0 | 0 | 2 | 0 | 0 | 1 | 3 |
| Trey Nyoni | 60.93 | 5 | 5.2 | 5 | 0 | 5 | 100.0 | 3 | 2 | 0 | 0 | 0 | 1 | 5 | 0 | 0 | 5 | 0 | 0 | 0 | 0 |
| Unit Mean | — | 10.8 | 11.3 | 9.1 | 1.6 | 7.5 | 83.9 | 9.6 | 1.1 | 0.4 | 0.4 | 1.1 | 4.4 | 6.0 | 0.0 | 0.0 | 6.0 | 0.0 | 0.0 | 0.1 | 1.5 |
| Keeper | |||||||||||||||||||||
| Alisson Becker | 99.48 | 1 | 1.0 | 1 | 0 | 1 | 100.0 | 1 | 0 | 0 | 0 | 1 | 0 | 1 | 0 | 0 | 1 | 0 | 0 | 0 | 0 |
| Unit Mean | — | 1.0 | 1.0 | 1.0 | 0.0 | 1.0 | 100.0 | 1.0 | 0.0 | 0.0 | 0.0 | 1.0 | 0.0 | 1.0 | 0.0 | 0.0 | 1.0 | 0.0 | 0.0 | 0.0 | 0.0 |
| Defender | |||||||||||||||||||||
| Jérémy Jacquet | 99.48 | 14 | 14.7 | 13 | 1 | 12 | 92.9 | 12 | 2 | 0 | 2 | 2 | 6 | 8 | 0 | 0 | 8 | 0 | 0 | 0 | 1 |
| Milos Kerkez | 83.68 | 11 | 11.5 | 10 | 1 | 9 | 90.9 | 9 | 2 | 0 | 1 | 1 | 2 | 8 | 0 | 0 | 8 | 0 | 0 | 0 | 1 |
| Ronald Araujo | 83.75 | 13 | 13.6 | 10 | 3 | 7 | 76.9 | 13 | 0 | 0 | 0 | 0 | 3 | 7 | 0 | 0 | 7 | 1 | 0 | 0 | 2 |
| Virgil van Dijk | 99.48 | 10 | 10.5 | 9 | 1 | 8 | 90.0 | 8 | 2 | 0 | 0 | 1 | 1 | 6 | 0 | 0 | 6 | 0 | 0 | 0 | 1 |
| Víctor Muñoz | 15.73 | 1 | 1.0 | 1 | 0 | 1 | 100.0 | 1 | 0 | 0 | 0 | 0 | 0 | 1 | 0 | 0 | 1 | 0 | 0 | 0 | 0 |
| Unit Mean | — | 9.8 | 10.3 | 8.6 | 1.2 | 7.4 | 90.1 | 8.6 | 1.2 | 0.0 | 0.6 | 0.8 | 2.4 | 6.0 | 0.0 | 0.0 | 6.0 | 0.2 | 0.0 | 0.0 | 1.0 |
| X @Barts78 · Bluesky @barts78 · Mastodon @DrBarts · GitHub Barts78 · LinkedIn Phil-barter · Data: Opta | |||||||||||||||||||||
| Arsenal Individual Player Pressing Stats | |||||||||||||||||||||
| Liverpool vs Arsenal - 01-11-2026 | |||||||||||||||||||||
| Mins Played |
Summary
|
Positive Actions
|
Negative Actions
|
||||||||||||||||||
|---|---|---|---|---|---|---|---|---|---|---|---|---|---|---|---|---|---|---|---|---|---|
| Total Presses | PAdj Presses | Total Successful Presses | Total Failed Presses | Net | Press Efficiency | Solo Press | Group Press | Pushed Opponent Back | Direct Possession Win | Counter Attack | Counter Press | Won Possession | Led to Shot | Led to Goal | High Value Presses | Conceded Cross | Conceded Shot | Conceded Free Kick | Failed Press | ||
| Midfielder | |||||||||||||||||||||
| Bruno Guimarães | 64.72 | 8 | 7.6 | 5 | 3 | 2 | 62.5 | 2 | 6 | 0 | 2 | 0 | 3 | 3 | 0 | 0 | 3 | 0 | 0 | 0 | 3 |
| Christos Tzolis | 86.63 | 10 | 9.5 | 10 | 0 | 10 | 100.0 | 10 | 0 | 0 | 0 | 0 | 6 | 4 | 0 | 0 | 4 | 0 | 0 | 0 | 0 |
| Declan Rice | 99.48 | 12 | 11.5 | 8 | 4 | 4 | 66.7 | 10 | 2 | 0 | 1 | 0 | 5 | 4 | 1 | 0 | 4 | 0 | 0 | 1 | 3 |
| Martin Ødegaard | 90.95 | 10 | 9.5 | 10 | 0 | 10 | 100.0 | 10 | 0 | 0 | 1 | 2 | 2 | 6 | 0 | 0 | 6 | 0 | 0 | 0 | 0 |
| Mikel Merino | 8.53 | 1 | 1.0 | 1 | 0 | 1 | 100.0 | 1 | 0 | 0 | 1 | 0 | 1 | 1 | 0 | 0 | 1 | 0 | 0 | 0 | 0 |
| Myles Lewis-Skelly | 34.77 | 7 | 6.7 | 6 | 1 | 5 | 85.7 | 7 | 0 | 0 | 0 | 0 | 5 | 3 | 1 | 0 | 3 | 0 | 0 | 0 | 1 |
| Noni Madueke | 99.48 | 11 | 10.5 | 9 | 2 | 7 | 81.8 | 10 | 1 | 1 | 0 | 0 | 2 | 7 | 0 | 0 | 7 | 0 | 0 | 1 | 1 |
| Unit Mean | — | 8.4 | 8.0 | 7.0 | 1.4 | 5.6 | 85.2 | 7.1 | 1.3 | 0.1 | 0.7 | 0.3 | 3.4 | 4.0 | 0.3 | 0.0 | 4.0 | 0.0 | 0.0 | 0.3 | 1.1 |
| Keeper | |||||||||||||||||||||
| David Raya | 99.48 | 7 | 6.7 | 7 | 0 | 7 | 100.0 | 7 | 0 | 0 | 0 | 2 | 2 | 7 | 0 | 0 | 7 | 0 | 0 | 0 | 0 |
| Unit Mean | — | 7.0 | 6.7 | 7.0 | 0.0 | 7.0 | 100.0 | 7.0 | 0.0 | 0.0 | 0.0 | 2.0 | 2.0 | 7.0 | 0.0 | 0.0 | 7.0 | 0.0 | 0.0 | 0.0 | 0.0 |
| Defender | |||||||||||||||||||||
| Ezri Konsa | 99.48 | 17 | 16.2 | 13 | 4 | 9 | 76.5 | 15 | 2 | 0 | 2 | 2 | 3 | 12 | 0 | 0 | 12 | 0 | 2 | 0 | 2 |
| Gabriel Magalhães | 99.48 | 13 | 12.4 | 12 | 1 | 11 | 92.3 | 10 | 3 | 0 | 0 | 1 | 3 | 7 | 0 | 0 | 7 | 0 | 0 | 0 | 1 |
| Jurriën Timber | 99.48 | 26 | 24.8 | 24 | 2 | 22 | 92.3 | 23 | 3 | 0 | 1 | 3 | 8 | 18 | 0 | 0 | 18 | 0 | 1 | 0 | 1 |
| Piero Hincapié | 12.85 | 1 | 1.0 | 1 | 0 | 1 | 100.0 | 0 | 1 | 0 | 0 | 0 | 0 | 1 | 0 | 0 | 1 | 0 | 0 | 0 | 0 |
| Riccardo Calafiori | 99.48 | 19 | 18.1 | 15 | 4 | 11 | 78.9 | 14 | 5 | 0 | 1 | 1 | 11 | 8 | 0 | 0 | 8 | 1 | 0 | 0 | 3 |
| Unit Mean | — | 15.2 | 14.5 | 13.0 | 2.2 | 10.8 | 88.0 | 12.4 | 2.8 | 0.0 | 0.8 | 1.4 | 5.0 | 9.2 | 0.0 | 0.0 | 9.2 | 0.2 | 0.6 | 0.0 | 1.4 |
| Forward | |||||||||||||||||||||
| Kai Havertz | 86.85 | 10 | 9.5 | 9 | 1 | 8 | 90.0 | 10 | 0 | 0 | 1 | 0 | 2 | 2 | 0 | 0 | 2 | 0 | 0 | 0 | 1 |
| Viktor Gyökeres | 12.63 | 1 | 1.0 | 1 | 0 | 1 | 100.0 | 0 | 1 | 0 | 0 | 0 | 1 | 1 | 0 | 0 | 1 | 0 | 0 | 0 | 0 |
| Unit Mean | — | 5.5 | 5.2 | 5.0 | 0.5 | 4.5 | 95.0 | 5.0 | 0.5 | 0.0 | 0.5 | 0.0 | 1.5 | 1.5 | 0.0 | 0.0 | 1.5 | 0.0 | 0.0 | 0.0 | 0.5 |
| X @Barts78 · Bluesky @barts78 · Mastodon @DrBarts · GitHub Barts78 · LinkedIn Phil-barter · Data: Opta | |||||||||||||||||||||
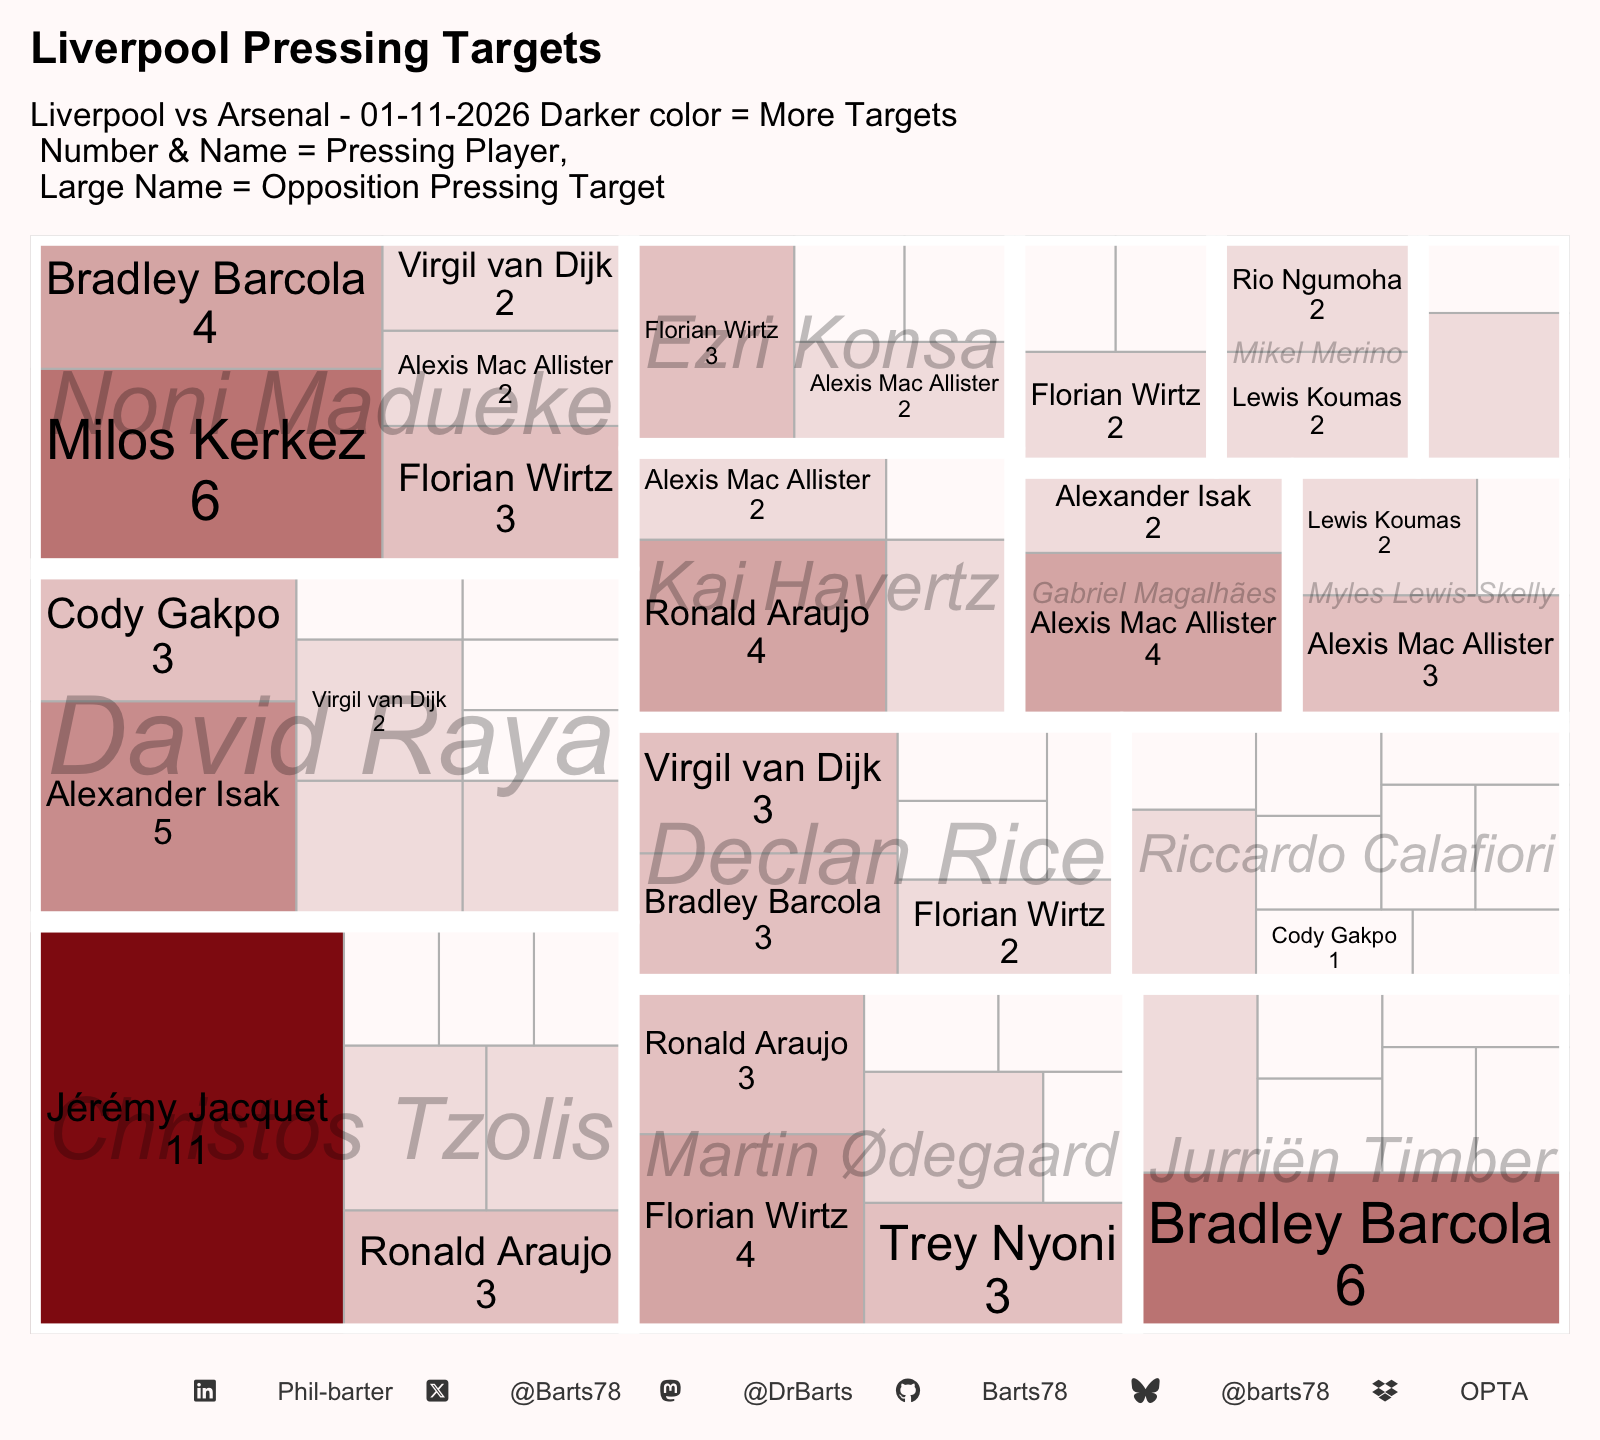
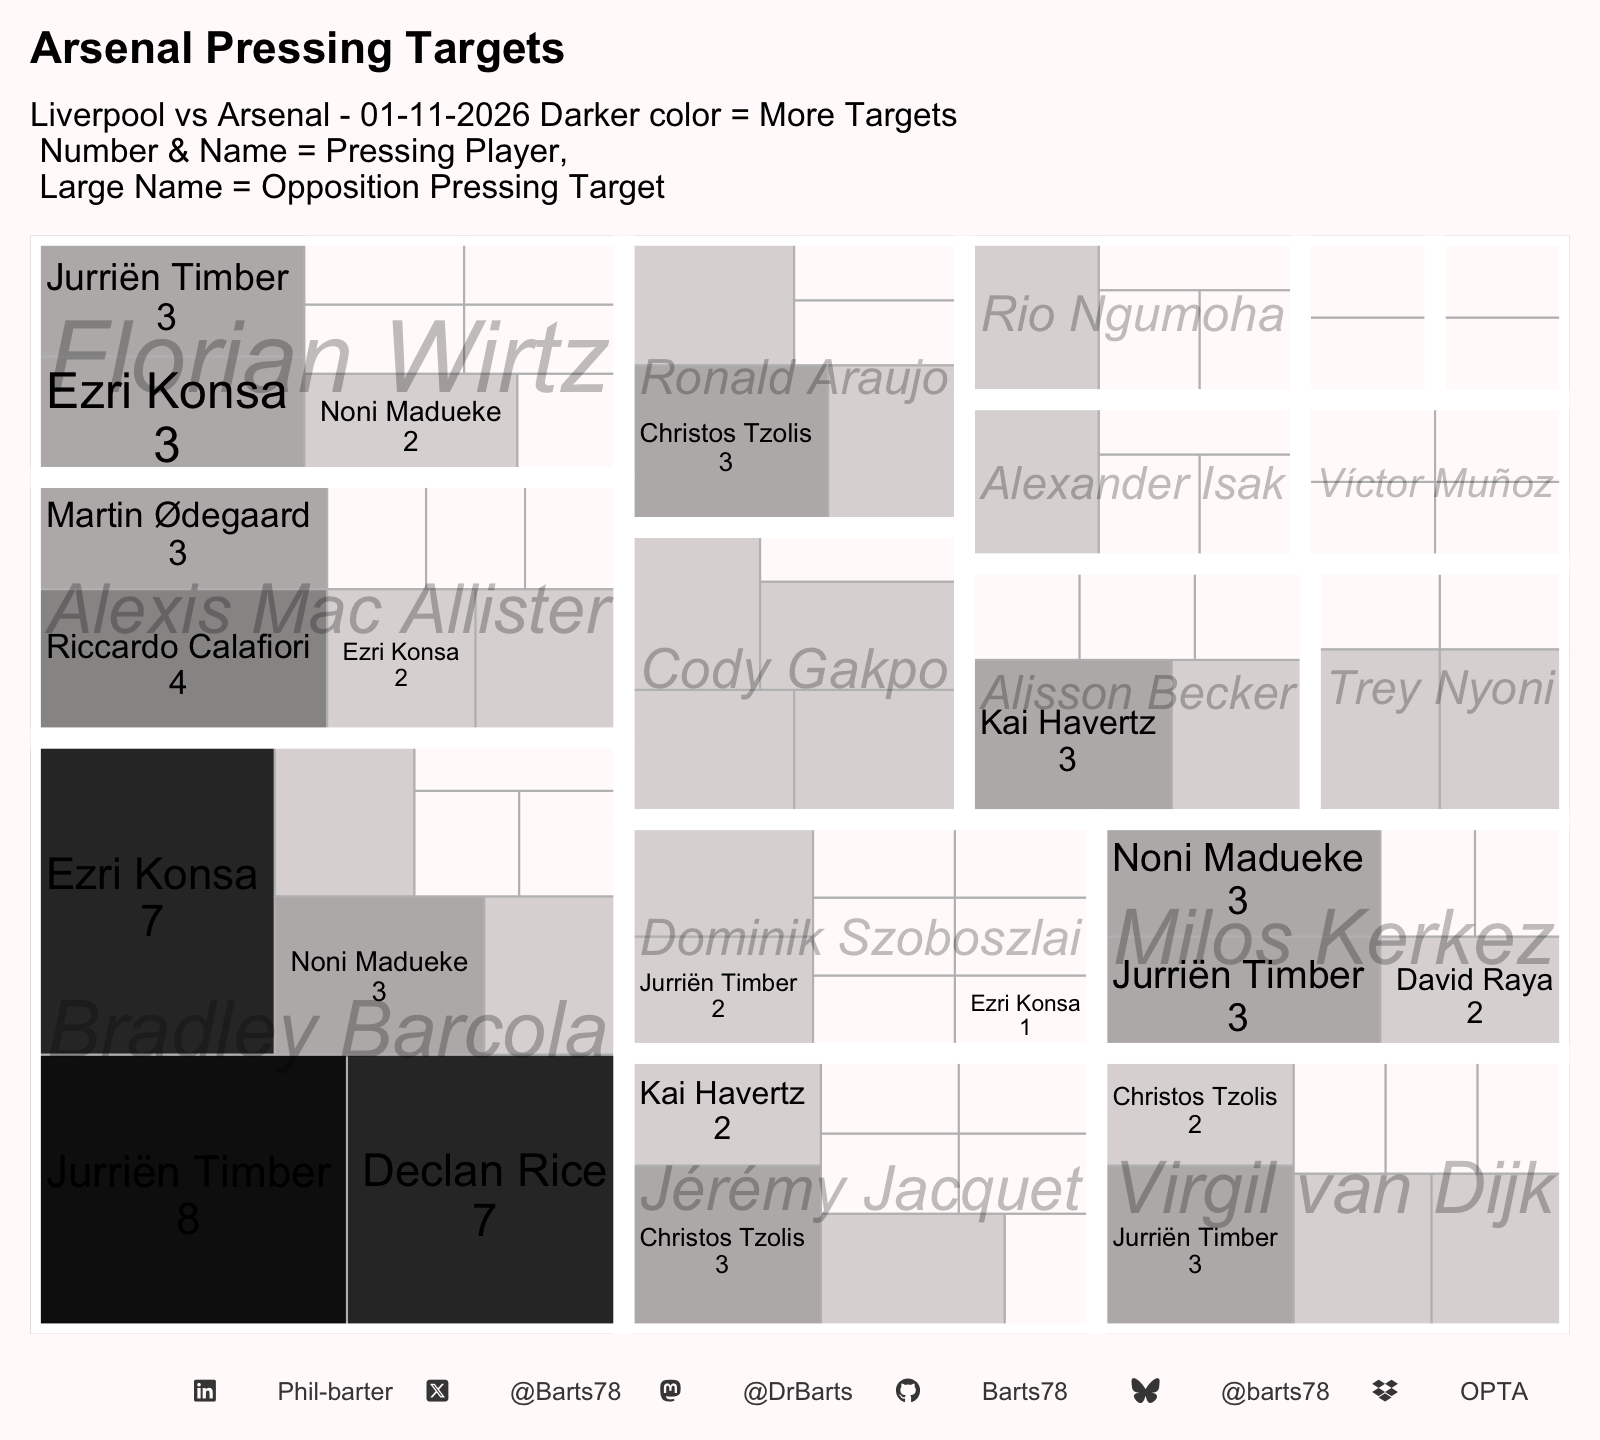
| Pressing Targeting Stats | |||||||||
| Liverpool vs Arsenal - 01-11-2026 | |||||||||
| Number Targets | Target Success | Target Fails | Targeted by Groups | Target Led to Goal or Shot | Targetted Possession Win | Targetted High Value Win | Target High Value Rate | Target Efficiency | |
|---|---|---|---|---|---|---|---|---|---|
| Christos Tzolis | 21 | 19 | 2 | 2 | 0 | 14 | 14 | 67% | 90% |
| David Raya | 18 | 17 | 1 | 1 | 0 | 10 | 10 | 56% | 94% |
| Noni Madueke | 16 | 13 | 3 | 5 | 0 | 9 | 9 | 56% | 81% |
| Jurriën Timber | 13 | 11 | 2 | 0 | 0 | 8 | 8 | 62% | 85% |
| Martin Ødegaard | 13 | 11 | 2 | 4 | 0 | 7 | 7 | 54% | 85% |
| Declan Rice | 11 | 9 | 2 | 0 | 0 | 6 | 6 | 55% | 82% |
| Riccardo Calafiori | 10 | 10 | 0 | 0 | 0 | 6 | 6 | 60% | 100% |
| Kai Havertz | 8 | 6 | 2 | 0 | 0 | 4 | 4 | 50% | 75% |
| Ezri Konsa | 7 | 7 | 0 | 0 | 0 | 6 | 6 | 86% | 100% |
| Gabriel Magalhães | 6 | 6 | 0 | 0 | 0 | 3 | 3 | 50% | 100% |
| Myles Lewis-Skelly | 6 | 5 | 1 | 0 | 0 | 1 | 1 | 17% | 83% |
| Bruno Guimarães | 4 | 4 | 0 | 0 | 0 | 4 | 4 | 100% | 100% |
| Mikel Merino | 4 | 0 | 4 | 0 | 0 | 1 | 1 | 25% | 0% |
| Piero Hincapié | 3 | 3 | 0 | 0 | 0 | 1 | 1 | 33% | 100% |
| Average | 10 | 9 | 1 | 1 | 0 | 6 | 6 | 1 | 1 |
| Total | 140 | 121 | 19 | 12 | 0 | 80 | 80 | 8 | 12 |
| X @Barts78 · Bluesky @barts78 · Mastodon @DrBarts · GitHub Barts78 · LinkedIn Phil-barter · Data: Opta | |||||||||
| Press Oppo Targeting Details | |||||||
| Liverpool vs Arsenal - 01-11-2026 | |||||||
| Presses | Successful Presses | Failed Presses | Led to Goal | Led to Shot | Won_Possession | High Value Presses | |
|---|---|---|---|---|---|---|---|
| Jérémy Jacquet | |||||||
| Christos Tzolis | 11 | 10 | 1 | 0 | 0 | 6 | 6 |
| Jurriën Timber | 1 | 1 | 0 | 0 | 0 | 1 | 1 |
| Kai Havertz | 1 | 1 | 0 | 0 | 0 | 1 | 1 |
| Martin Ødegaard | 1 | 1 | 0 | 0 | 0 | 0 | 0 |
| Bradley Barcola | |||||||
| Jurriën Timber | 6 | 4 | 2 | 0 | 0 | 2 | 2 |
| Noni Madueke | 4 | 3 | 1 | 0 | 0 | 2 | 2 |
| Declan Rice | 3 | 3 | 0 | 0 | 0 | 2 | 2 |
| Martin Ødegaard | 2 | 2 | 0 | 0 | 0 | 1 | 1 |
| Bruno Guimarães | 1 | 1 | 0 | 0 | 0 | 1 | 1 |
| David Raya | 1 | 1 | 0 | 0 | 0 | 1 | 1 |
| Ezri Konsa | 1 | 1 | 0 | 0 | 0 | 1 | 1 |
| Milos Kerkez | |||||||
| Noni Madueke | 6 | 5 | 1 | 0 | 0 | 3 | 3 |
| Christos Tzolis | 2 | 2 | 0 | 0 | 0 | 2 | 2 |
| Jurriën Timber | 2 | 2 | 0 | 0 | 0 | 2 | 2 |
| Ezri Konsa | 1 | 1 | 0 | 0 | 0 | 1 | 1 |
| Alexander Isak | |||||||
| David Raya | 5 | 5 | 0 | 0 | 0 | 2 | 2 |
| Gabriel Magalhães | 2 | 2 | 0 | 0 | 0 | 1 | 1 |
| Riccardo Calafiori | 1 | 1 | 0 | 0 | 0 | 1 | 1 |
| Alexis Mac Allister | |||||||
| Gabriel Magalhães | 4 | 4 | 0 | 0 | 0 | 2 | 2 |
| Myles Lewis-Skelly | 3 | 3 | 0 | 0 | 0 | 1 | 1 |
| David Raya | 2 | 1 | 1 | 0 | 0 | 1 | 1 |
| Ezri Konsa | 2 | 2 | 0 | 0 | 0 | 2 | 2 |
| Kai Havertz | 2 | 2 | 0 | 0 | 0 | 1 | 1 |
| Noni Madueke | 2 | 2 | 0 | 0 | 0 | 2 | 2 |
| Riccardo Calafiori | 2 | 2 | 0 | 0 | 0 | 1 | 1 |
| Bruno Guimarães | 1 | 1 | 0 | 0 | 0 | 1 | 1 |
| Christos Tzolis | 1 | 1 | 0 | 0 | 0 | 1 | 1 |
| Declan Rice | 1 | 1 | 0 | 0 | 0 | 1 | 1 |
| Martin Ødegaard | 1 | 1 | 0 | 0 | 0 | 0 | 0 |
| Florian Wirtz | |||||||
| Martin Ødegaard | 4 | 4 | 0 | 0 | 0 | 3 | 3 |
| Ezri Konsa | 3 | 3 | 0 | 0 | 0 | 2 | 2 |
| Noni Madueke | 3 | 3 | 0 | 0 | 0 | 2 | 2 |
| Bruno Guimarães | 2 | 2 | 0 | 0 | 0 | 2 | 2 |
| Declan Rice | 2 | 1 | 1 | 0 | 0 | 0 | 0 |
| Kai Havertz | 2 | 0 | 2 | 0 | 0 | 0 | 0 |
| Jurriën Timber | 1 | 1 | 0 | 0 | 0 | 0 | 0 |
| Riccardo Calafiori | 1 | 1 | 0 | 0 | 0 | 0 | 0 |
| Ronald Araujo | |||||||
| Kai Havertz | 4 | 4 | 0 | 0 | 0 | 2 | 2 |
| Christos Tzolis | 3 | 2 | 1 | 0 | 0 | 1 | 1 |
| Martin Ødegaard | 3 | 2 | 1 | 0 | 0 | 2 | 2 |
| David Raya | 1 | 1 | 0 | 0 | 0 | 1 | 1 |
| Declan Rice | 1 | 1 | 0 | 0 | 0 | 0 | 0 |
| Riccardo Calafiori | 1 | 1 | 0 | 0 | 0 | 1 | 1 |
| Cody Gakpo | |||||||
| David Raya | 3 | 3 | 0 | 0 | 0 | 2 | 2 |
| Christos Tzolis | 1 | 1 | 0 | 0 | 0 | 1 | 1 |
| Riccardo Calafiori | 1 | 1 | 0 | 0 | 0 | 1 | 1 |
| Trey Nyoni | |||||||
| Martin Ødegaard | 3 | 3 | 0 | 0 | 0 | 3 | 3 |
| Christos Tzolis | 1 | 1 | 0 | 0 | 0 | 1 | 1 |
| David Raya | 1 | 1 | 0 | 0 | 0 | 1 | 1 |
| Virgil van Dijk | |||||||
| Declan Rice | 3 | 3 | 0 | 0 | 0 | 3 | 3 |
| David Raya | 2 | 2 | 0 | 0 | 0 | 0 | 0 |
| Noni Madueke | 2 | 1 | 1 | 0 | 0 | 1 | 1 |
| Jurriën Timber | 1 | 1 | 0 | 0 | 0 | 1 | 1 |
| Martin Ødegaard | 1 | 1 | 0 | 0 | 0 | 0 | 0 |
| Riccardo Calafiori | 1 | 1 | 0 | 0 | 0 | 1 | 1 |
| Dominik Szoboszlai | |||||||
| Christos Tzolis | 2 | 2 | 0 | 0 | 0 | 2 | 2 |
| Jurriën Timber | 1 | 1 | 0 | 0 | 0 | 1 | 1 |
| Myles Lewis-Skelly | 1 | 1 | 0 | 0 | 0 | 0 | 0 |
| Piero Hincapié | 1 | 1 | 0 | 0 | 0 | 0 | 0 |
| Riccardo Calafiori | 1 | 1 | 0 | 0 | 0 | 0 | 0 |
| Lewis Koumas | |||||||
| Mikel Merino | 2 | 1 | 1 | 0 | 0 | 1 | 1 |
| Myles Lewis-Skelly | 2 | 1 | 1 | 0 | 0 | 0 | 0 |
| Jurriën Timber | 1 | 1 | 0 | 0 | 0 | 1 | 1 |
| Riccardo Calafiori | 1 | 1 | 0 | 0 | 0 | 0 | 0 |
| Rio Ngumoha | |||||||
| David Raya | 2 | 2 | 0 | 0 | 0 | 1 | 1 |
| Mikel Merino | 2 | 0 | 2 | 0 | 0 | 0 | 0 |
| Piero Hincapié | 2 | 2 | 0 | 0 | 0 | 1 | 1 |
| Declan Rice | 1 | 0 | 1 | 0 | 0 | 0 | 0 |
| Alisson Becker | |||||||
| David Raya | 1 | 1 | 0 | 0 | 0 | 1 | 1 |
| Víctor Muñoz | |||||||
| Riccardo Calafiori | 1 | 1 | 0 | 0 | 0 | 1 | 1 |
| X @Barts78 · Bluesky @barts78 · Mastodon @DrBarts · GitHub Barts78 · LinkedIn Phil-barter · Data: Opta | |||||||
| Pressing Targeting Stats | |||||||||
| Liverpool vs Arsenal - 01-11-2026 | |||||||||
| Number Targets | Target Success | Target Fails | Targeted by Groups | Target Led to Goal or Shot | Targetted Possession Win | Targetted High Value Win | Target High Value Rate | Target Efficiency | |
|---|---|---|---|---|---|---|---|---|---|
| Bradley Barcola | 27 | 24 | 3 | 4 | 2 | 16 | 16 | 59% | 89% |
| Florian Wirtz | 13 | 13 | 0 | 0 | 0 | 11 | 11 | 85% | 100% |
| Jérémy Jacquet | 12 | 12 | 0 | 0 | 0 | 7 | 7 | 58% | 100% |
| Virgil van Dijk | 12 | 10 | 2 | 3 | 0 | 4 | 4 | 33% | 83% |
| Alexis Mac Allister | 11 | 6 | 5 | 3 | 0 | 4 | 4 | 36% | 55% |
| Dominik Szoboszlai | 10 | 10 | 0 | 1 | 0 | 7 | 7 | 70% | 100% |
| Milos Kerkez | 10 | 10 | 0 | 0 | 0 | 7 | 7 | 70% | 100% |
| Ronald Araujo | 9 | 8 | 1 | 1 | 0 | 2 | 2 | 22% | 89% |
| Alisson Becker | 8 | 7 | 1 | 0 | 0 | 3 | 3 | 38% | 88% |
| Cody Gakpo | 8 | 8 | 0 | 2 | 0 | 6 | 6 | 75% | 100% |
| Alexander Isak | 5 | 3 | 2 | 0 | 0 | 3 | 3 | 60% | 60% |
| Rio Ngumoha | 5 | 3 | 2 | 0 | 0 | 2 | 2 | 40% | 60% |
| Trey Nyoni | 5 | 3 | 2 | 0 | 0 | 1 | 1 | 20% | 60% |
| Víctor Muñoz | 4 | 4 | 0 | 2 | 0 | 4 | 4 | 100% | 100% |
| Kostas Tsimikas | 2 | 2 | 0 | 0 | 0 | 2 | 2 | 100% | 100% |
| Lewis Koumas | 2 | 2 | 0 | 0 | 0 | 1 | 1 | 50% | 100% |
| Average | 9 | 8 | 1 | 1 | 0 | 5 | 5 | 1 | 1 |
| Total | 143 | 125 | 18 | 16 | 2 | 80 | 80 | 9 | 14 |
| X @Barts78 · Bluesky @barts78 · Mastodon @DrBarts · GitHub Barts78 · LinkedIn Phil-barter · Data: Opta | |||||||||
| Press Oppo Targeting Details | |||||||
| Liverpool vs Arsenal - 01-11-2026 | |||||||
| Presses | Successful Presses | Failed Presses | Led to Goal | Led to Shot | Won_Possession | High Value Presses | |
|---|---|---|---|---|---|---|---|
| Jurriën Timber | |||||||
| Bradley Barcola | 8 | 8 | 0 | 0 | 0 | 7 | 7 |
| Florian Wirtz | 3 | 3 | 0 | 0 | 0 | 2 | 2 |
| Milos Kerkez | 3 | 3 | 0 | 0 | 0 | 2 | 2 |
| Virgil van Dijk | 3 | 3 | 0 | 0 | 0 | 1 | 1 |
| Alisson Becker | 2 | 2 | 0 | 0 | 0 | 1 | 1 |
| Cody Gakpo | 2 | 2 | 0 | 0 | 0 | 2 | 2 |
| Dominik Szoboszlai | 2 | 2 | 0 | 0 | 0 | 1 | 1 |
| Alexander Isak | 1 | 1 | 0 | 0 | 0 | 1 | 1 |
| Jérémy Jacquet | 1 | 1 | 0 | 0 | 0 | 1 | 1 |
| Trey Nyoni | 1 | 0 | 1 | 0 | 0 | 0 | 0 |
| Declan Rice | |||||||
| Bradley Barcola | 7 | 5 | 2 | 0 | 1 | 2 | 2 |
| Dominik Szoboszlai | 1 | 1 | 0 | 0 | 0 | 1 | 1 |
| Florian Wirtz | 1 | 1 | 0 | 0 | 0 | 1 | 1 |
| Lewis Koumas | 1 | 1 | 0 | 0 | 0 | 0 | 0 |
| Milos Kerkez | 1 | 1 | 0 | 0 | 0 | 0 | 0 |
| Virgil van Dijk | 1 | 0 | 1 | 0 | 0 | 0 | 0 |
| Ezri Konsa | |||||||
| Bradley Barcola | 7 | 6 | 1 | 0 | 0 | 4 | 4 |
| Florian Wirtz | 3 | 3 | 0 | 0 | 0 | 3 | 3 |
| Alexis Mac Allister | 2 | 1 | 1 | 0 | 0 | 0 | 0 |
| Ronald Araujo | 2 | 2 | 0 | 0 | 0 | 2 | 2 |
| Dominik Szoboszlai | 1 | 1 | 0 | 0 | 0 | 1 | 1 |
| Jérémy Jacquet | 1 | 1 | 0 | 0 | 0 | 1 | 1 |
| Lewis Koumas | 1 | 1 | 0 | 0 | 0 | 1 | 1 |
| Riccardo Calafiori | |||||||
| Alexis Mac Allister | 4 | 2 | 2 | 0 | 0 | 1 | 1 |
| Cody Gakpo | 2 | 2 | 0 | 0 | 0 | 1 | 1 |
| Dominik Szoboszlai | 2 | 2 | 0 | 0 | 0 | 1 | 1 |
| Jérémy Jacquet | 2 | 2 | 0 | 0 | 0 | 1 | 1 |
| Rio Ngumoha | 2 | 1 | 1 | 0 | 0 | 0 | 0 |
| Ronald Araujo | 2 | 2 | 0 | 0 | 0 | 0 | 0 |
| Trey Nyoni | 2 | 2 | 0 | 0 | 0 | 1 | 1 |
| Bradley Barcola | 1 | 1 | 0 | 0 | 0 | 1 | 1 |
| Florian Wirtz | 1 | 1 | 0 | 0 | 0 | 1 | 1 |
| Víctor Muñoz | 1 | 1 | 0 | 0 | 0 | 1 | 1 |
| Christos Tzolis | |||||||
| Jérémy Jacquet | 3 | 3 | 0 | 0 | 0 | 2 | 2 |
| Ronald Araujo | 3 | 3 | 0 | 0 | 0 | 0 | 0 |
| Trey Nyoni | 2 | 2 | 0 | 0 | 0 | 1 | 1 |
| Virgil van Dijk | 2 | 2 | 0 | 0 | 0 | 1 | 1 |
| Kai Havertz | |||||||
| Alisson Becker | 3 | 2 | 1 | 0 | 0 | 0 | 0 |
| Jérémy Jacquet | 2 | 2 | 0 | 0 | 0 | 1 | 1 |
| Bradley Barcola | 1 | 1 | 0 | 0 | 0 | 1 | 1 |
| Florian Wirtz | 1 | 1 | 0 | 0 | 0 | 0 | 0 |
| Rio Ngumoha | 1 | 1 | 0 | 0 | 0 | 0 | 0 |
| Trey Nyoni | 1 | 1 | 0 | 0 | 0 | 0 | 0 |
| Virgil van Dijk | 1 | 1 | 0 | 0 | 0 | 0 | 0 |
| Martin Ødegaard | |||||||
| Alexis Mac Allister | 3 | 3 | 0 | 0 | 0 | 2 | 2 |
| Bradley Barcola | 2 | 2 | 0 | 0 | 0 | 1 | 1 |
| Virgil van Dijk | 2 | 2 | 0 | 0 | 0 | 0 | 0 |
| Dominik Szoboszlai | 1 | 1 | 0 | 0 | 0 | 1 | 1 |
| Jérémy Jacquet | 1 | 1 | 0 | 0 | 0 | 1 | 1 |
| Milos Kerkez | 1 | 1 | 0 | 0 | 0 | 1 | 1 |
| Noni Madueke | |||||||
| Bradley Barcola | 3 | 3 | 0 | 0 | 0 | 1 | 1 |
| Milos Kerkez | 3 | 3 | 0 | 0 | 0 | 2 | 2 |
| Florian Wirtz | 2 | 2 | 0 | 0 | 0 | 2 | 2 |
| Alexander Isak | 1 | 0 | 1 | 0 | 0 | 0 | 0 |
| Kostas Tsimikas | 1 | 1 | 0 | 0 | 0 | 1 | 1 |
| Virgil van Dijk | 1 | 1 | 0 | 0 | 0 | 1 | 1 |
| Bruno Guimarães | |||||||
| Bradley Barcola | 2 | 1 | 1 | 0 | 0 | 0 | 0 |
| Cody Gakpo | 2 | 2 | 0 | 0 | 0 | 2 | 2 |
| Alexis Mac Allister | 1 | 0 | 1 | 0 | 0 | 0 | 0 |
| Alisson Becker | 1 | 1 | 0 | 0 | 0 | 0 | 0 |
| Florian Wirtz | 1 | 1 | 0 | 0 | 0 | 1 | 1 |
| Ronald Araujo | 1 | 0 | 1 | 0 | 0 | 0 | 0 |
| David Raya | |||||||
| Alexander Isak | 2 | 2 | 0 | 0 | 0 | 2 | 2 |
| Milos Kerkez | 2 | 2 | 0 | 0 | 0 | 2 | 2 |
| Alexis Mac Allister | 1 | 1 | 0 | 0 | 0 | 1 | 1 |
| Cody Gakpo | 1 | 1 | 0 | 0 | 0 | 1 | 1 |
| Víctor Muñoz | 1 | 1 | 0 | 0 | 0 | 1 | 1 |
| Gabriel Magalhães | |||||||
| Alexis Mac Allister | 2 | 1 | 1 | 0 | 0 | 0 | 0 |
| Cody Gakpo | 2 | 2 | 0 | 0 | 0 | 1 | 1 |
| Virgil van Dijk | 2 | 2 | 0 | 0 | 0 | 1 | 1 |
| Alisson Becker | 1 | 1 | 0 | 0 | 0 | 1 | 1 |
| Florian Wirtz | 1 | 1 | 0 | 0 | 0 | 1 | 1 |
| Jérémy Jacquet | 1 | 1 | 0 | 0 | 0 | 0 | 0 |
| Kostas Tsimikas | 1 | 1 | 0 | 0 | 0 | 1 | 1 |
| Rio Ngumoha | 1 | 1 | 0 | 0 | 0 | 1 | 1 |
| Ronald Araujo | 1 | 1 | 0 | 0 | 0 | 0 | 0 |
| Víctor Muñoz | 1 | 1 | 0 | 0 | 0 | 1 | 1 |
| Mikel Merino | |||||||
| Dominik Szoboszlai | 1 | 1 | 0 | 0 | 0 | 1 | 1 |
| Myles Lewis-Skelly | |||||||
| Alexander Isak | 1 | 1 | 0 | 0 | 0 | 0 | 0 |
| Alexis Mac Allister | 1 | 0 | 1 | 0 | 0 | 0 | 0 |
| Alisson Becker | 1 | 1 | 0 | 0 | 0 | 1 | 1 |
| Bradley Barcola | 1 | 1 | 0 | 0 | 1 | 1 | 1 |
| Dominik Szoboszlai | 1 | 1 | 0 | 0 | 0 | 0 | 0 |
| Jérémy Jacquet | 1 | 1 | 0 | 0 | 0 | 0 | 0 |
| Rio Ngumoha | 1 | 1 | 0 | 0 | 0 | 1 | 1 |
| Piero Hincapié | |||||||
| Víctor Muñoz | 1 | 1 | 0 | 0 | 0 | 1 | 1 |
| Viktor Gyökeres | |||||||
| Dominik Szoboszlai | 1 | 1 | 0 | 0 | 0 | 1 | 1 |
| X @Barts78 · Bluesky @barts78 · Mastodon @DrBarts · GitHub Barts78 · LinkedIn Phil-barter · Data: Opta | |||||||
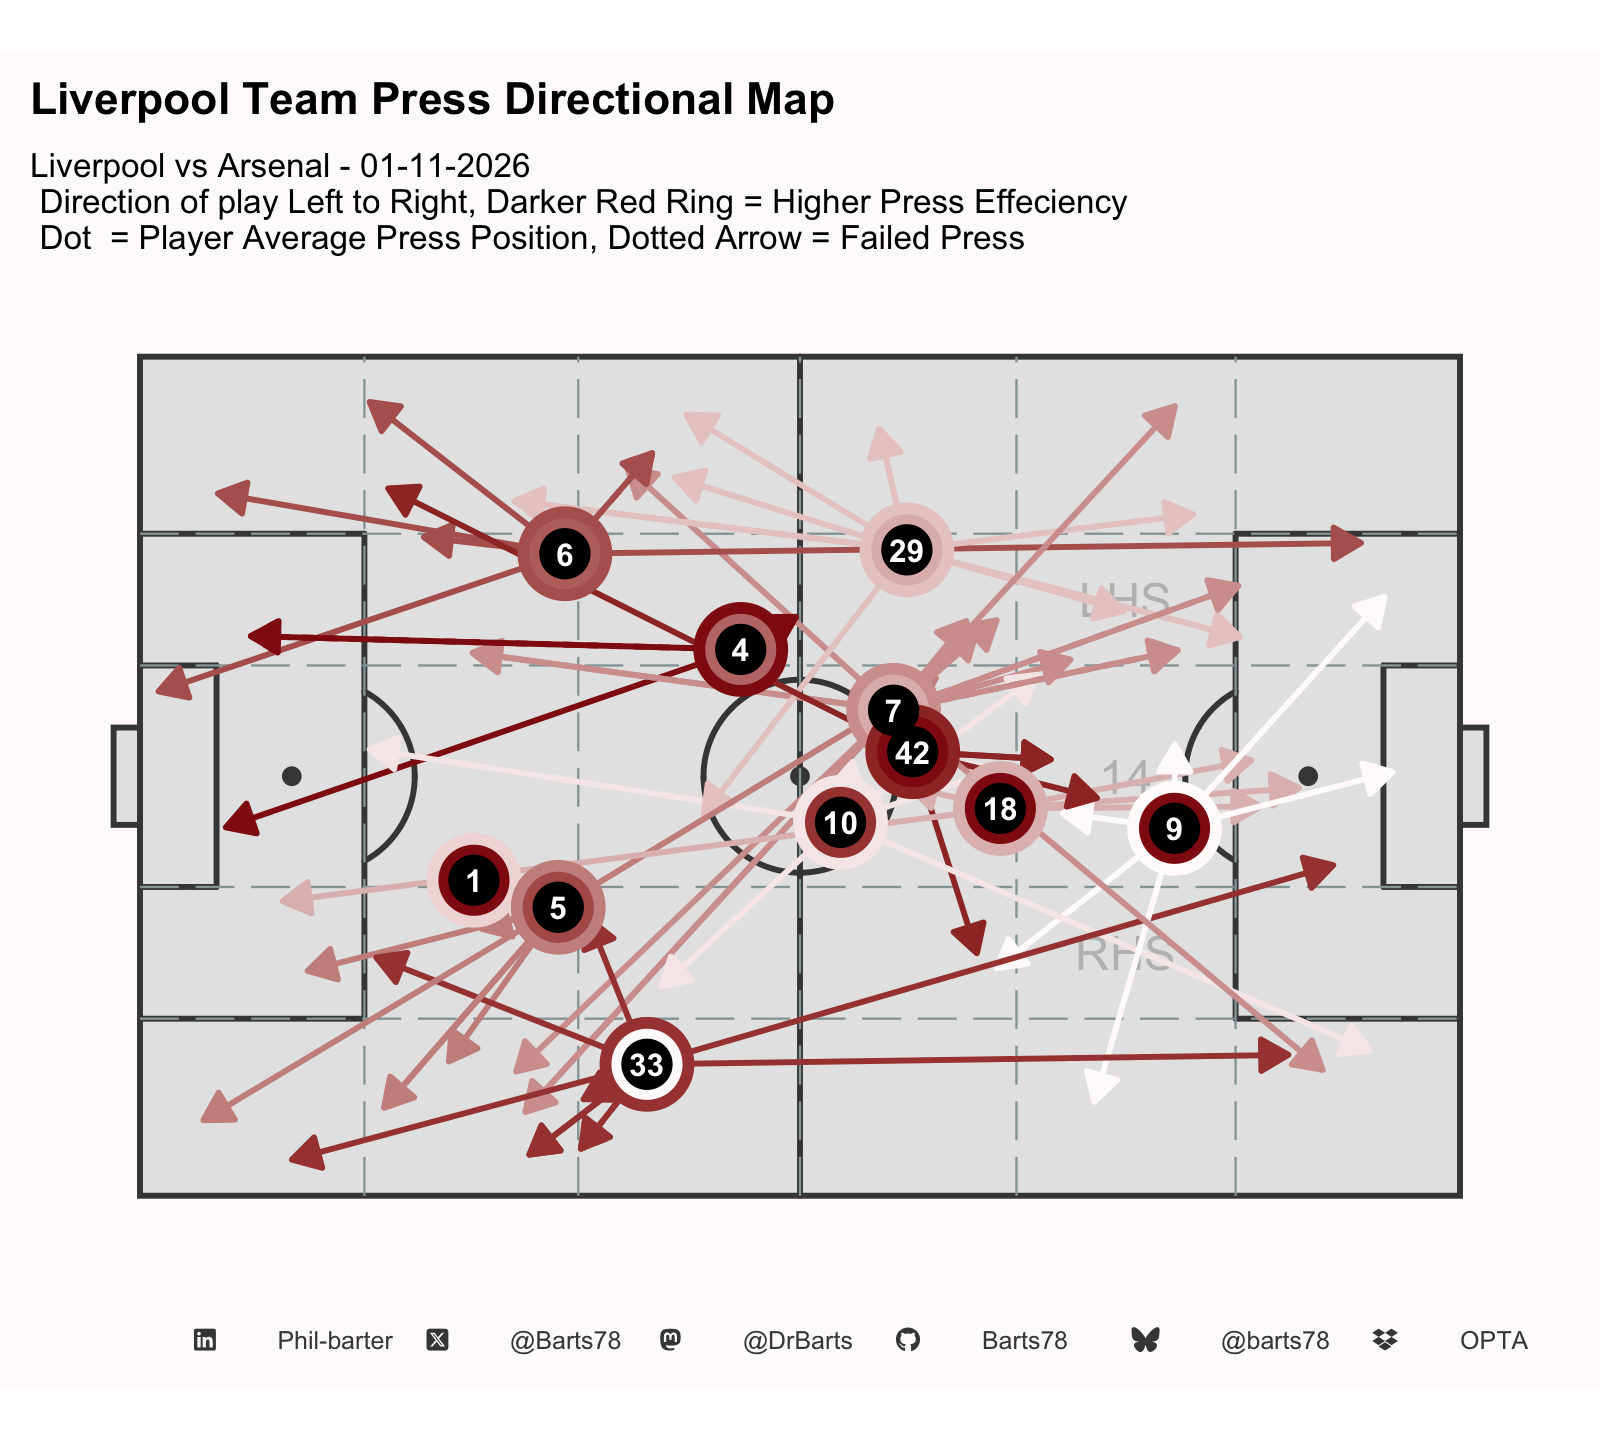
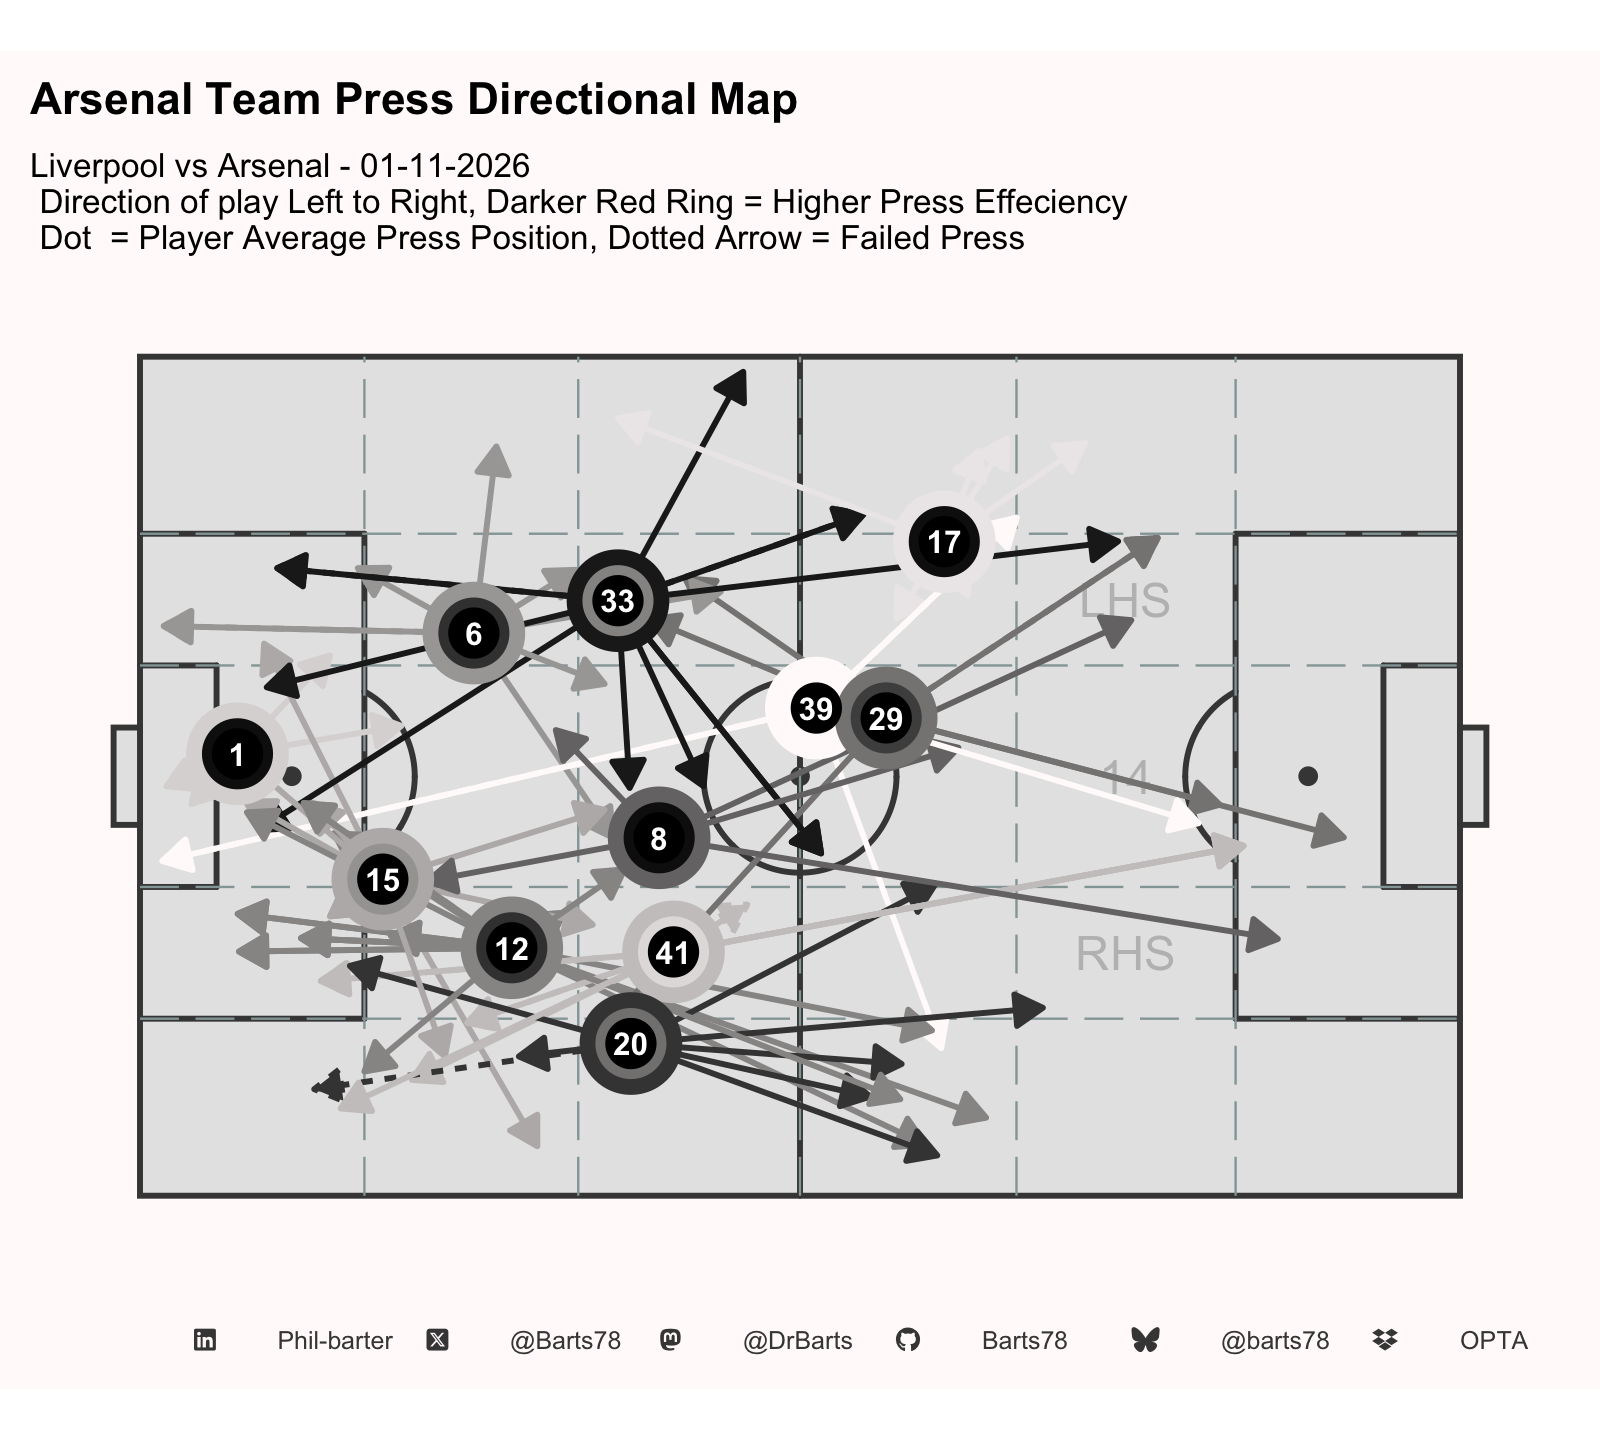
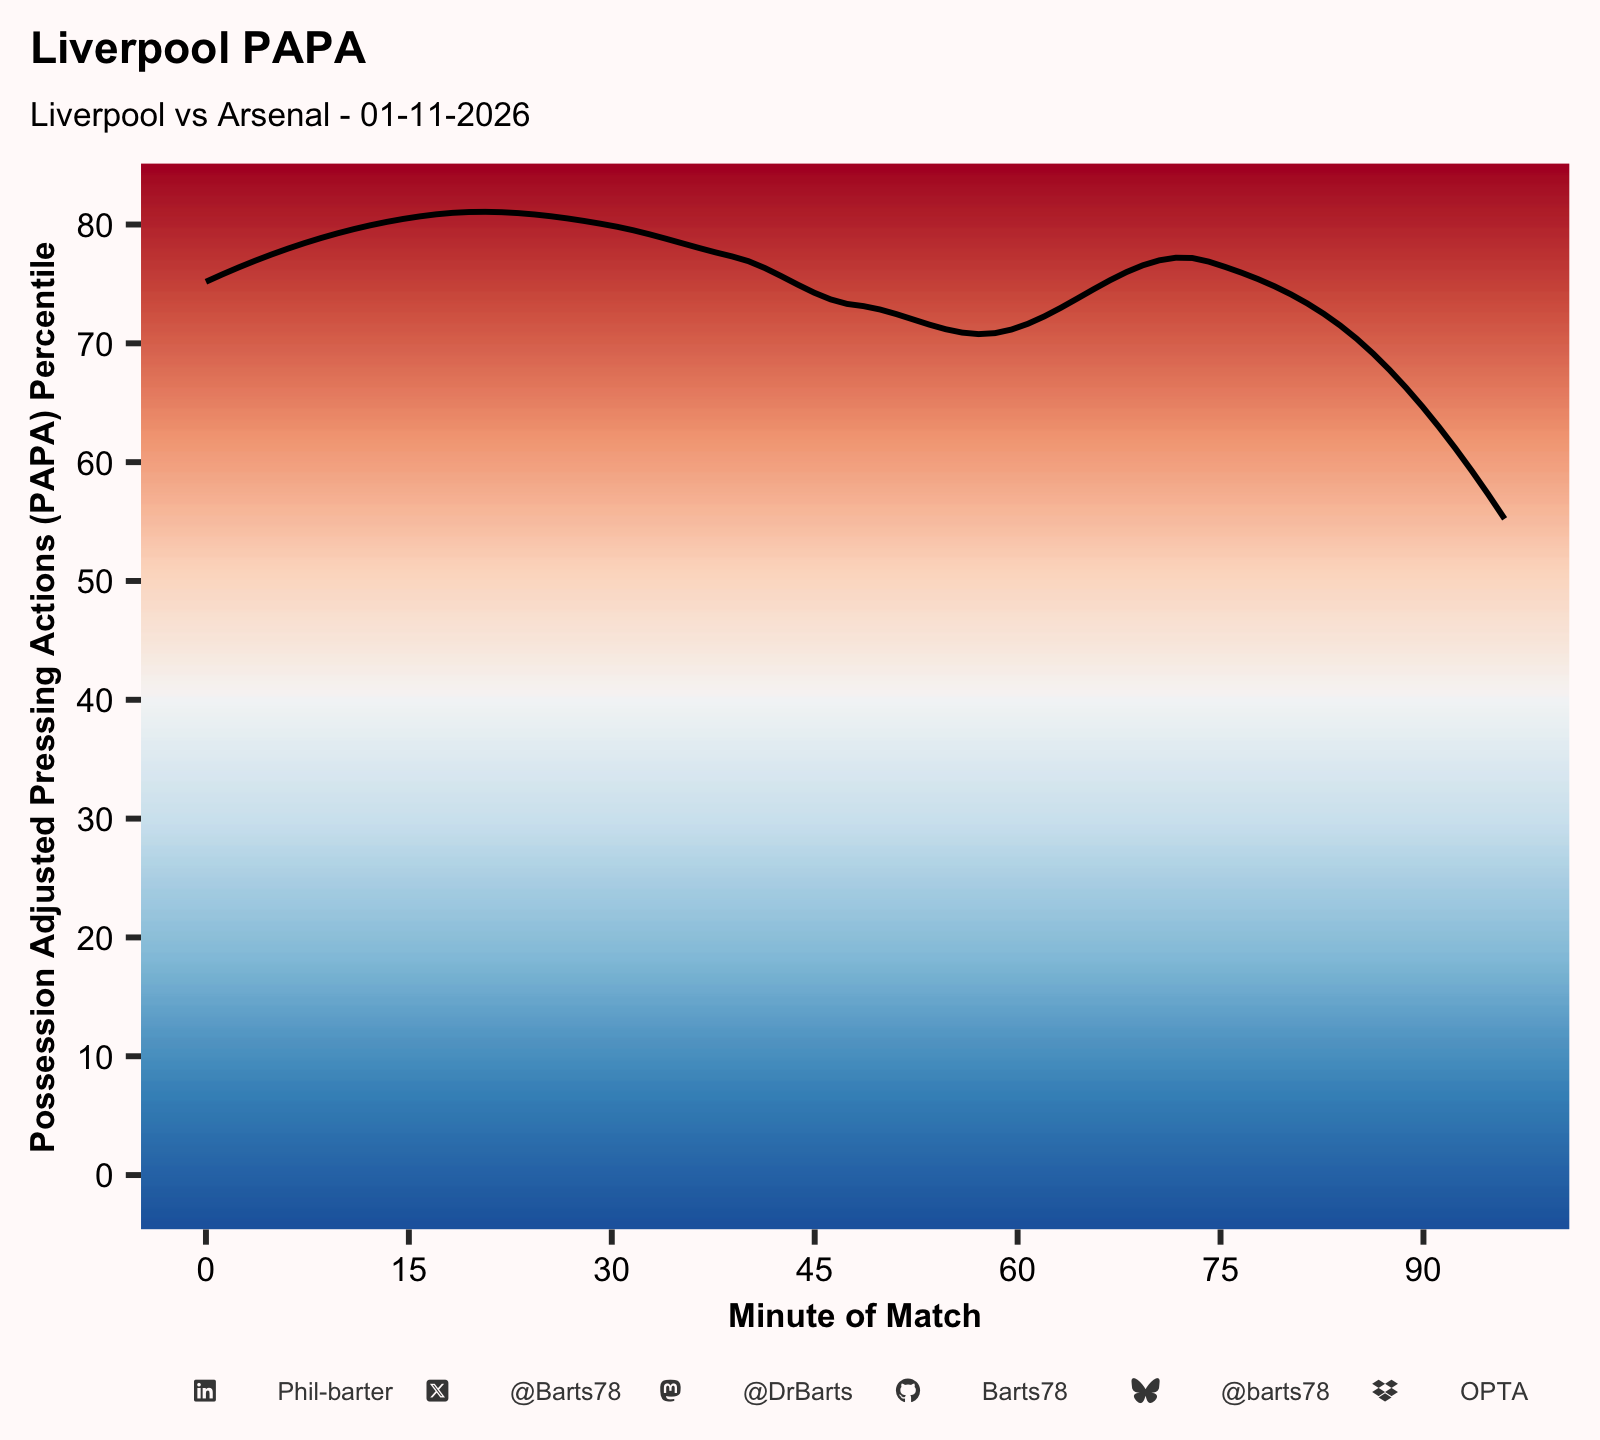
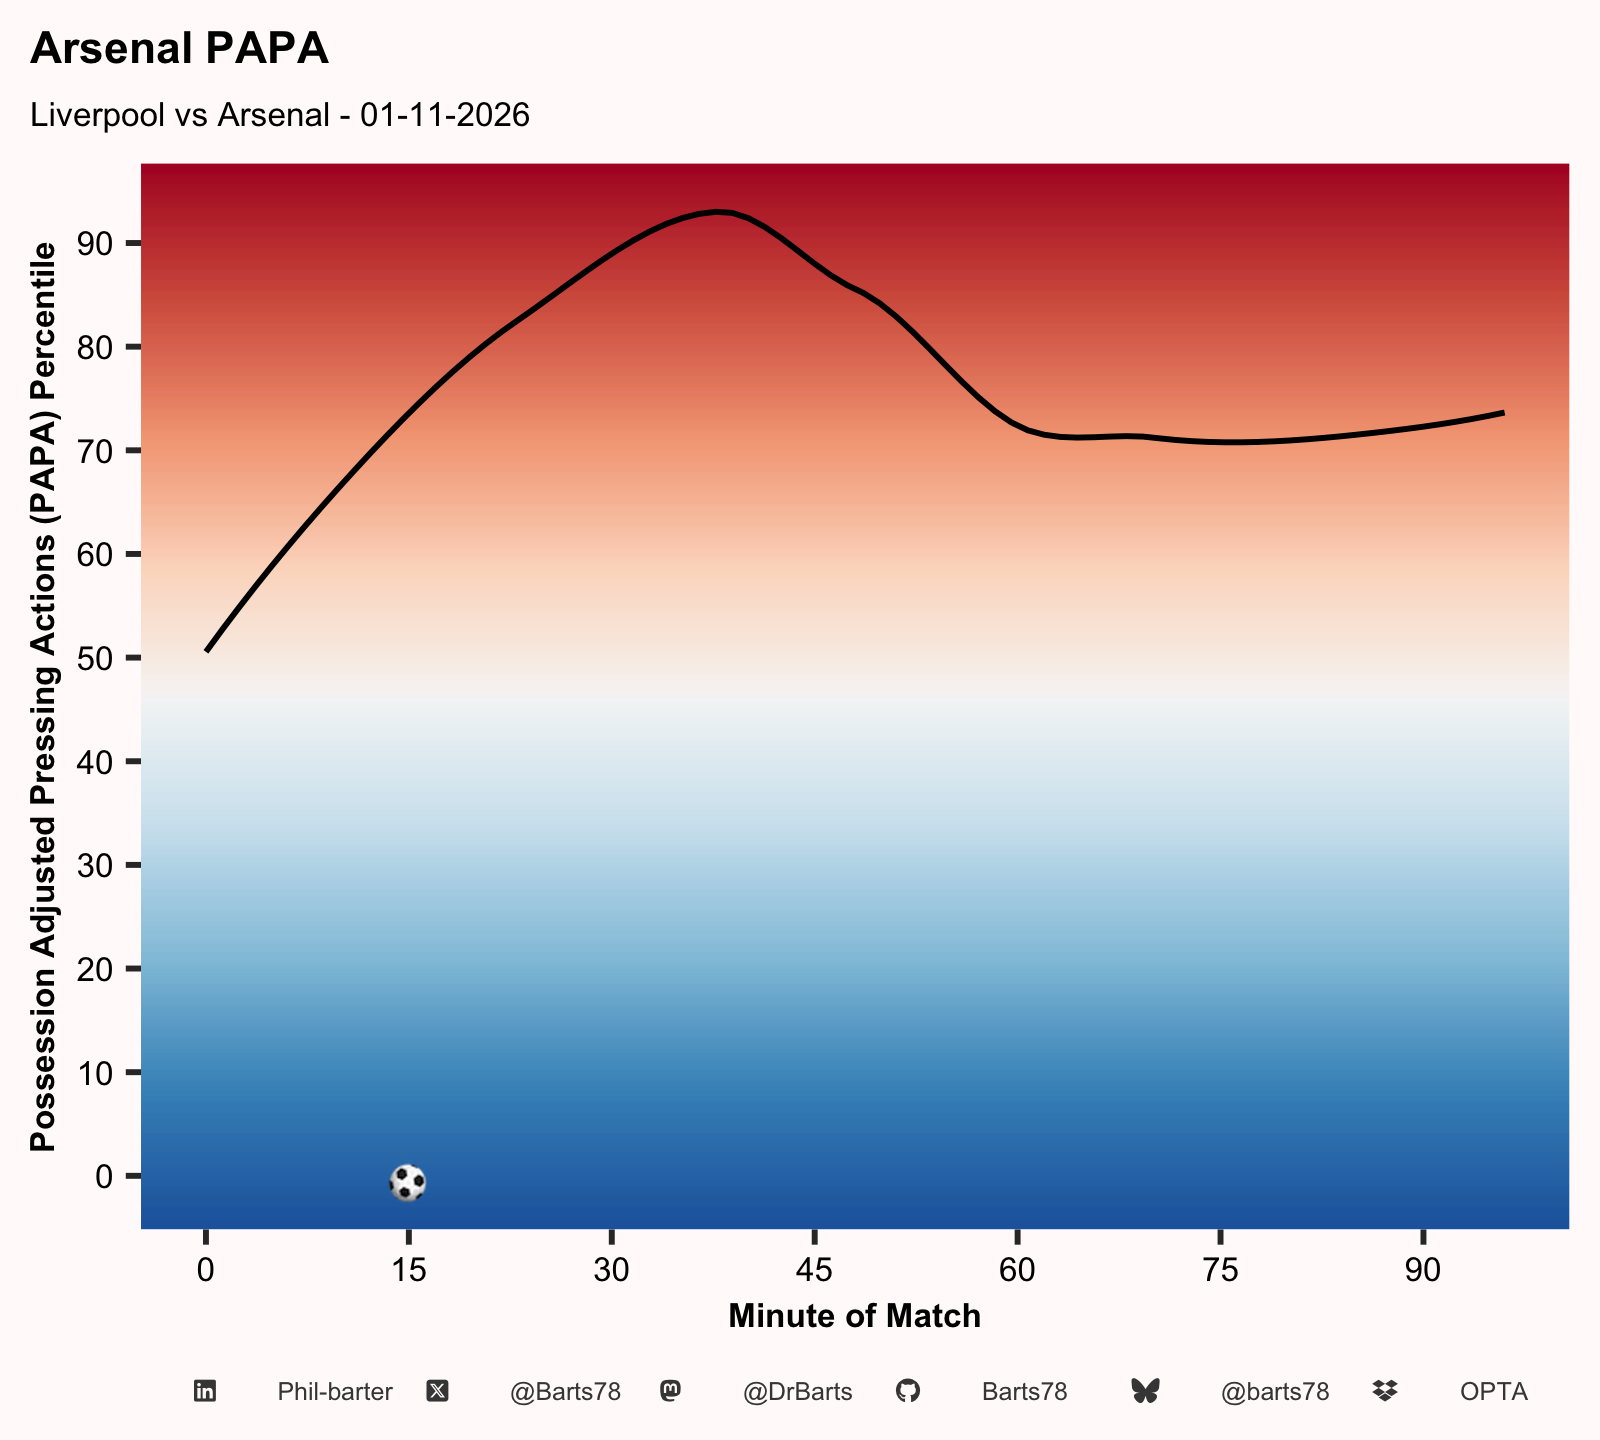
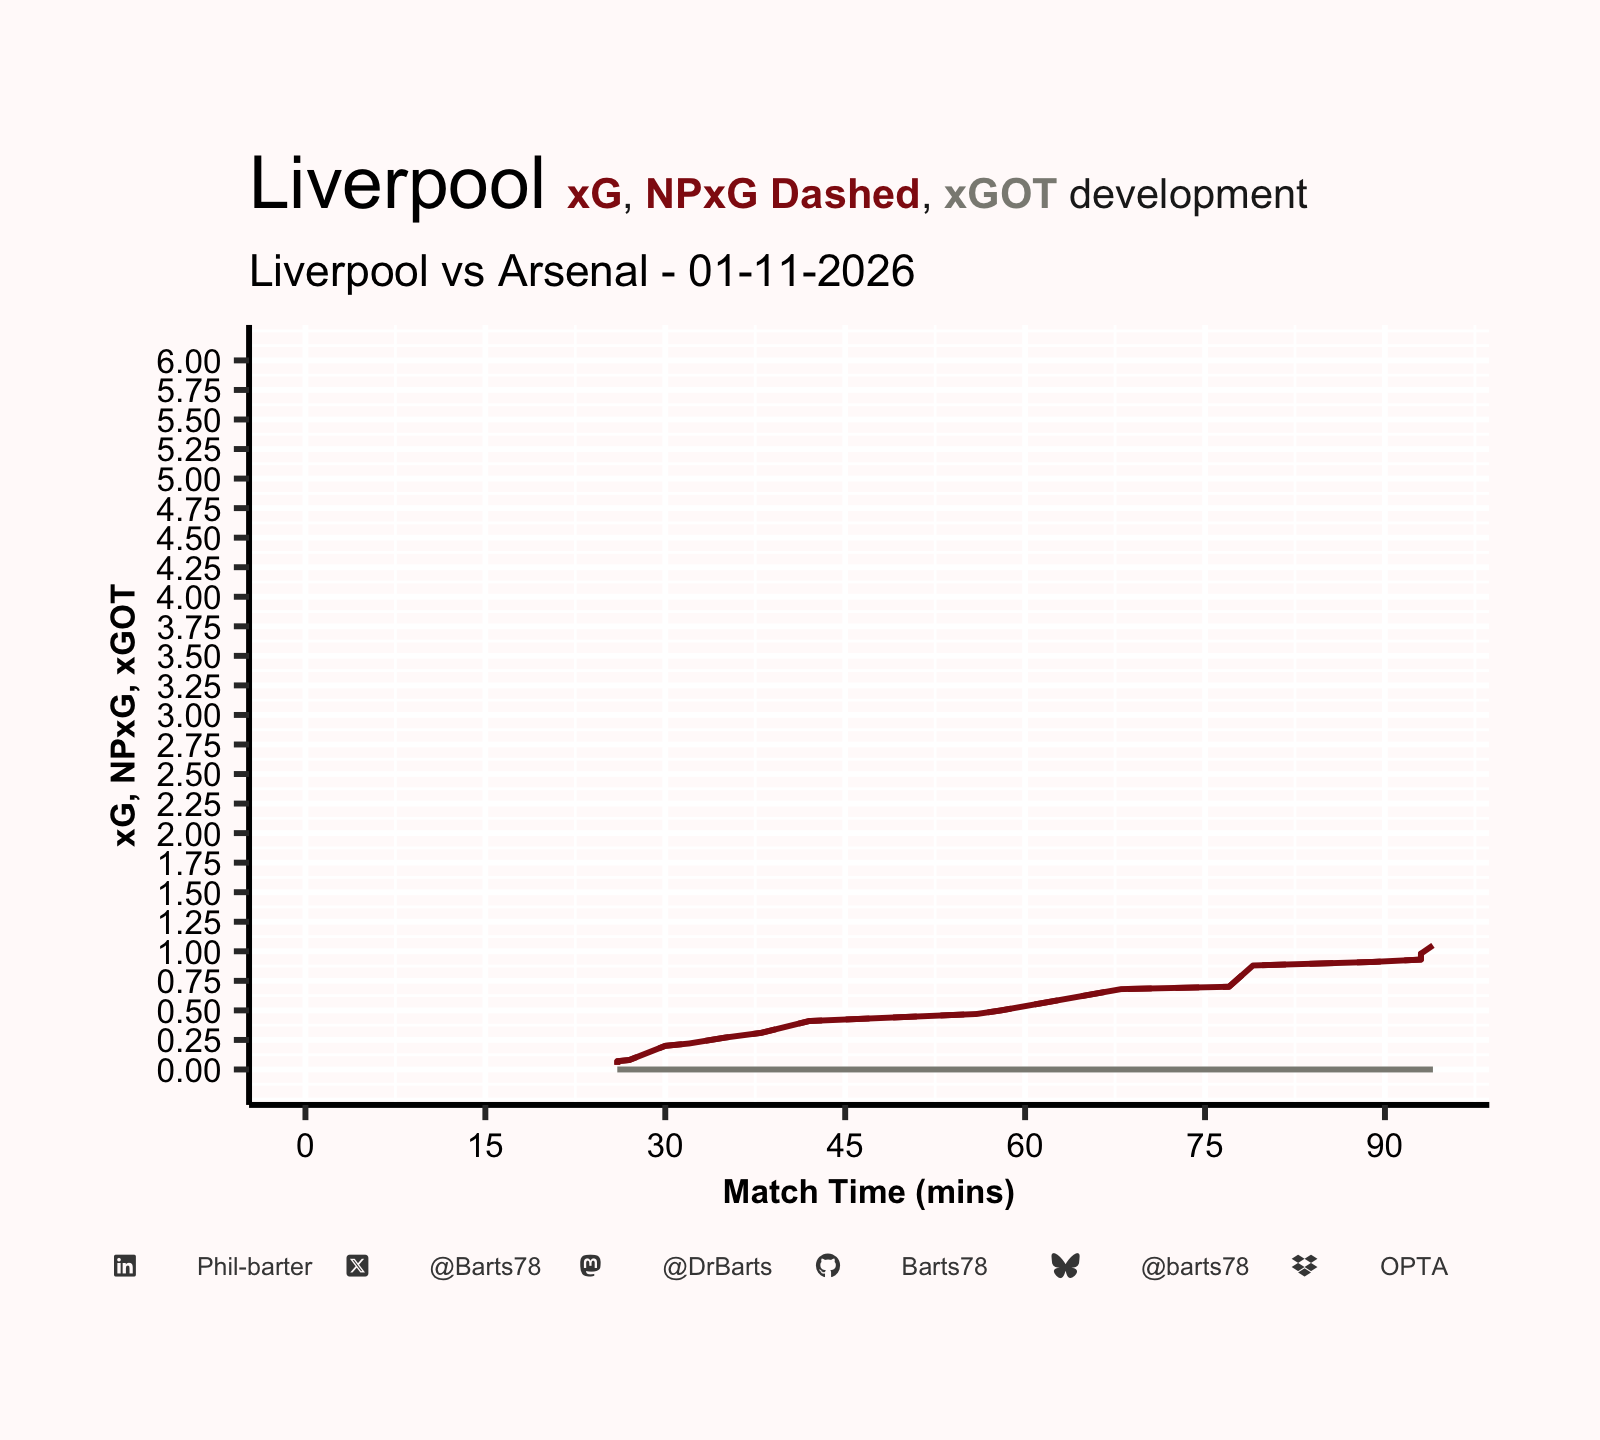
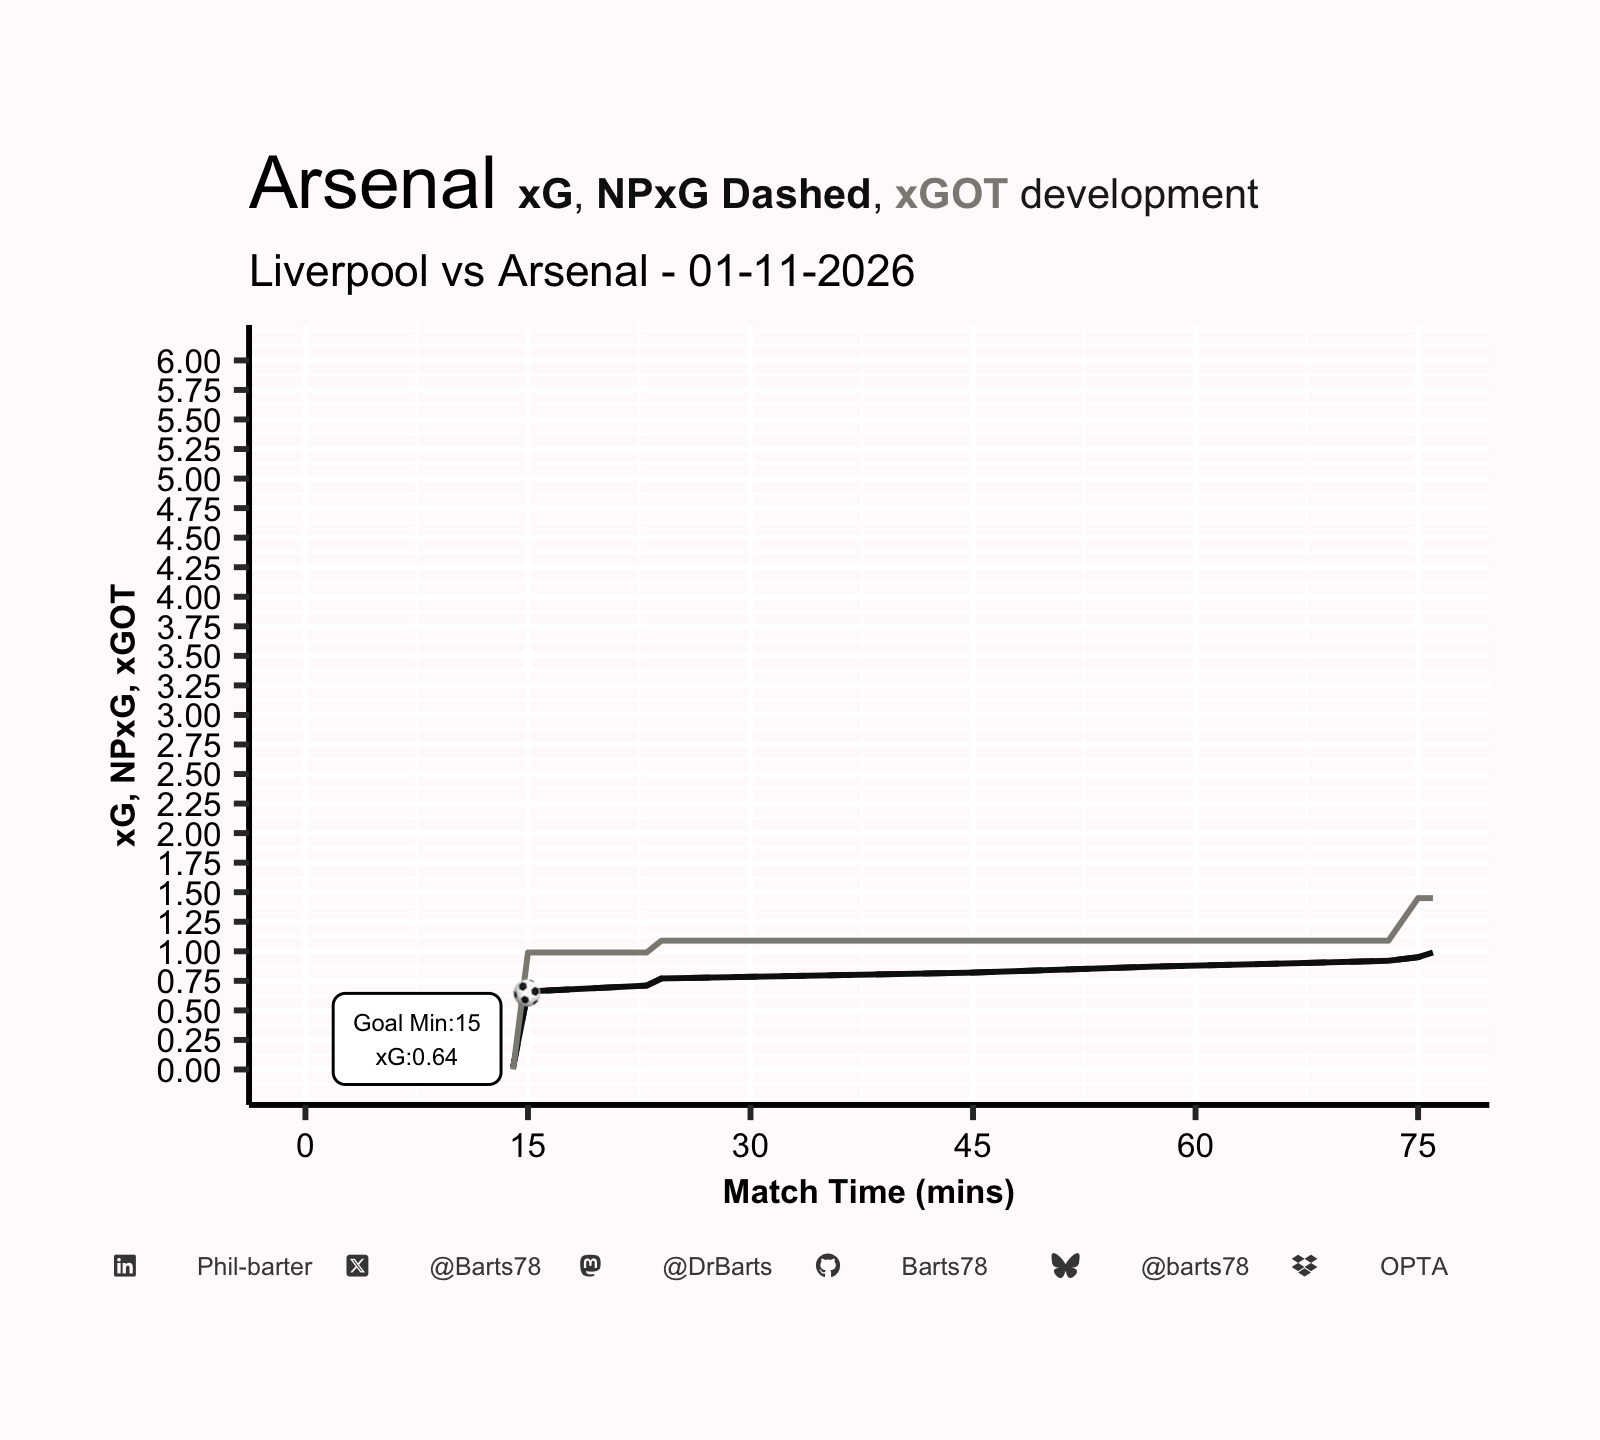
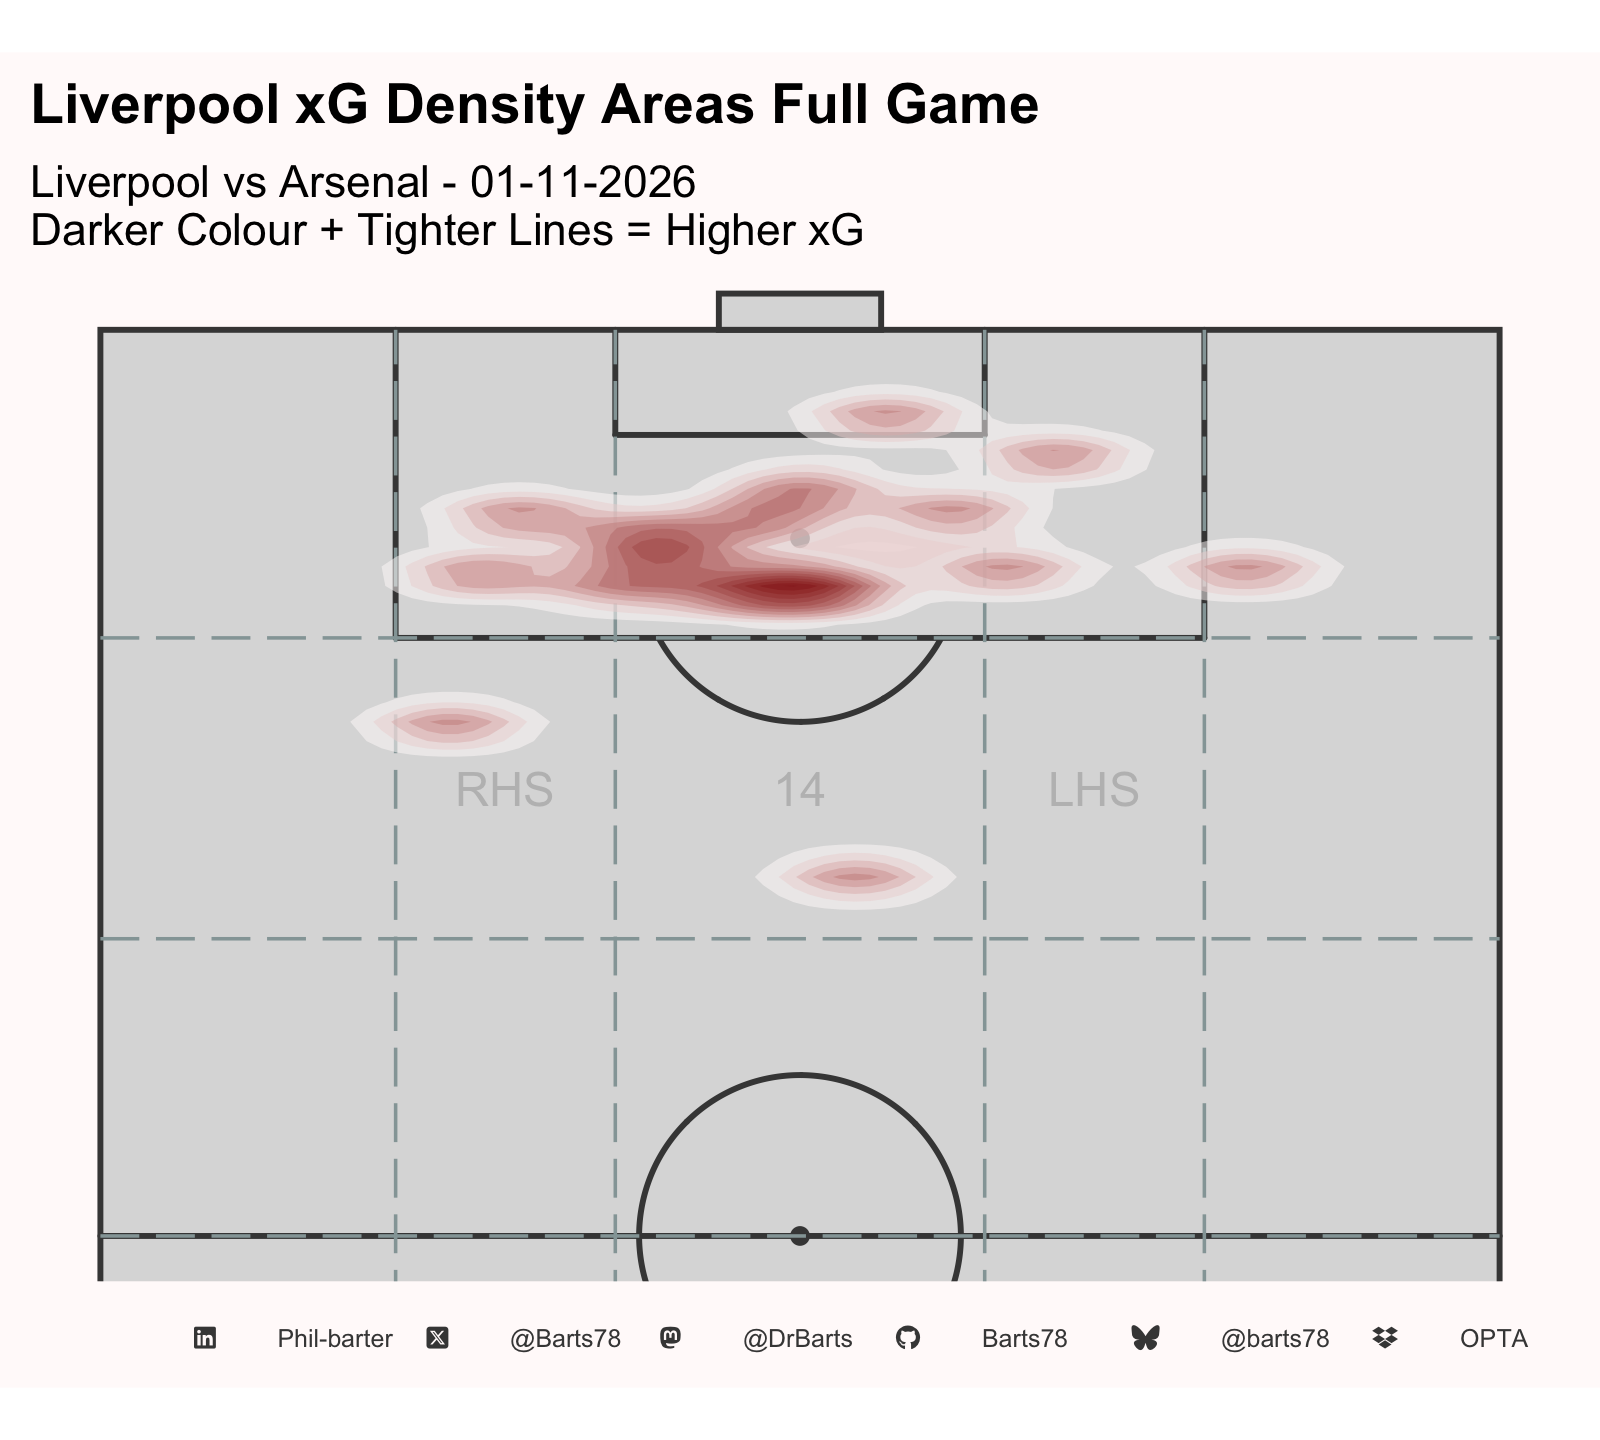
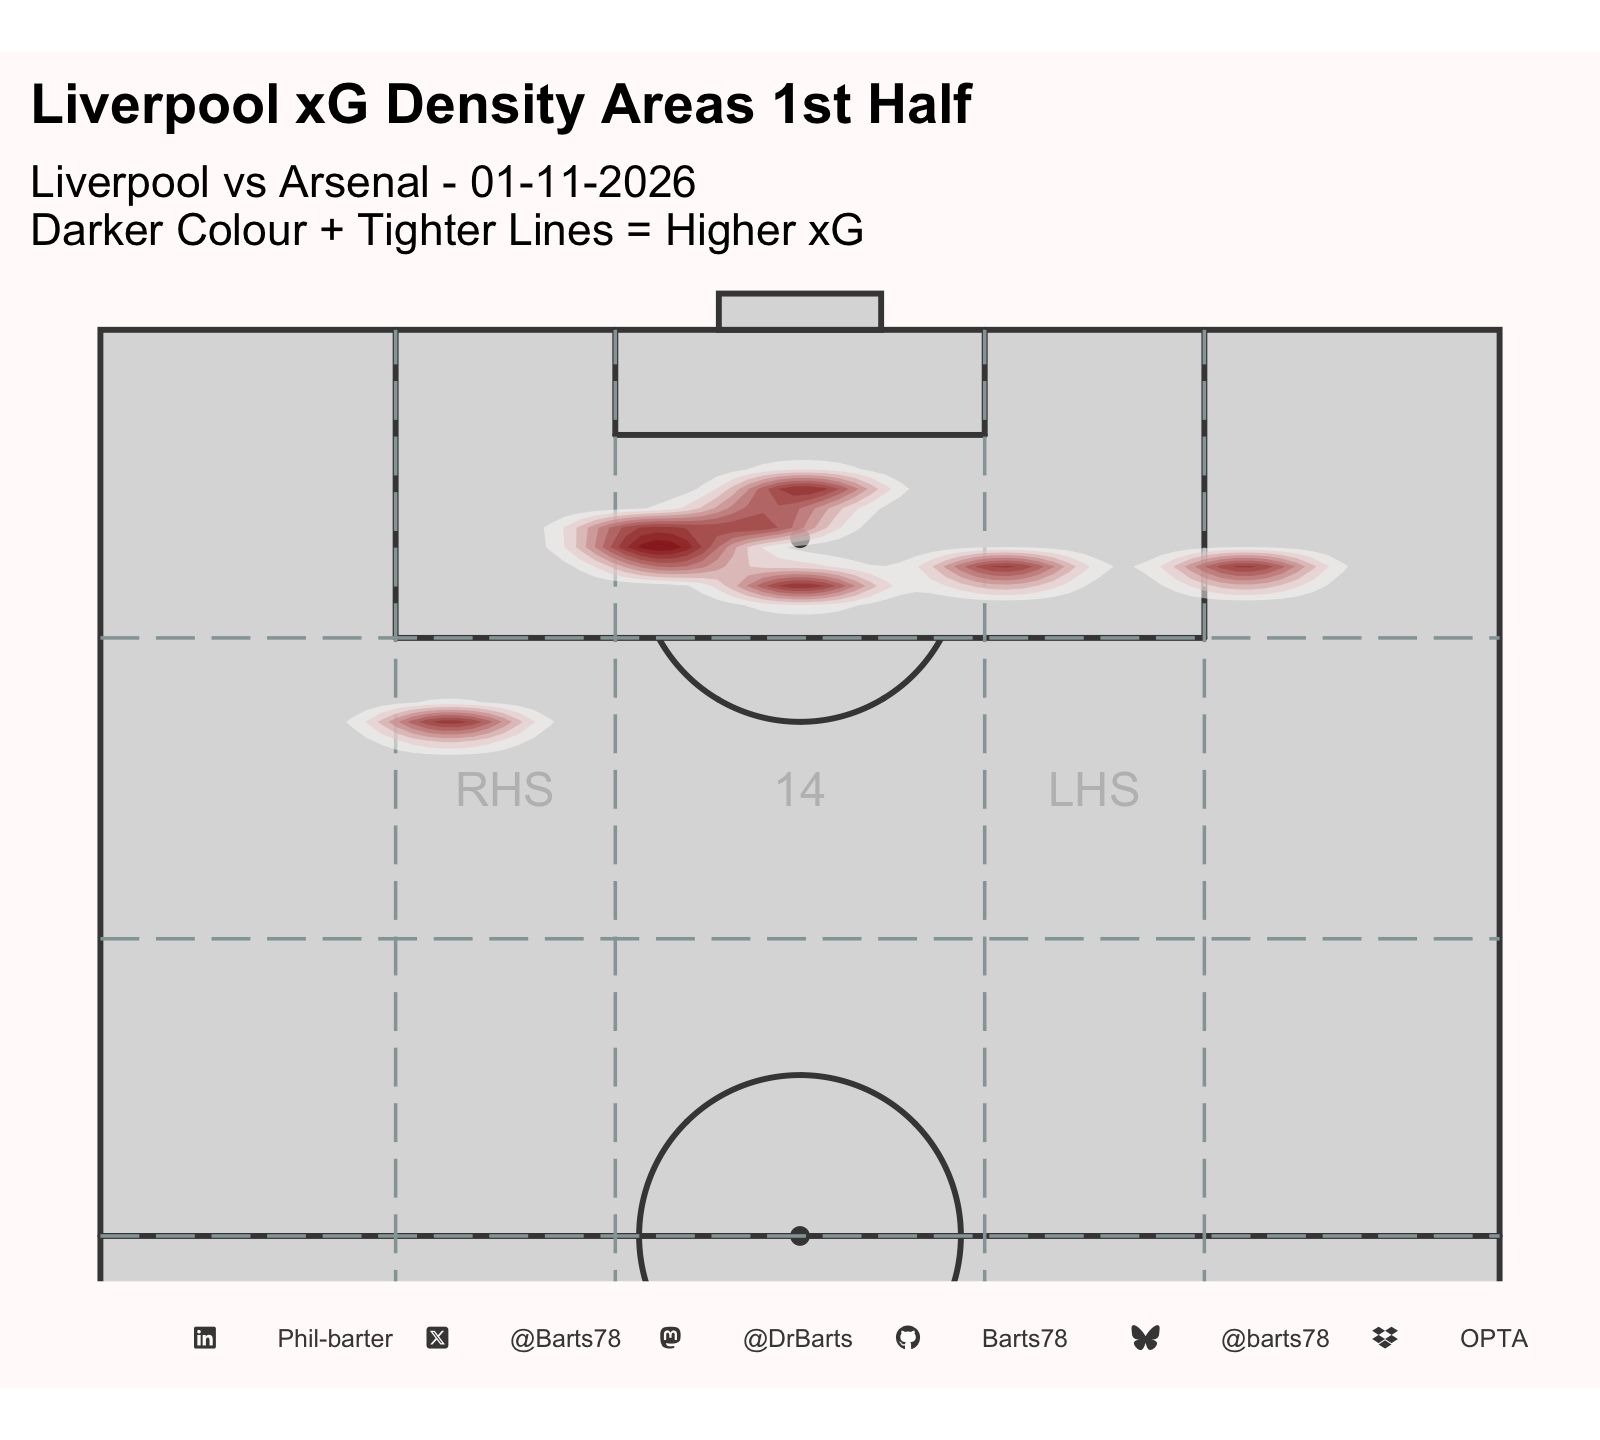
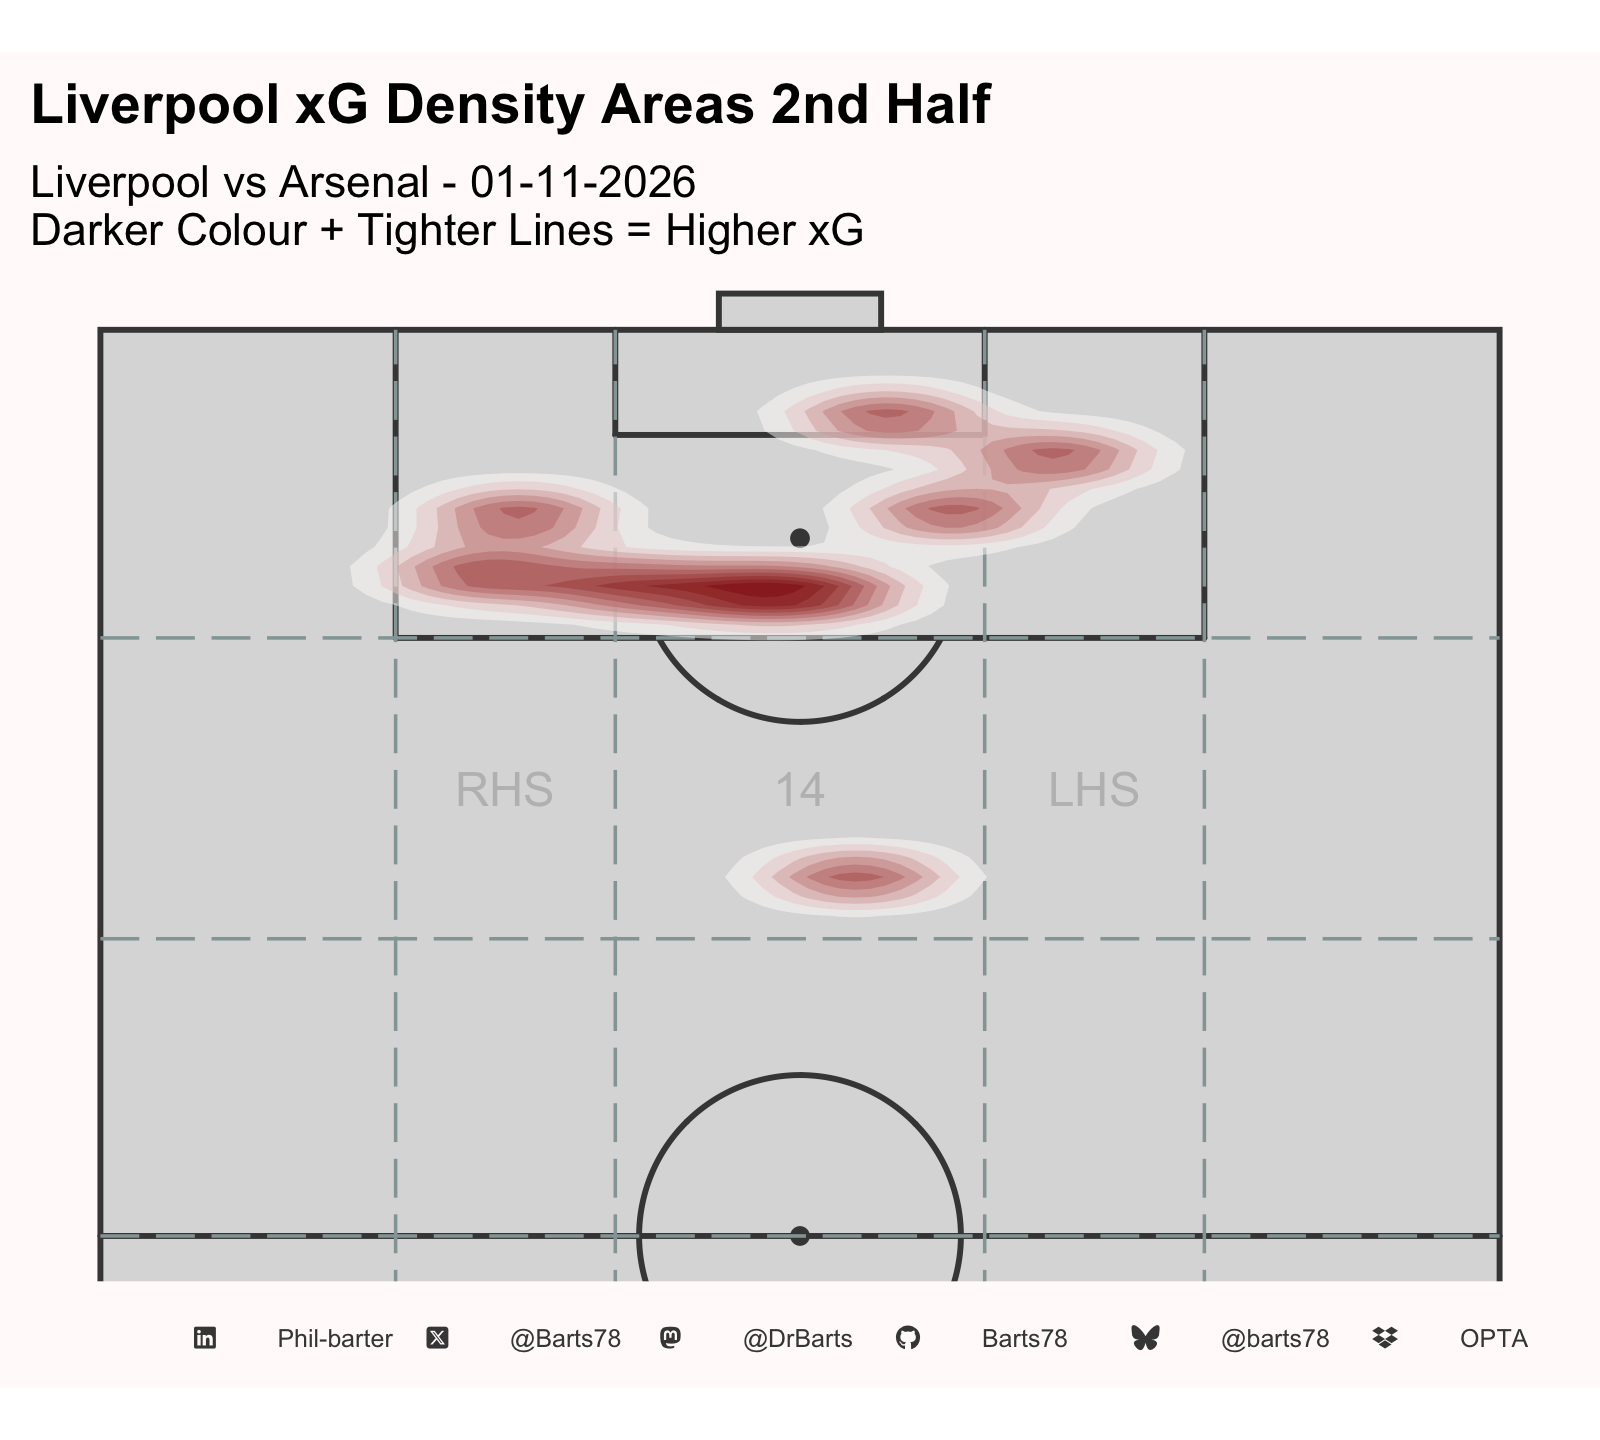
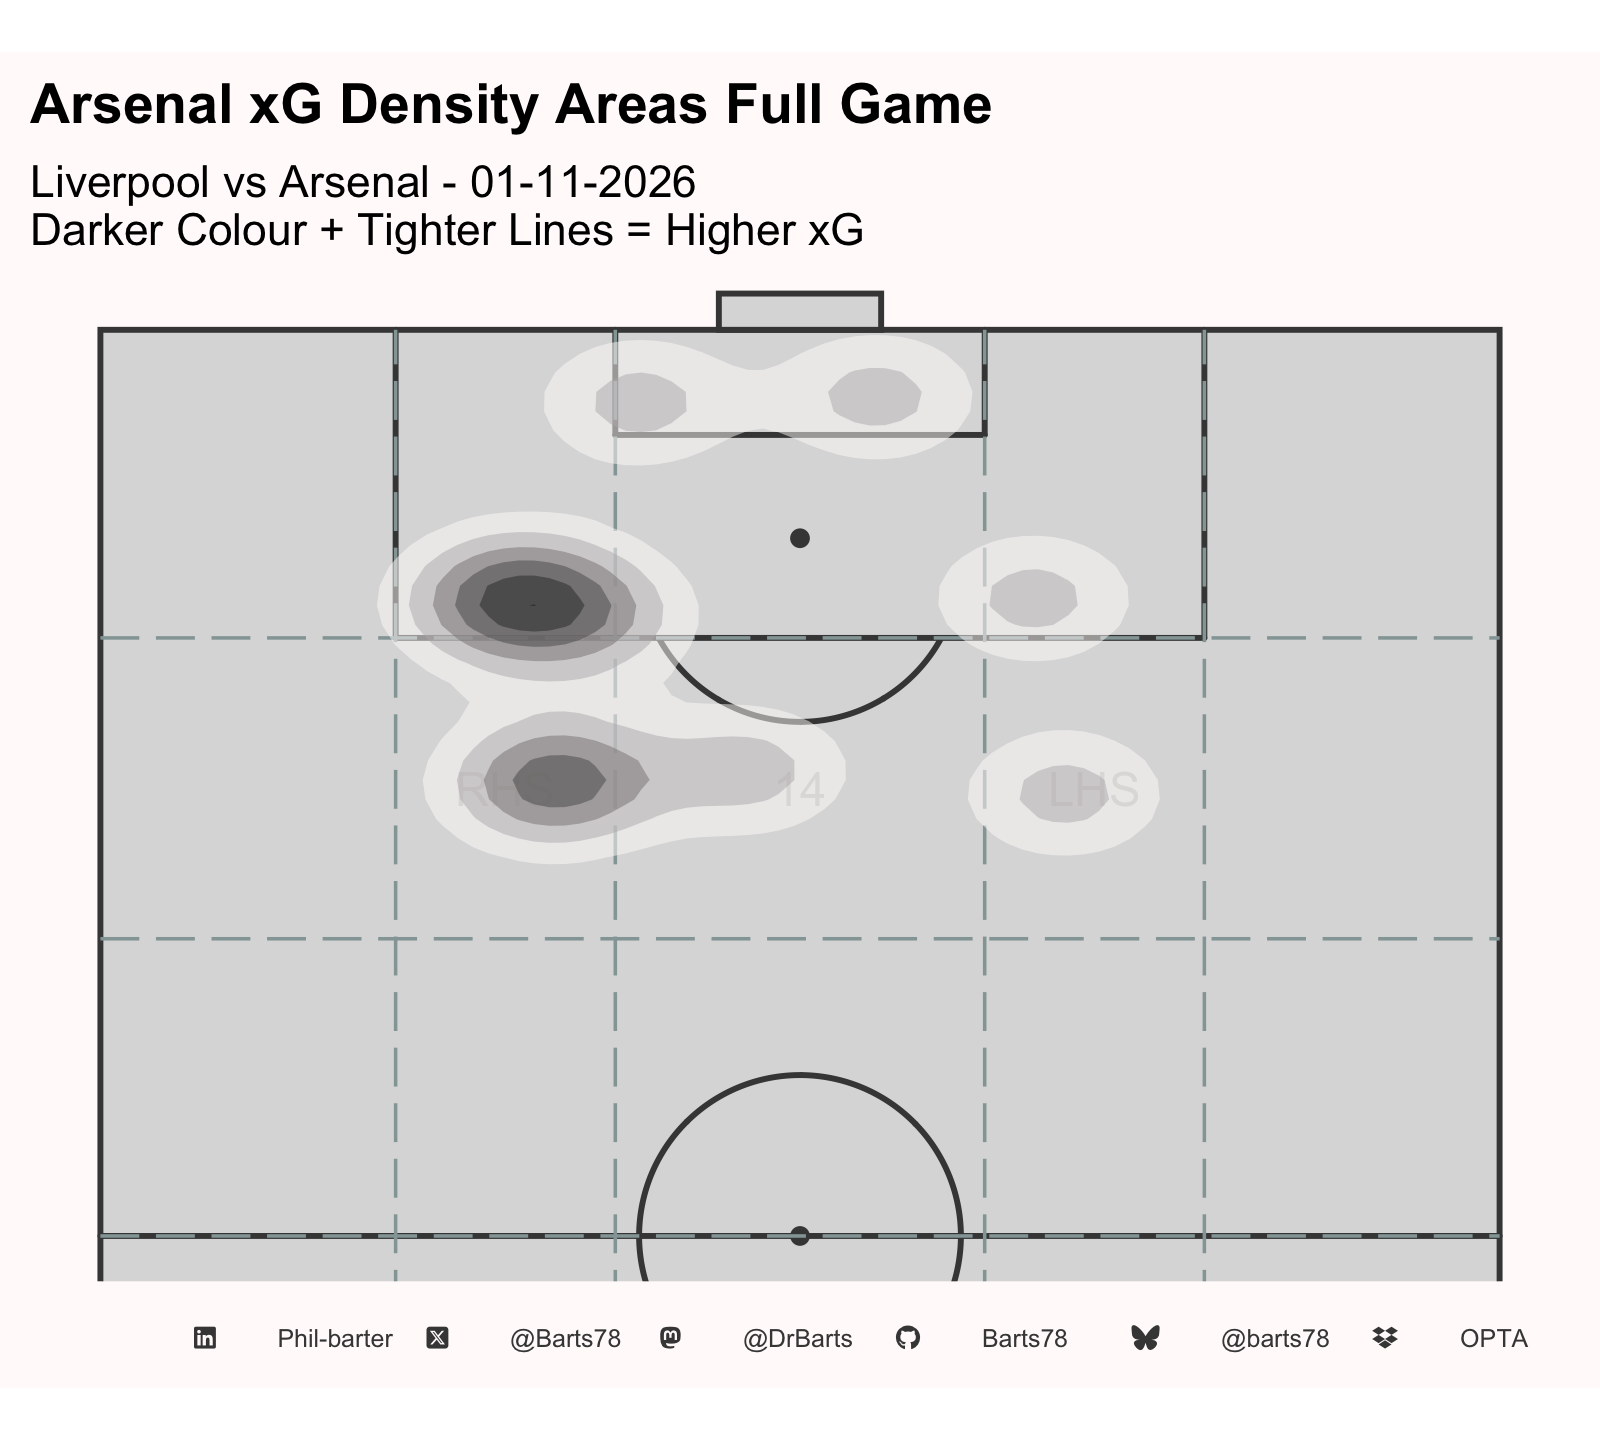
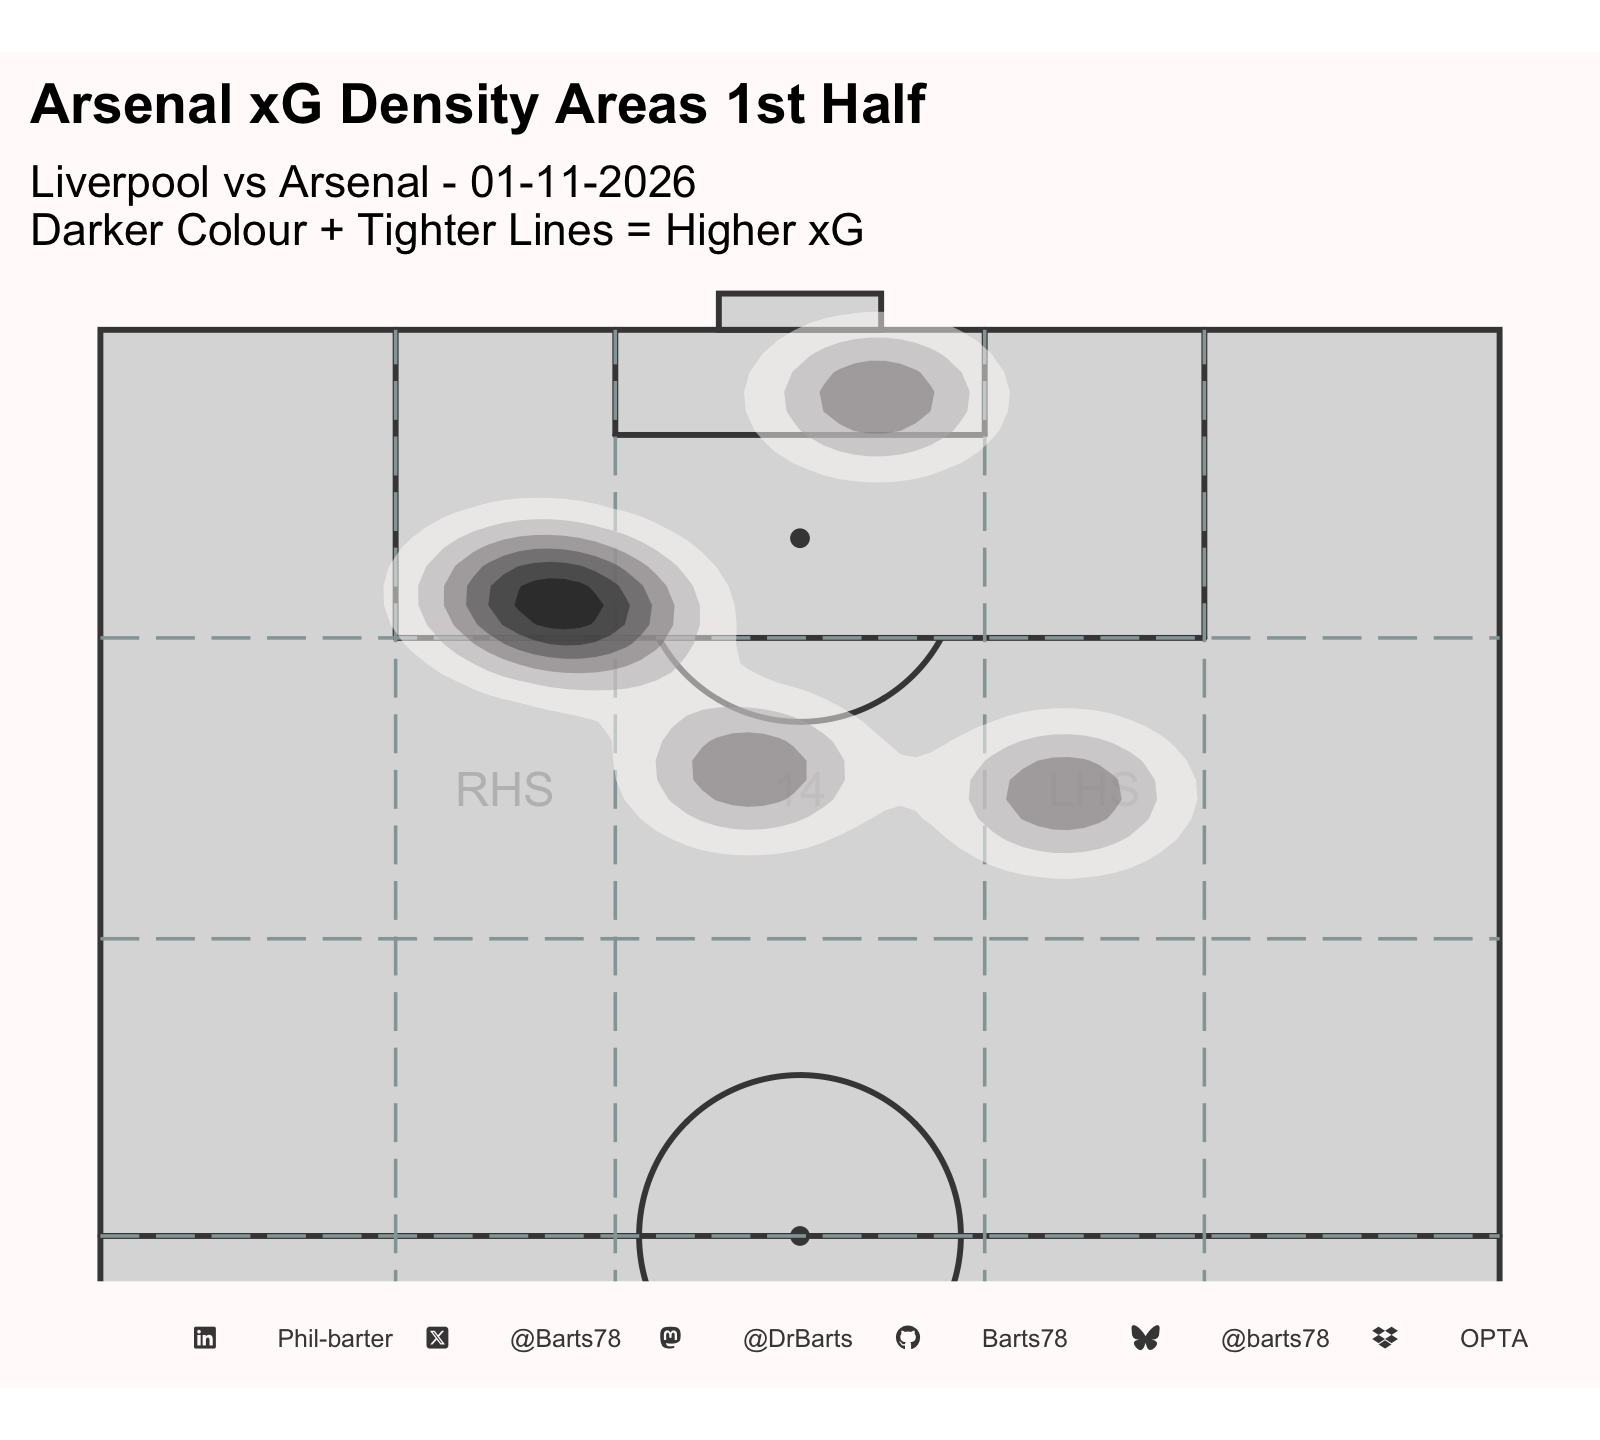
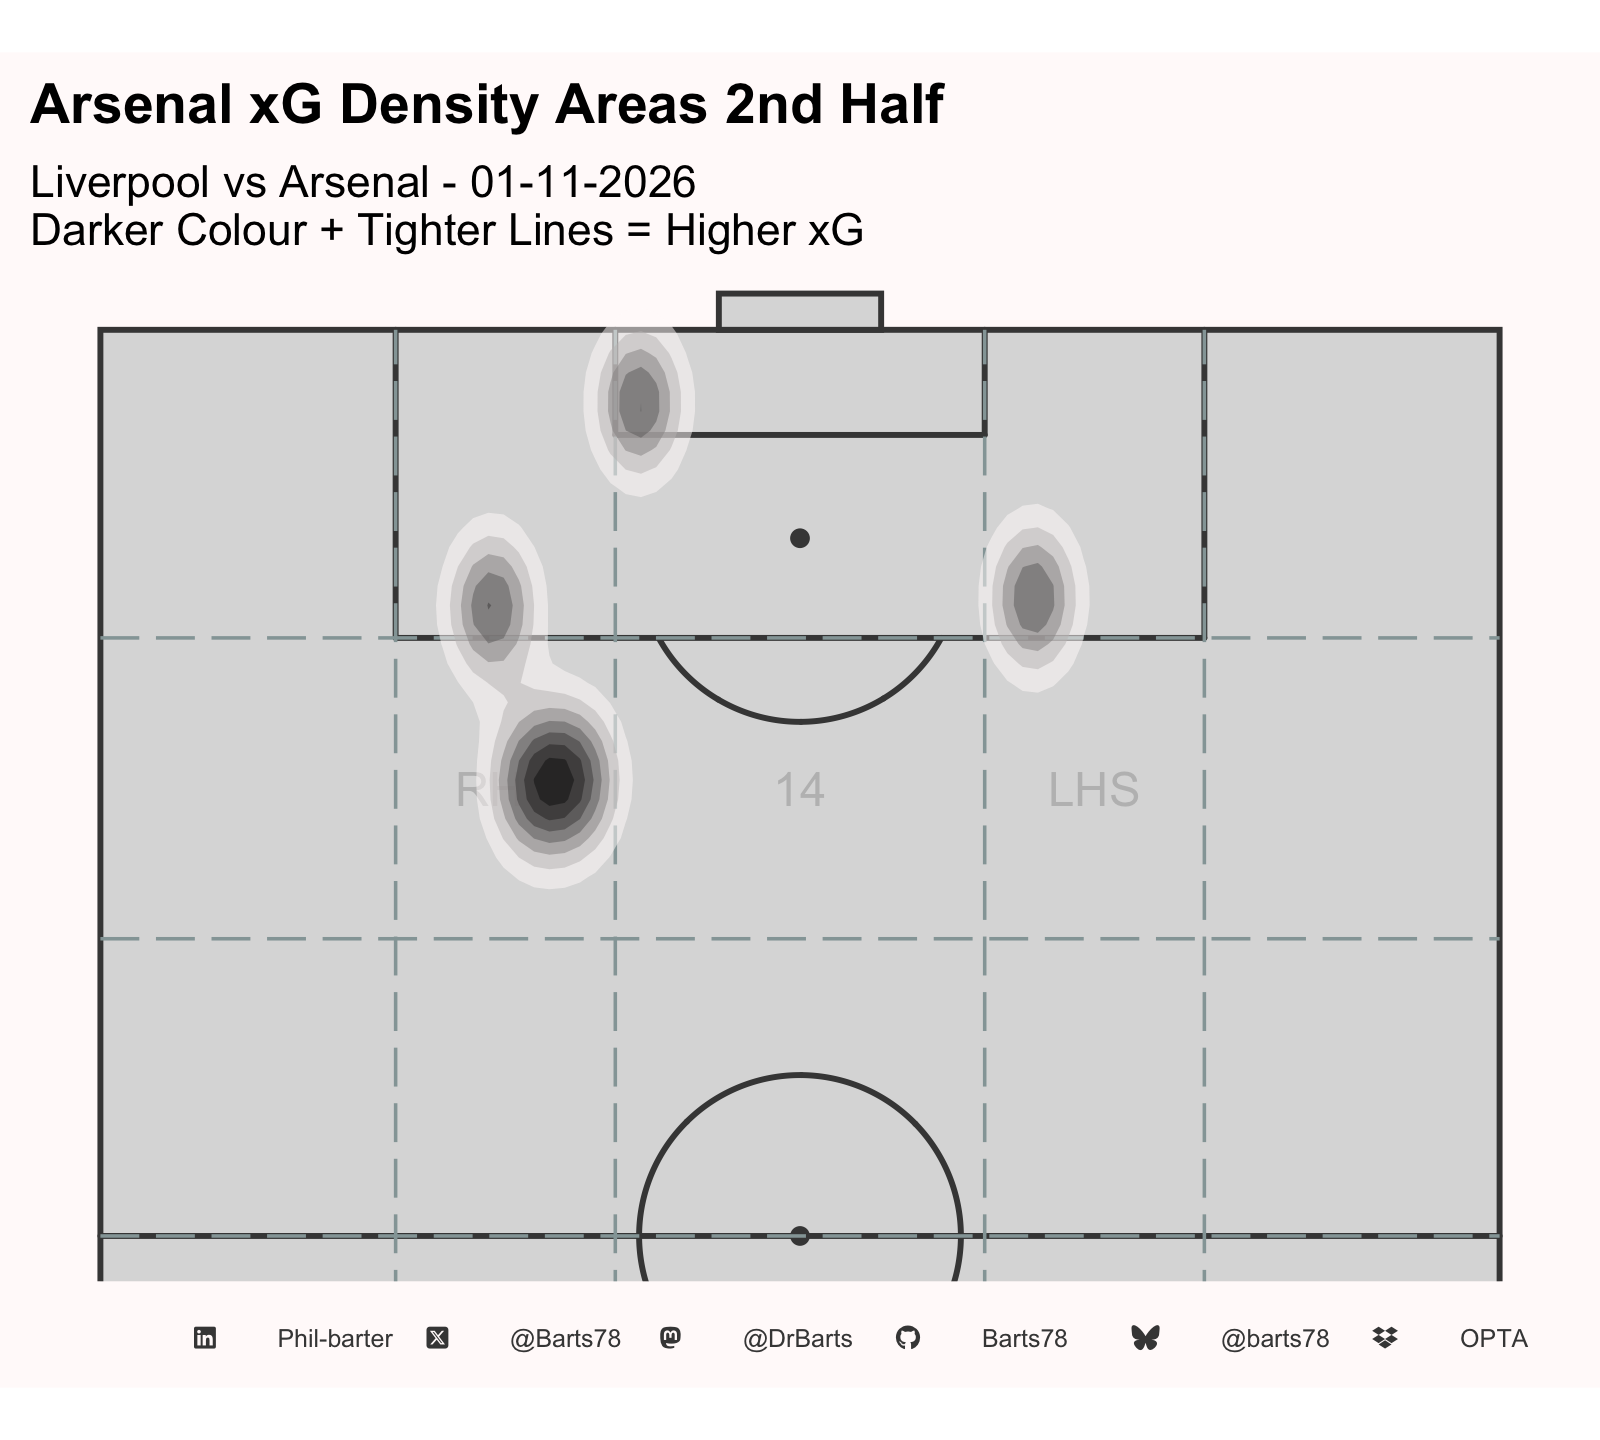
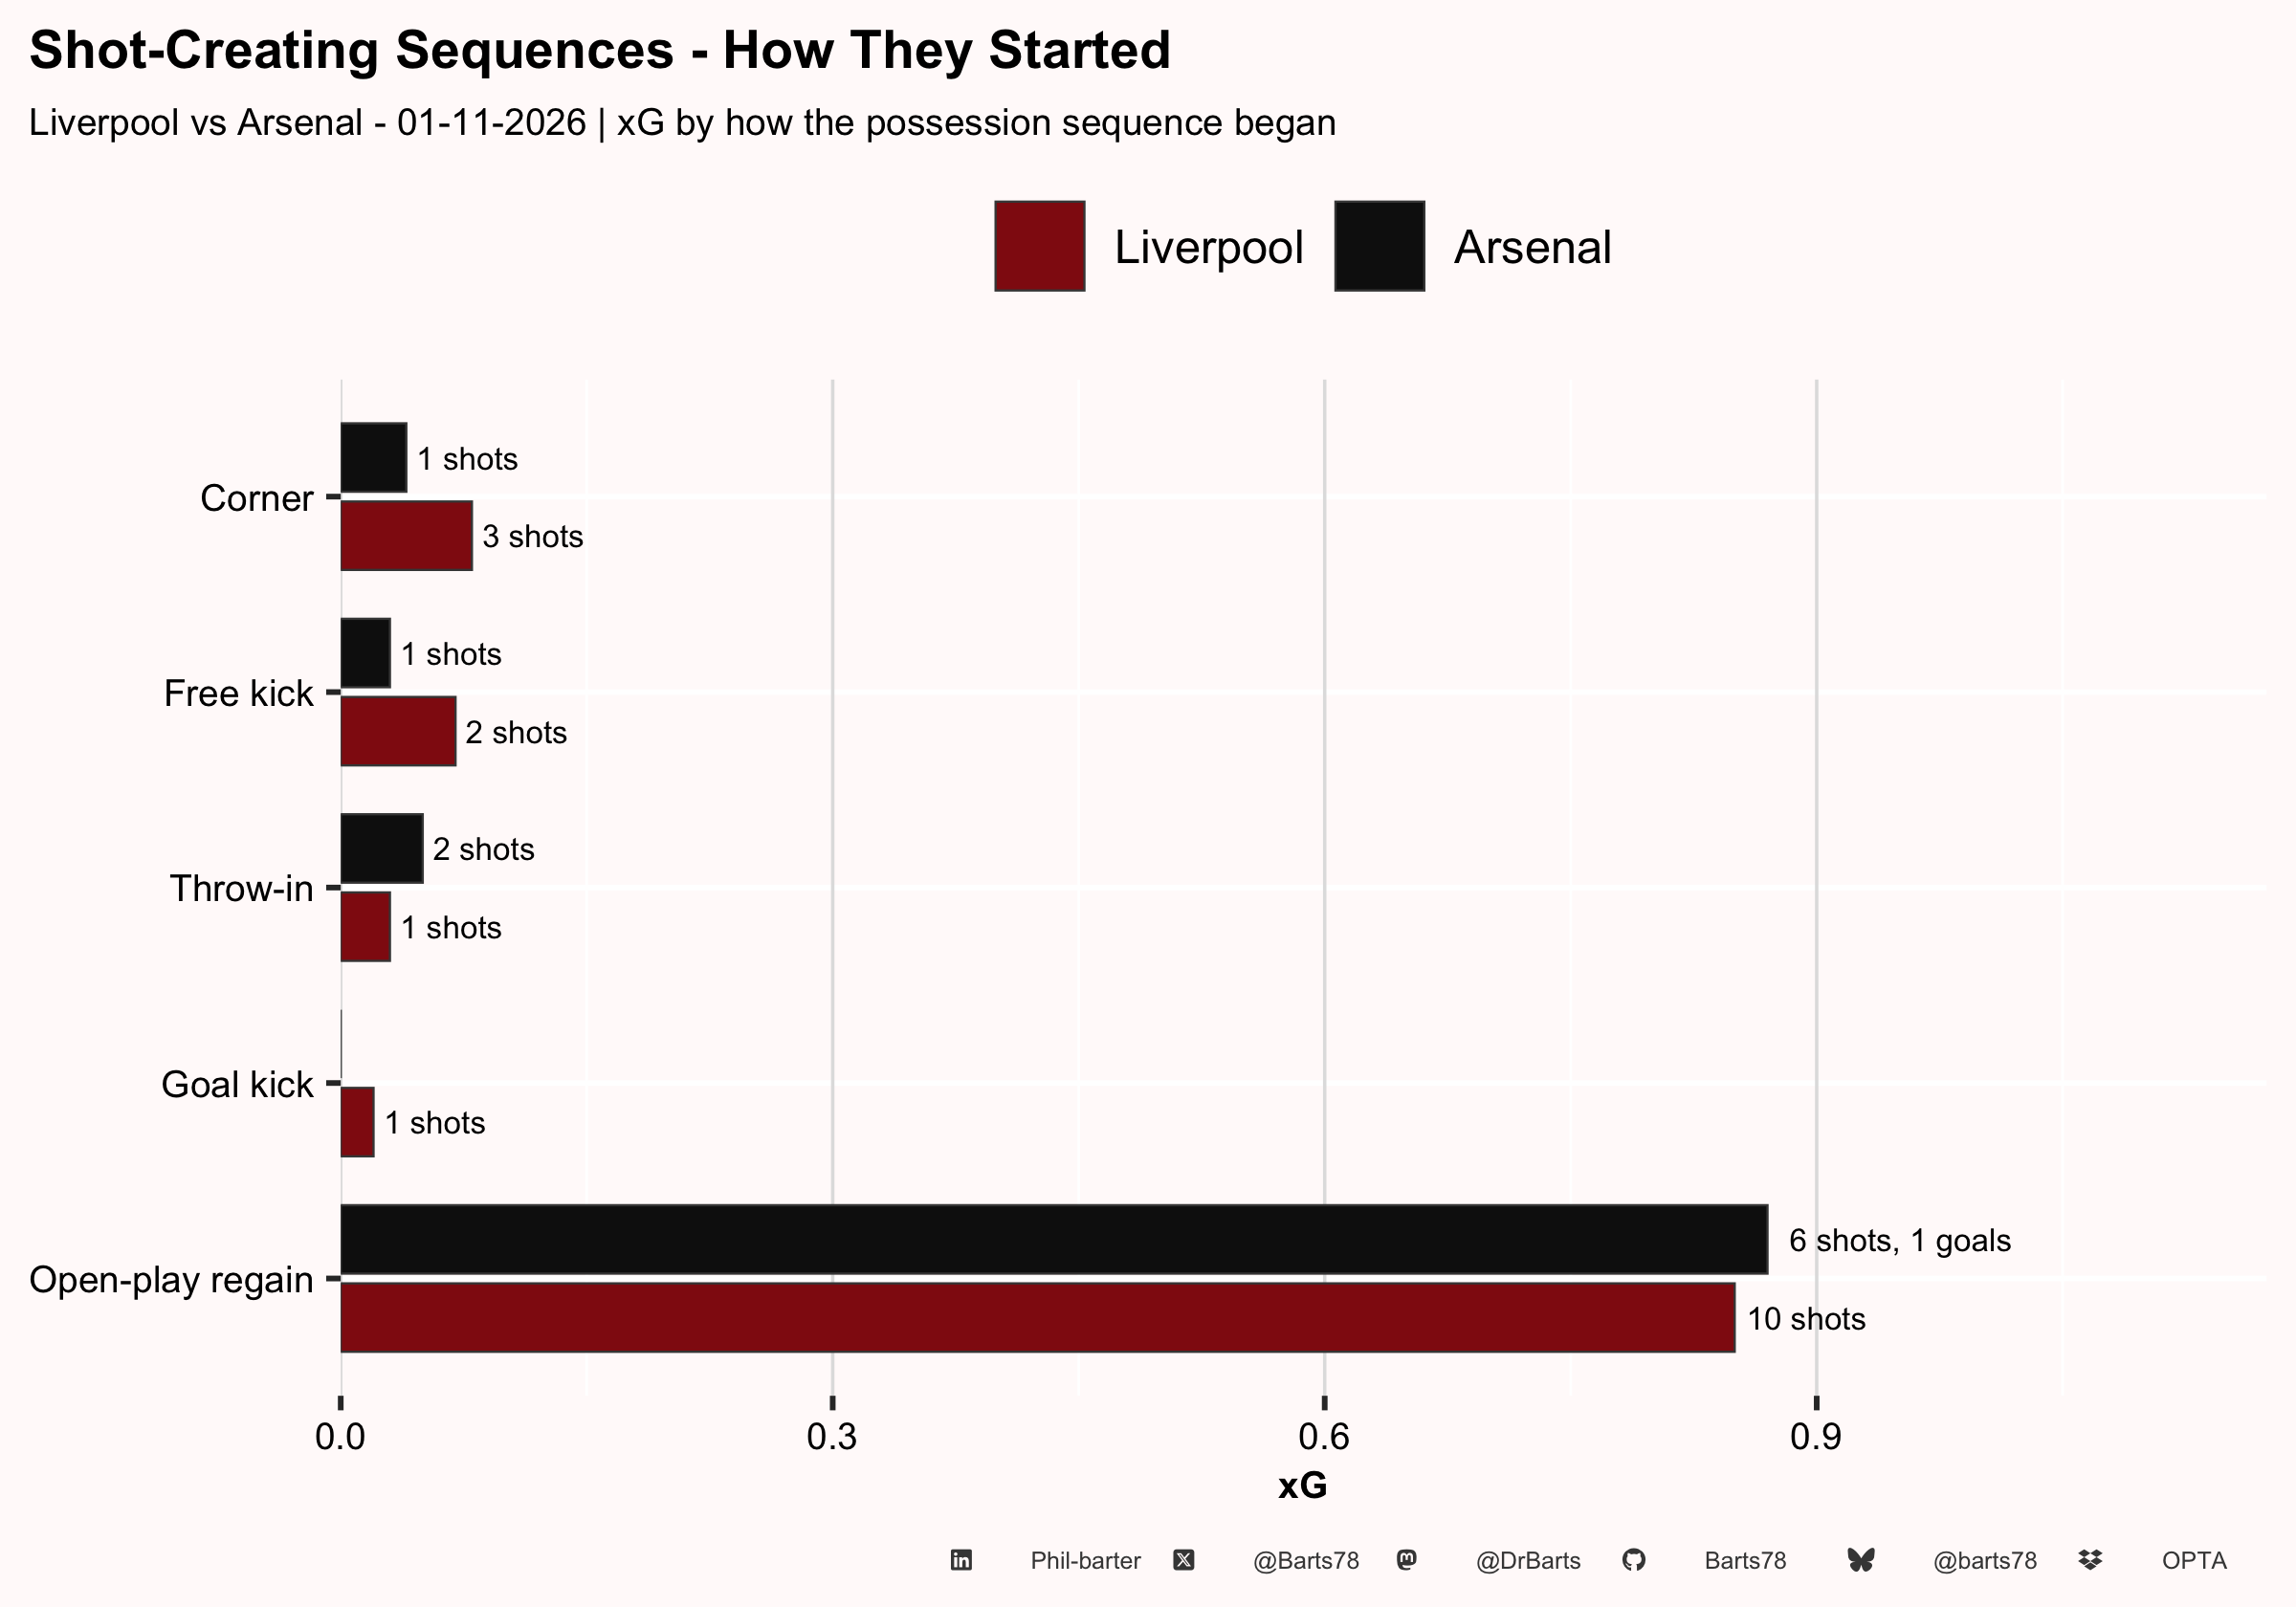
| Shot-Creating Sequences | ||||||||
| Liverpool vs Arsenal - 01-11-2026 | ||||||||
| Shots | Goals | xG | Median passes | Median duration (s) | From regains % | 10+ pass sequences | Under 10s | |
|---|---|---|---|---|---|---|---|---|
| Liverpool | ||||||||
| Liverpool | 17 | 0 | 1.05 | 4 | 15.0 | 59 | 2 | 4 |
| Arsenal | ||||||||
| Arsenal | 10 | 1 | 0.99 | 5 | 17.5 | 60 | 2 | 4 |
| A sequence runs from the moment a team gains the ball (or restarts from a dead ball) until the other team touches it. | ||||||||
| X @Barts78 · Bluesky @barts78 · Mastodon @DrBarts · GitHub Barts78 · LinkedIn Phil-barter · Data: Opta | ||||||||
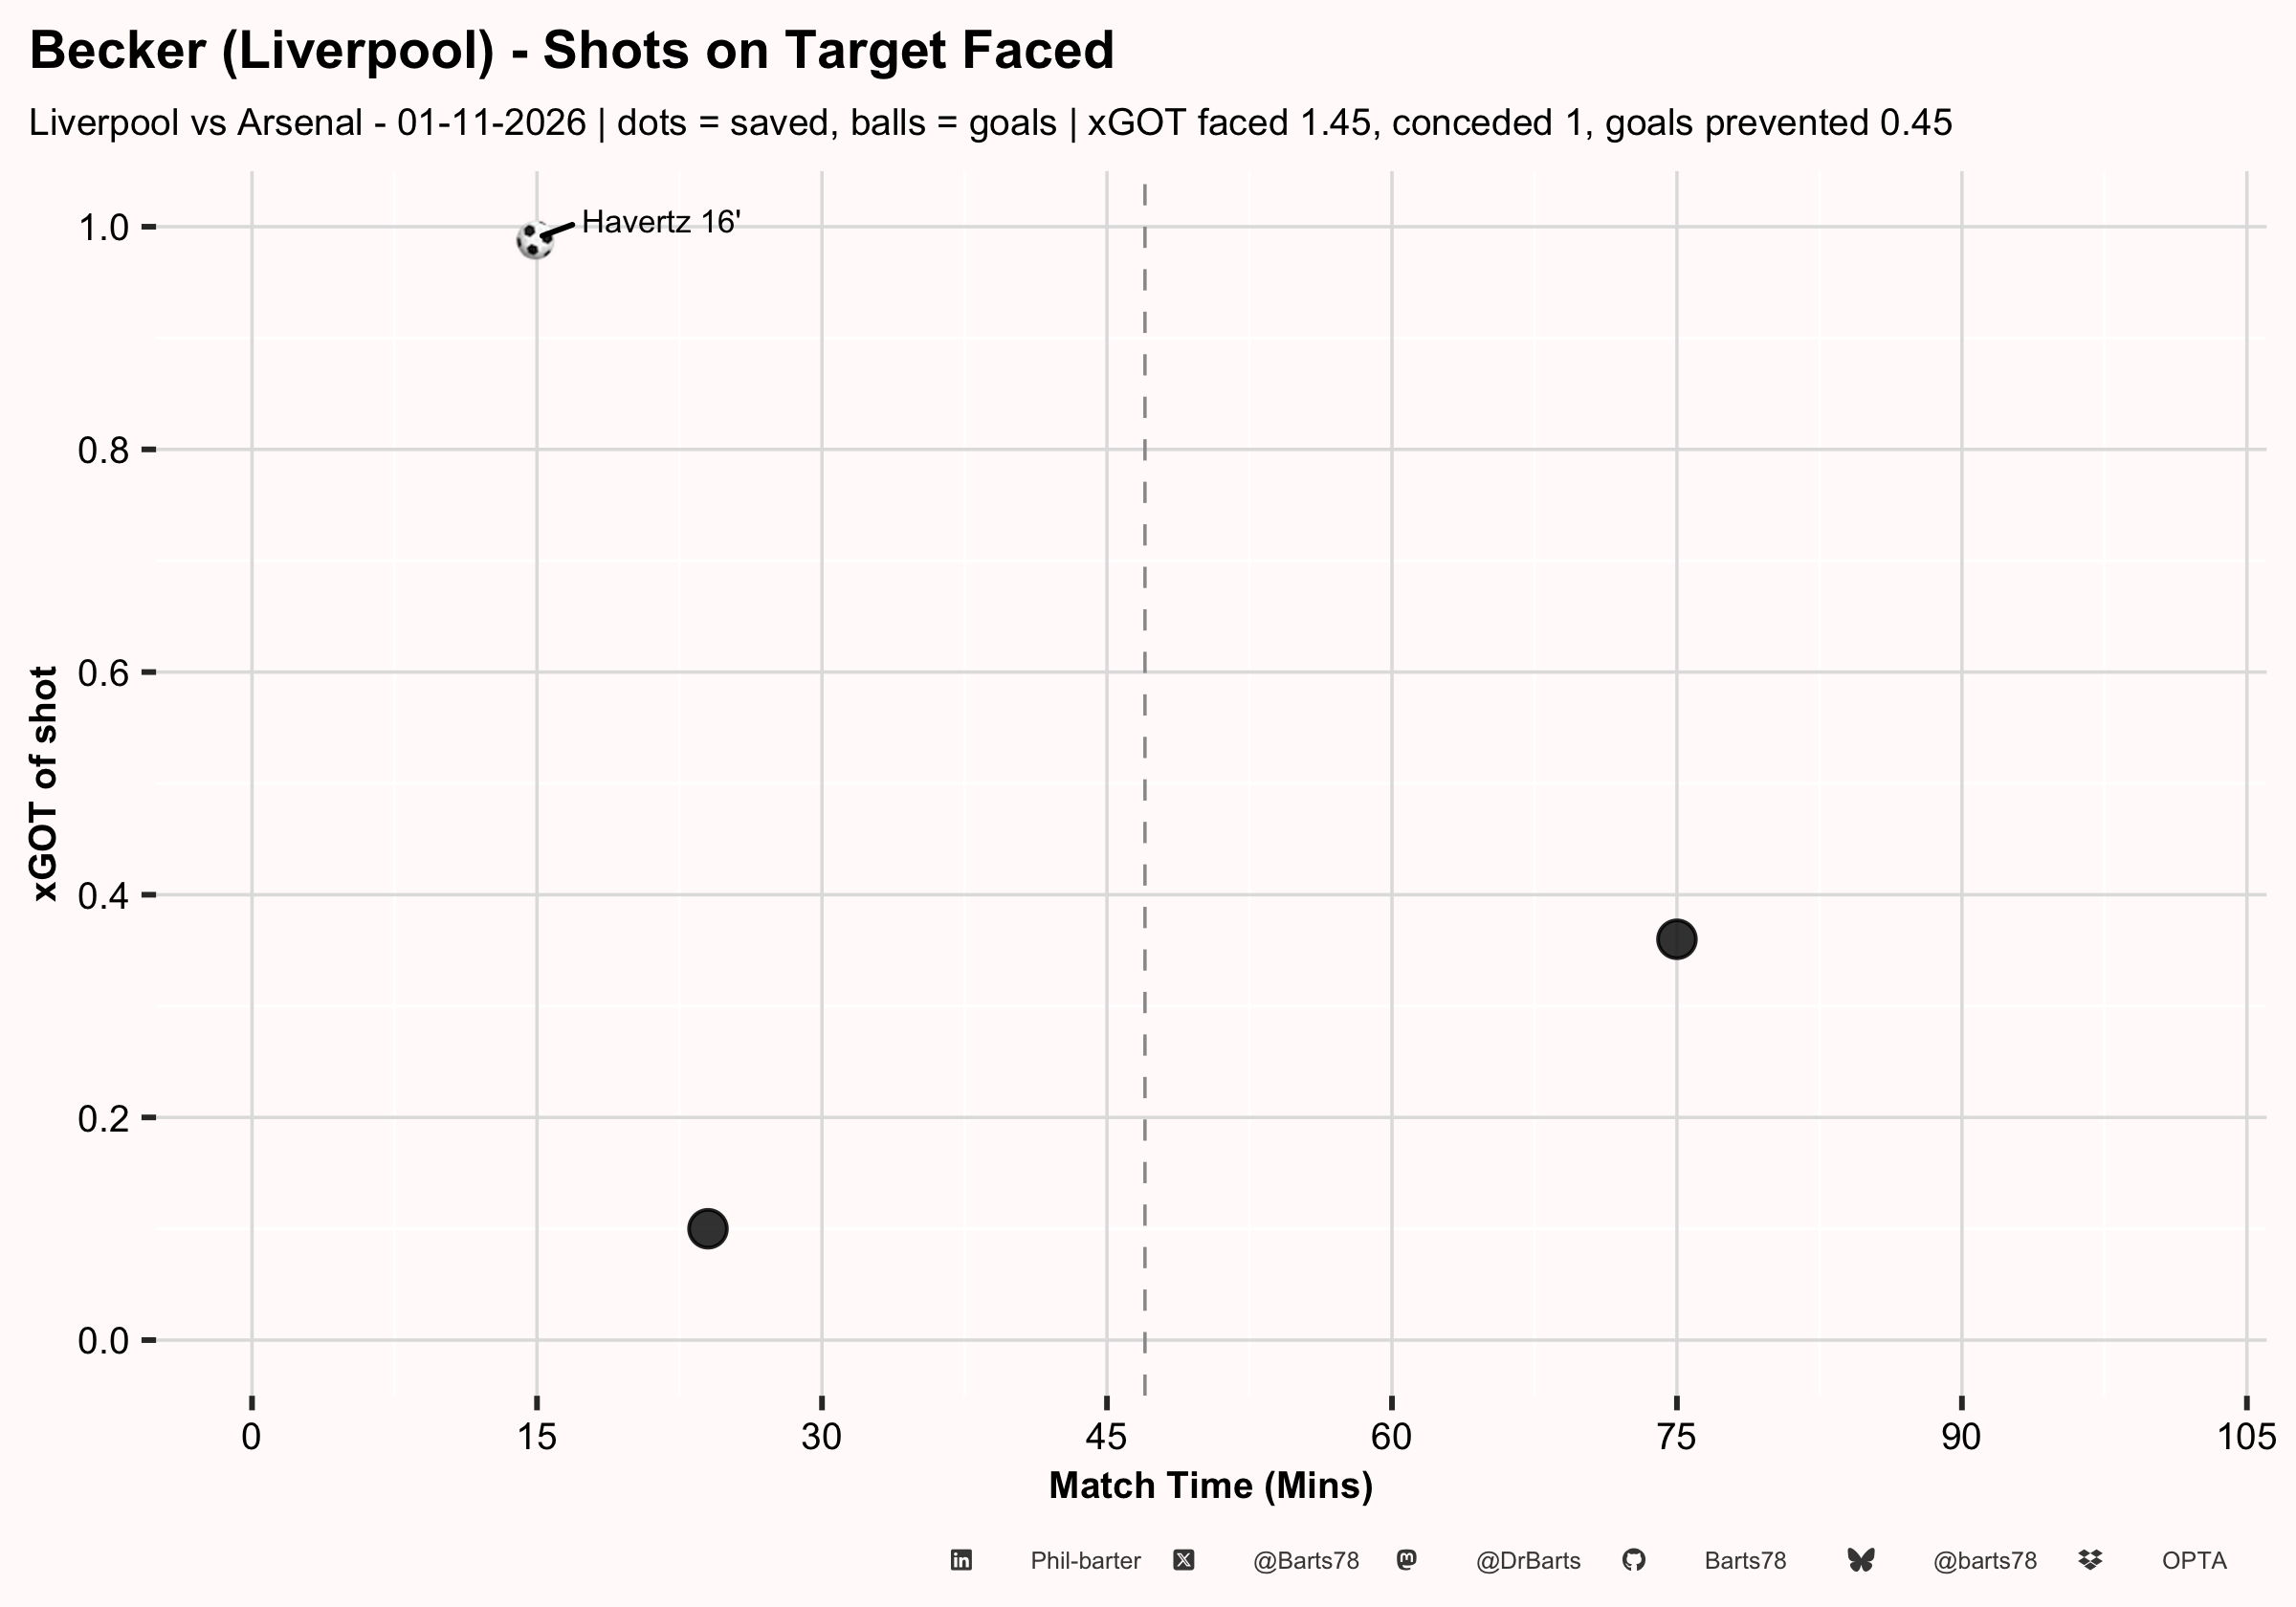
| Liverpool - Goalkeeper | |
| Liverpool vs Arsenal - 01-11-2026 | |
| Liverpool | |
|---|---|
| Keeper | |
| Goalkeeper(s) | Becker |
| Shot stopping | |
| Shots on target faced | 3 |
| xGOT faced | 1.45 |
| Goals conceded (excl. OG) | 1 |
| Goals prevented (xGOT - GA) | 0.45 |
| Saves | 2 |
| Save % | 67% |
| Area & sweeping | |
| Claims | 0 |
| Punches | 0 |
| Sweeper actions | 2 |
| Distribution | |
| Passes | 27 |
| Pass success % | 74% |
| Short passes | 16 |
| Short success % | 100% |
| Long passes | 11 |
| Long success % | 36% |
| Goals prevented = xGOT faced minus goals conceded (own goals excluded); positive = kept out more than an average keeper would. Long pass = Opta long ball or 32m+. Sweeper actions = keeper-sweeper events plus claims, punches and defensive actions outside the box. | |
| X @Barts78 · Bluesky @barts78 · Mastodon @DrBarts · GitHub Barts78 · LinkedIn Phil-barter · Data: Opta | |
| Arsenal - Goalkeeper | |
| Liverpool vs Arsenal - 01-11-2026 | |
| Arsenal | |
|---|---|
| Keeper | |
| Goalkeeper(s) | Raya |
| Shot stopping | |
| Shots on target faced | 0 |
| xGOT faced | 0.00 |
| Goals conceded (excl. OG) | 0 |
| Goals prevented (xGOT - GA) | 0.00 |
| Saves | 0 |
| Save % | - |
| Area & sweeping | |
| Claims | 1 |
| Punches | 1 |
| Sweeper actions | 4 |
| Distribution | |
| Passes | 57 |
| Pass success % | 56% |
| Short passes | 16 |
| Short success % | 100% |
| Long passes | 41 |
| Long success % | 39% |
| Goals prevented = xGOT faced minus goals conceded (own goals excluded); positive = kept out more than an average keeper would. Long pass = Opta long ball or 32m+. Sweeper actions = keeper-sweeper events plus claims, punches and defensive actions outside the box. | |
| X @Barts78 · Bluesky @barts78 · Mastodon @DrBarts · GitHub Barts78 · LinkedIn Phil-barter · Data: Opta | |
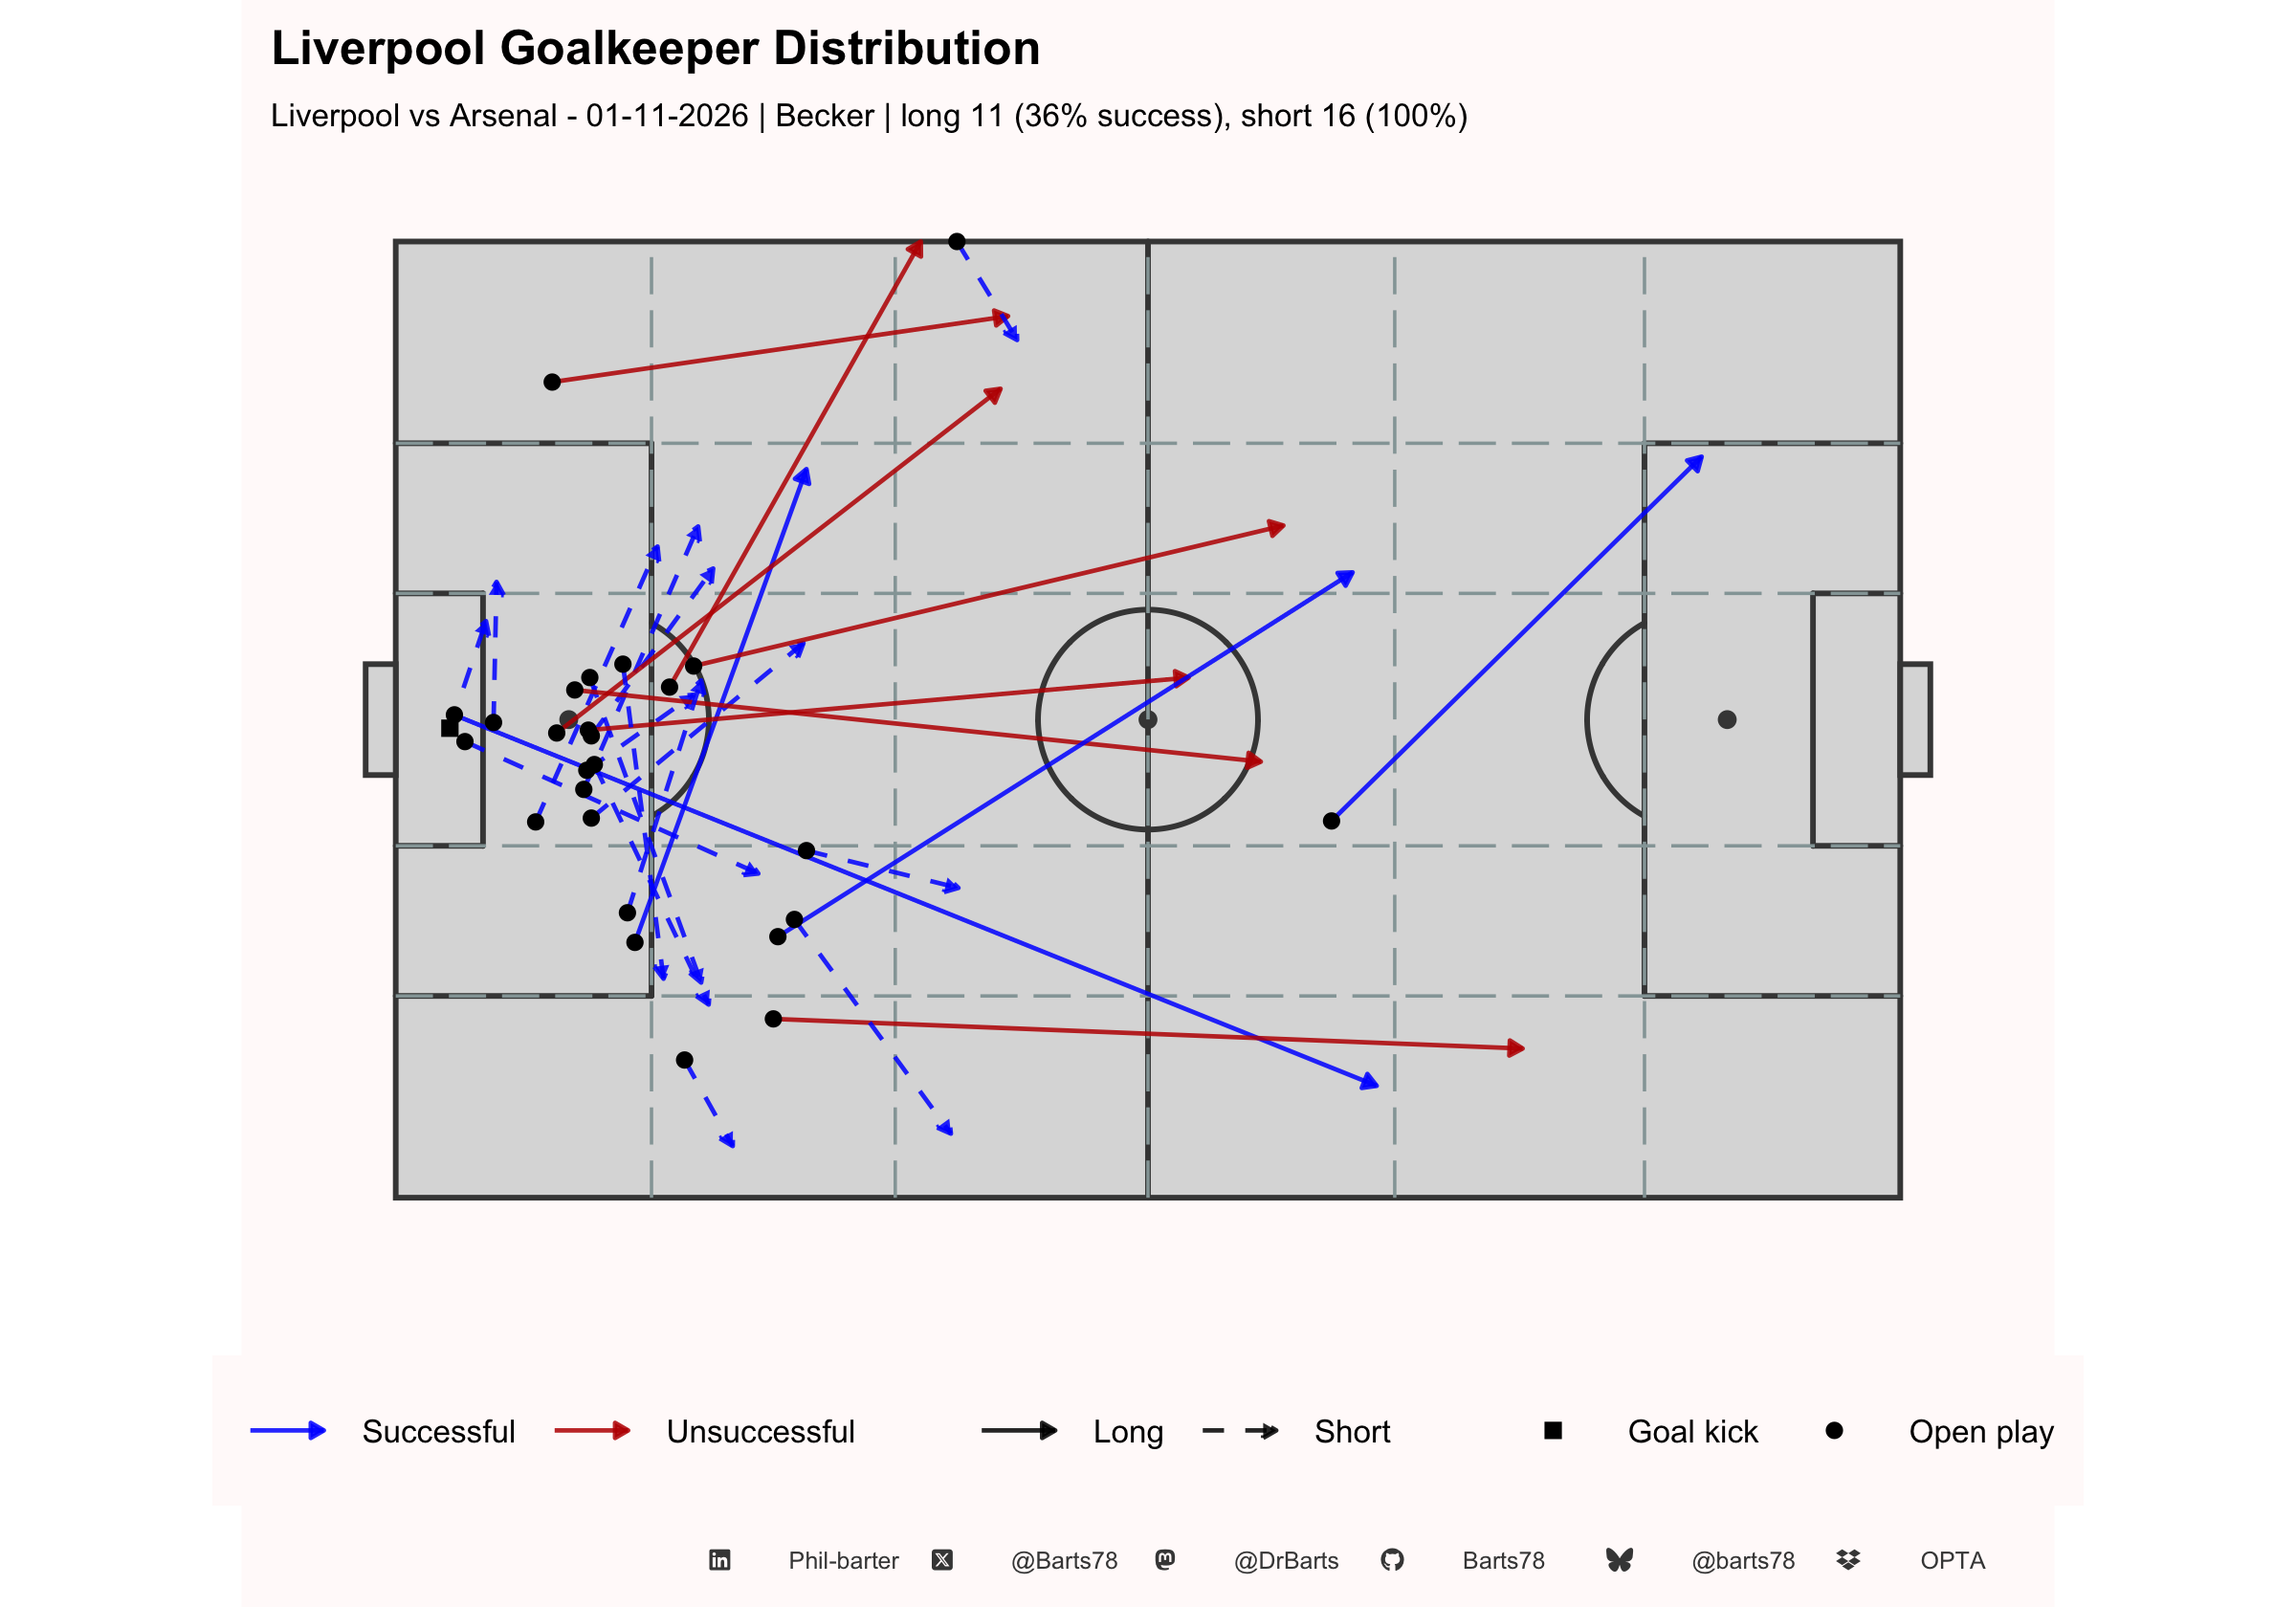
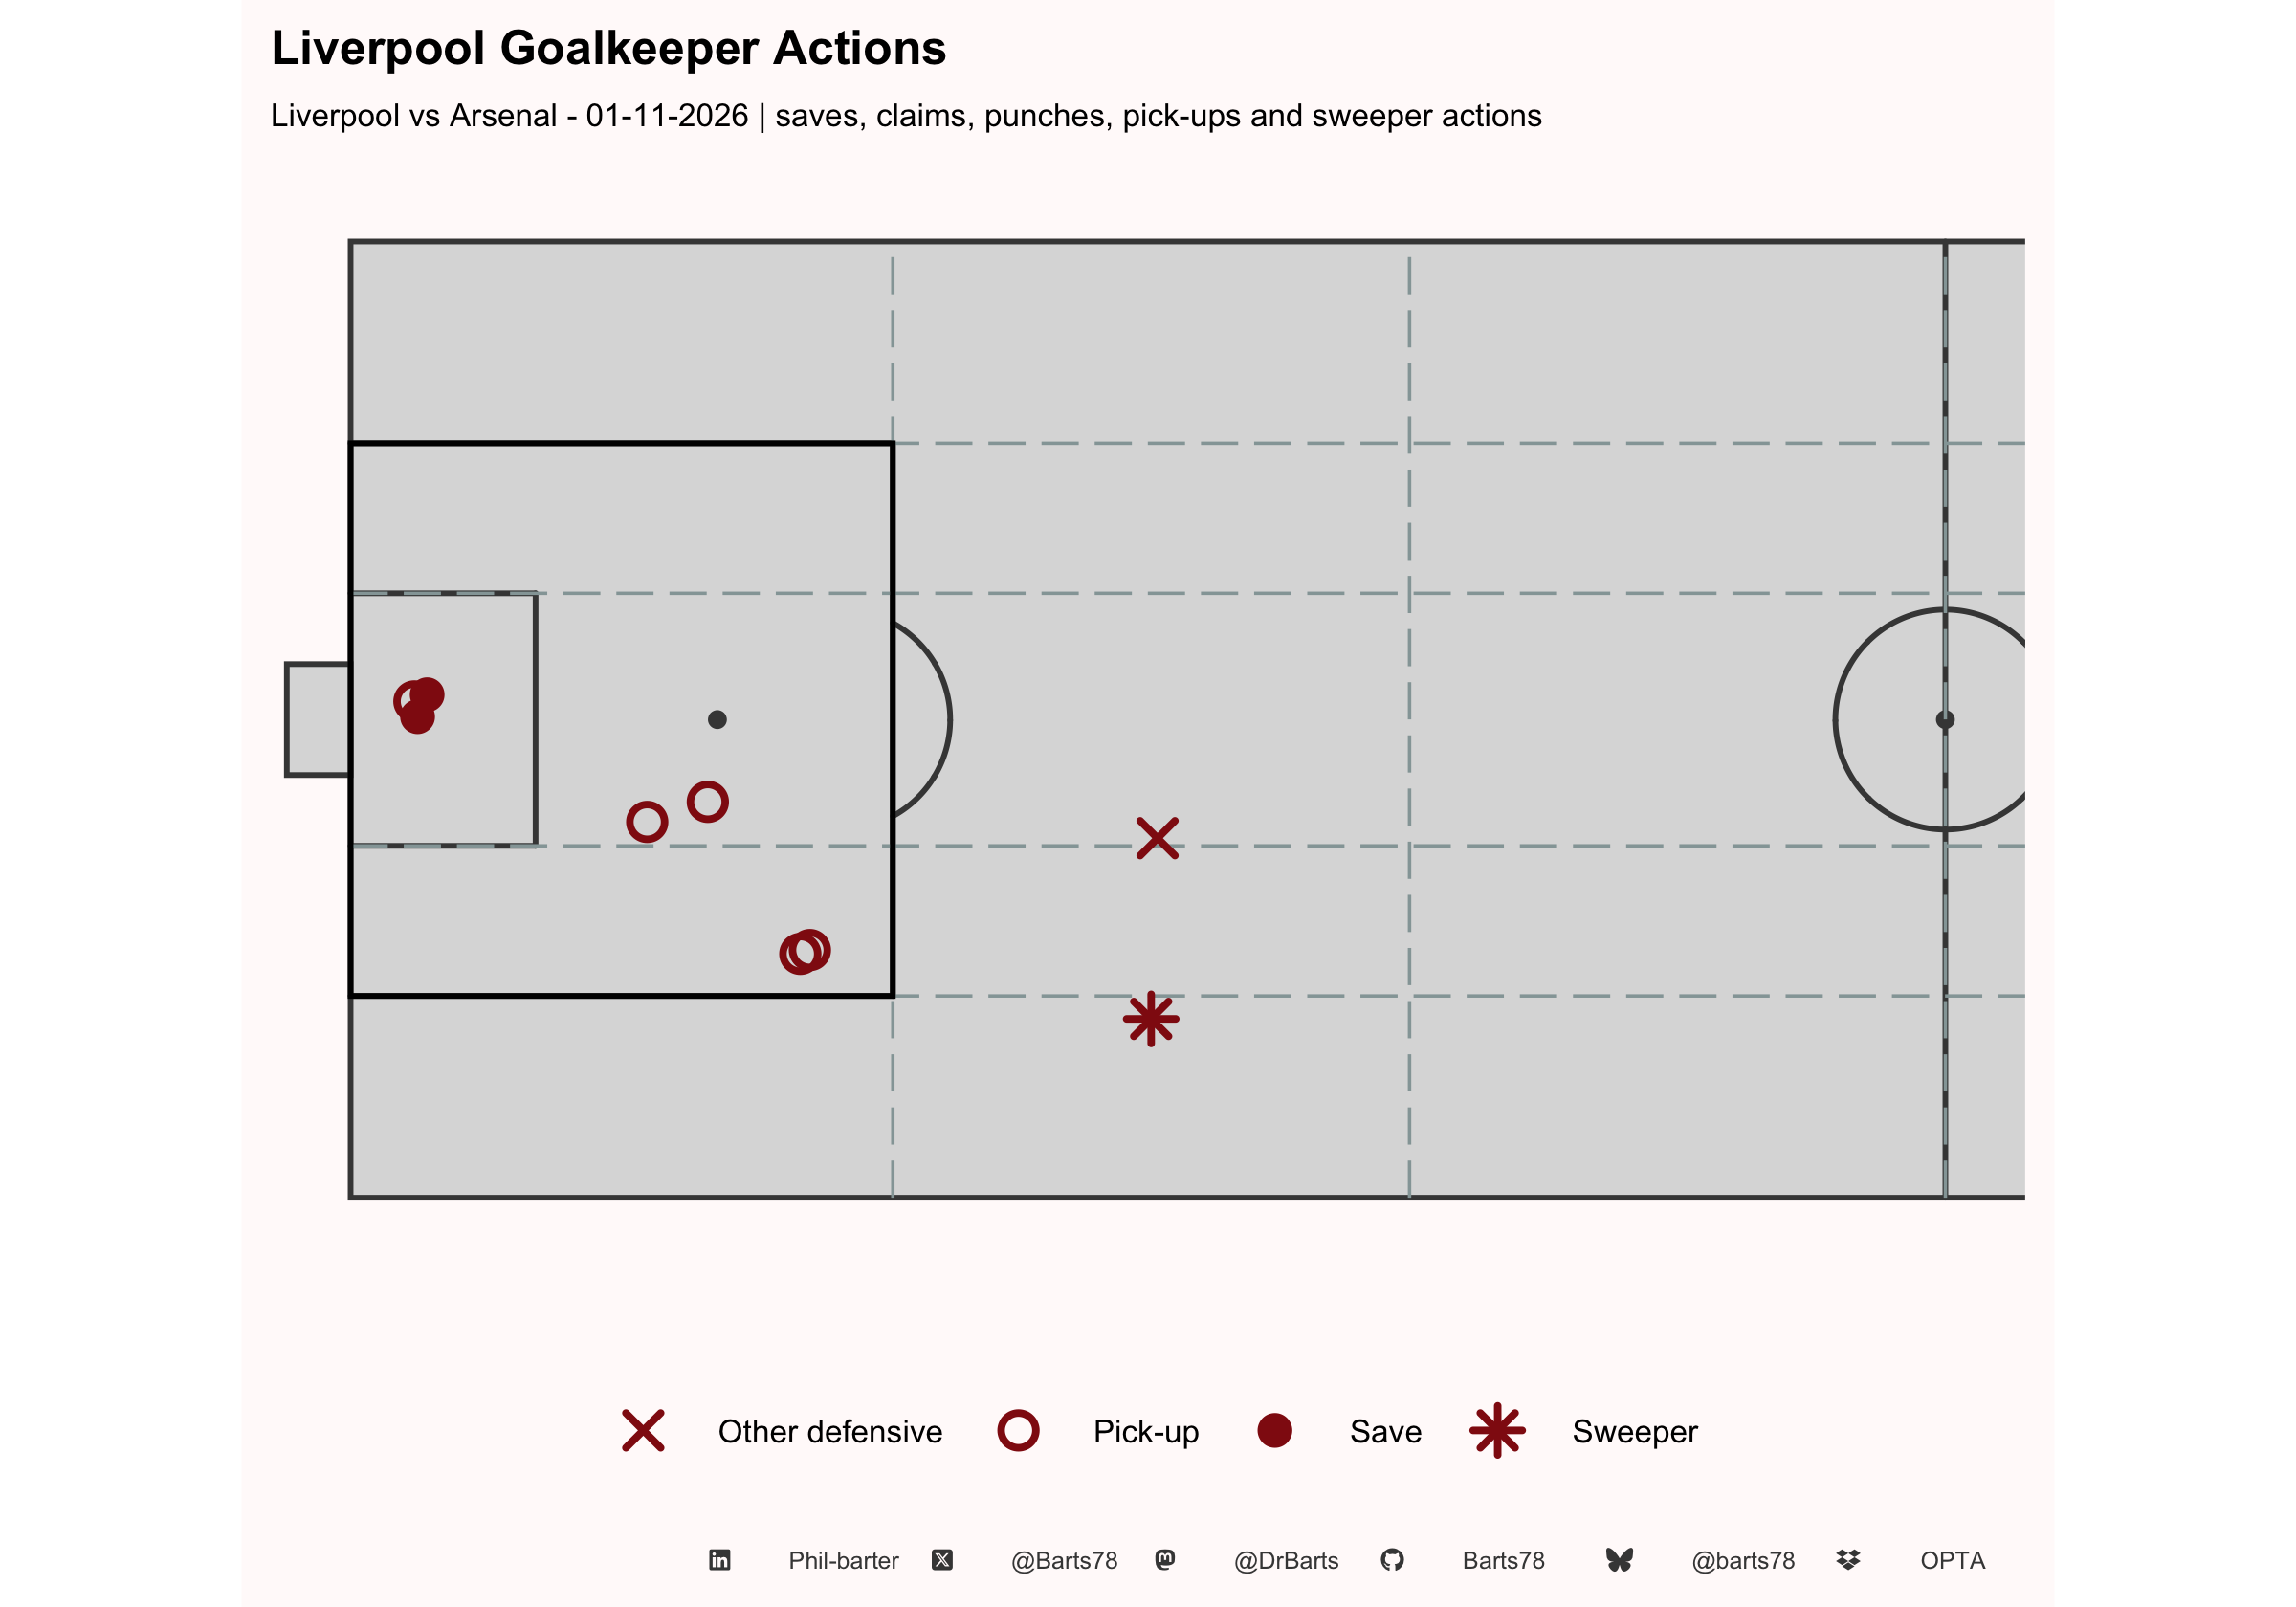
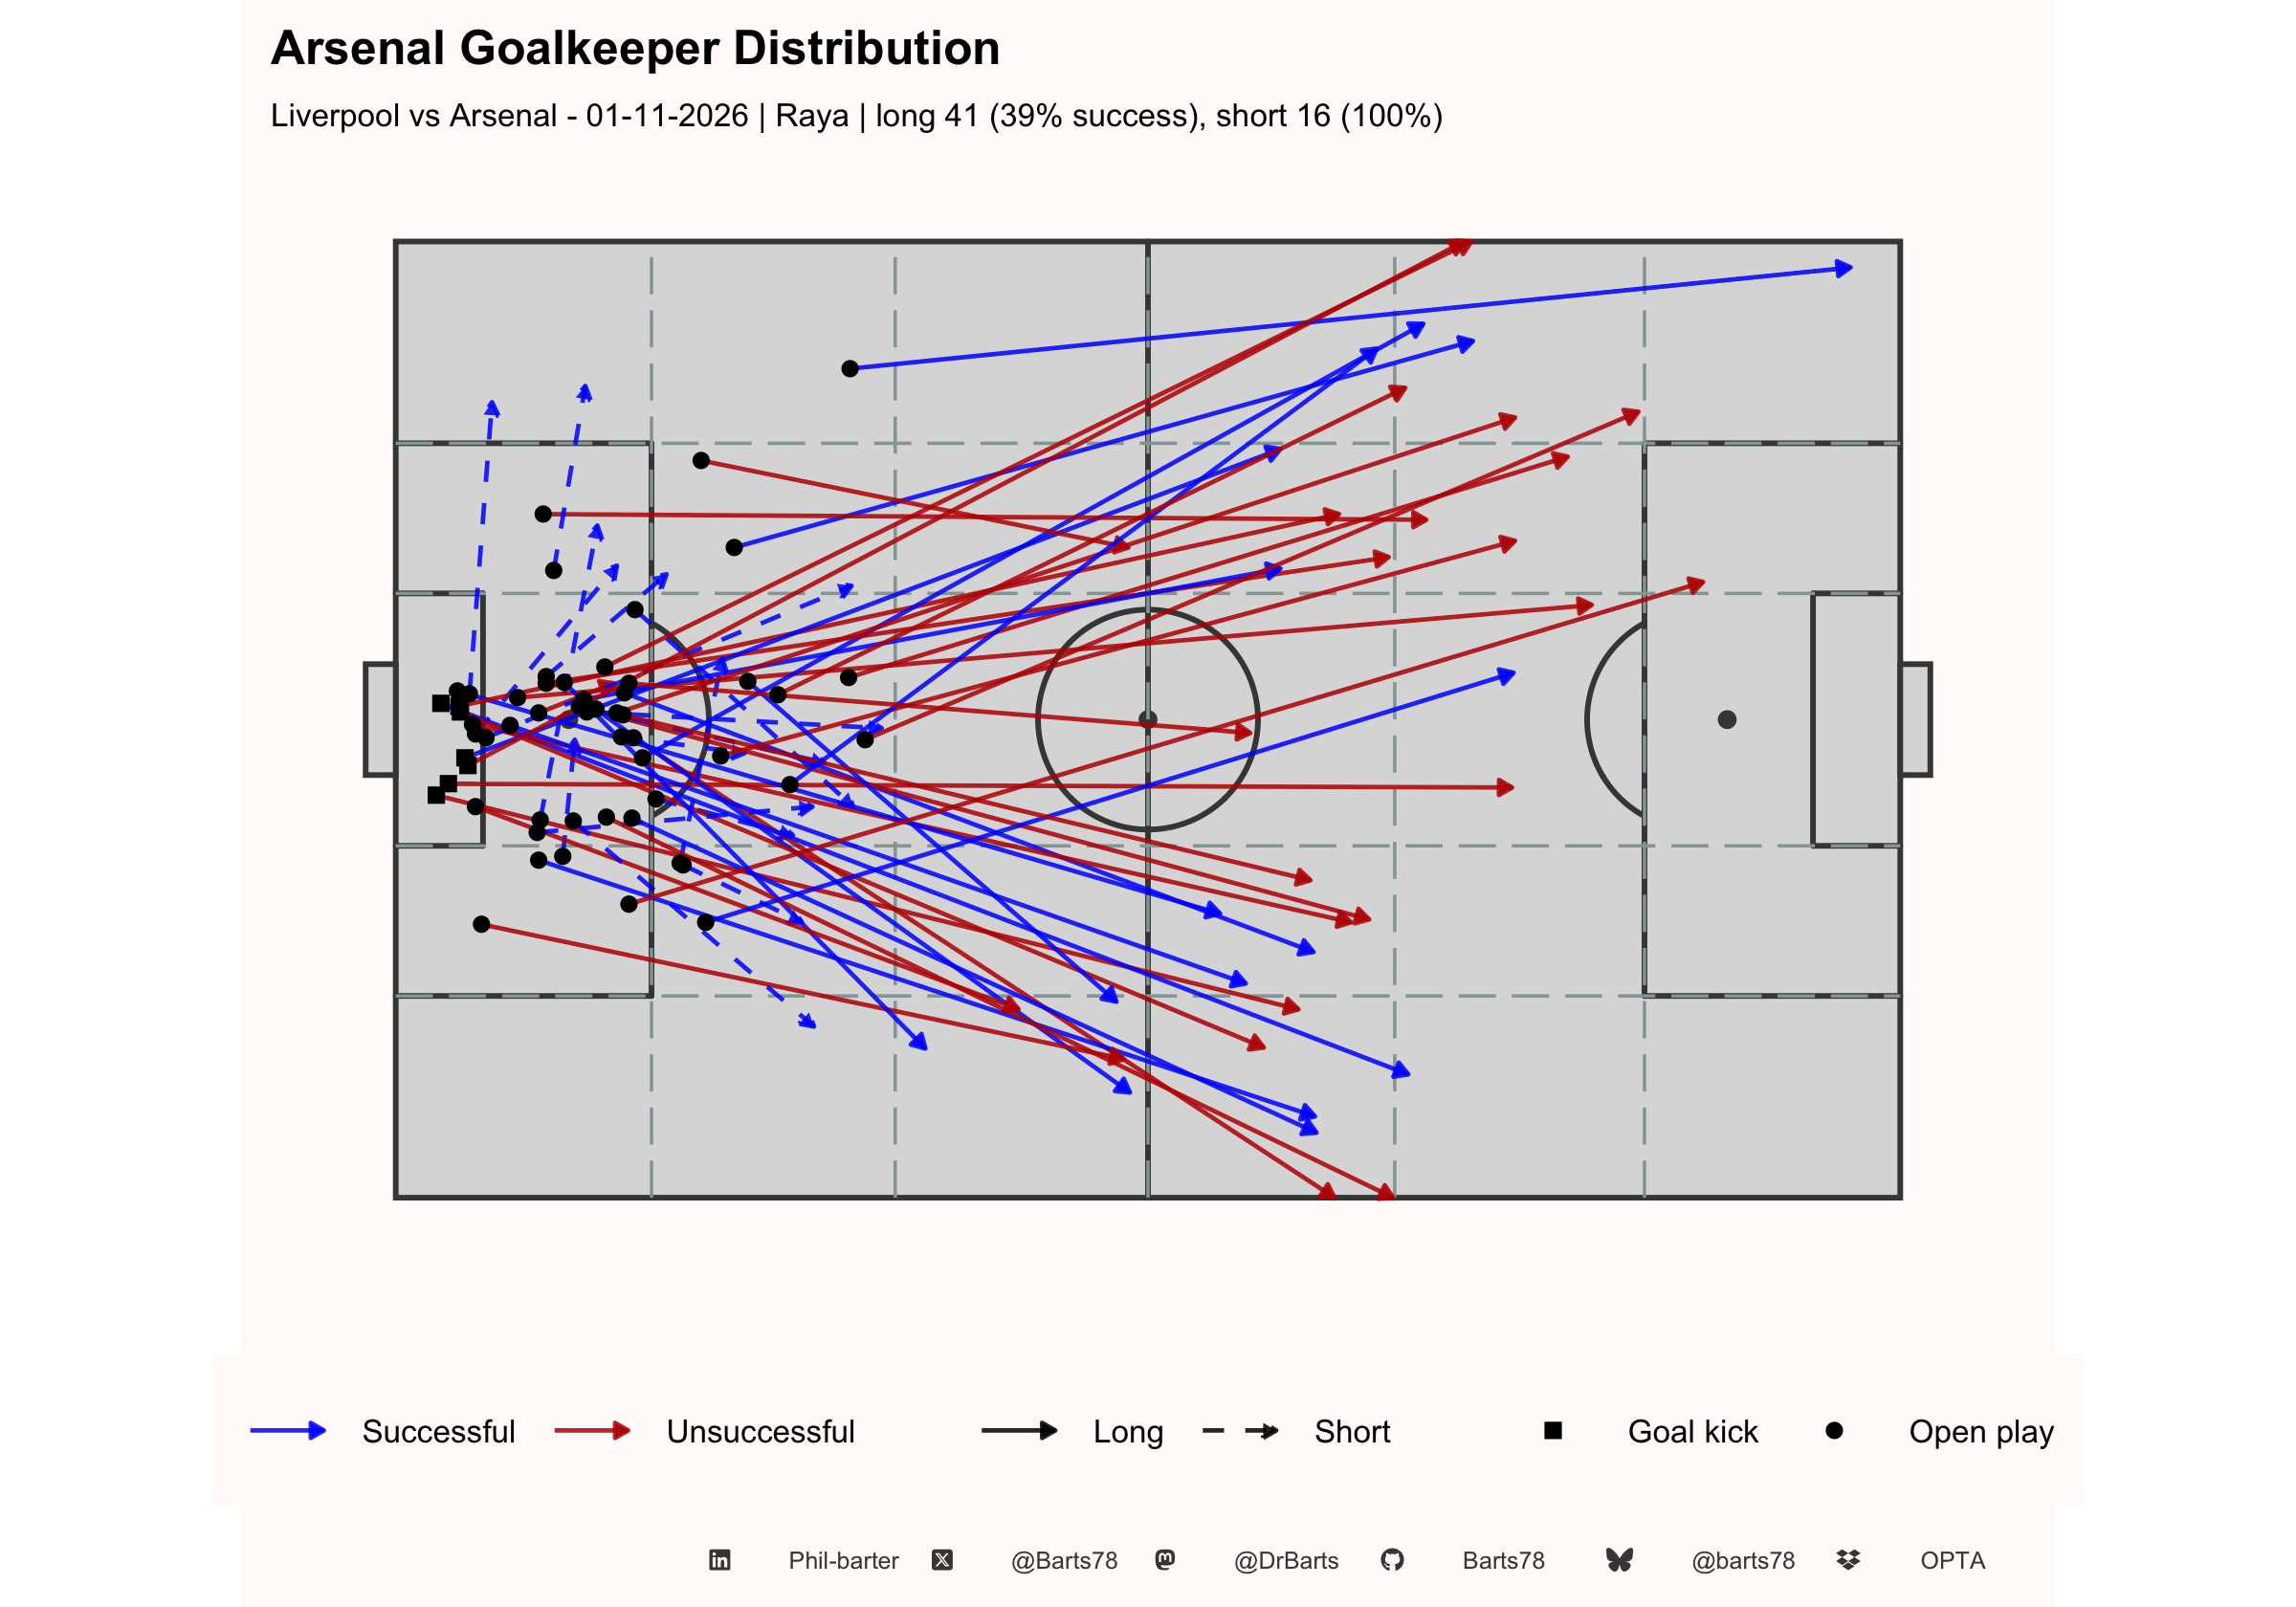
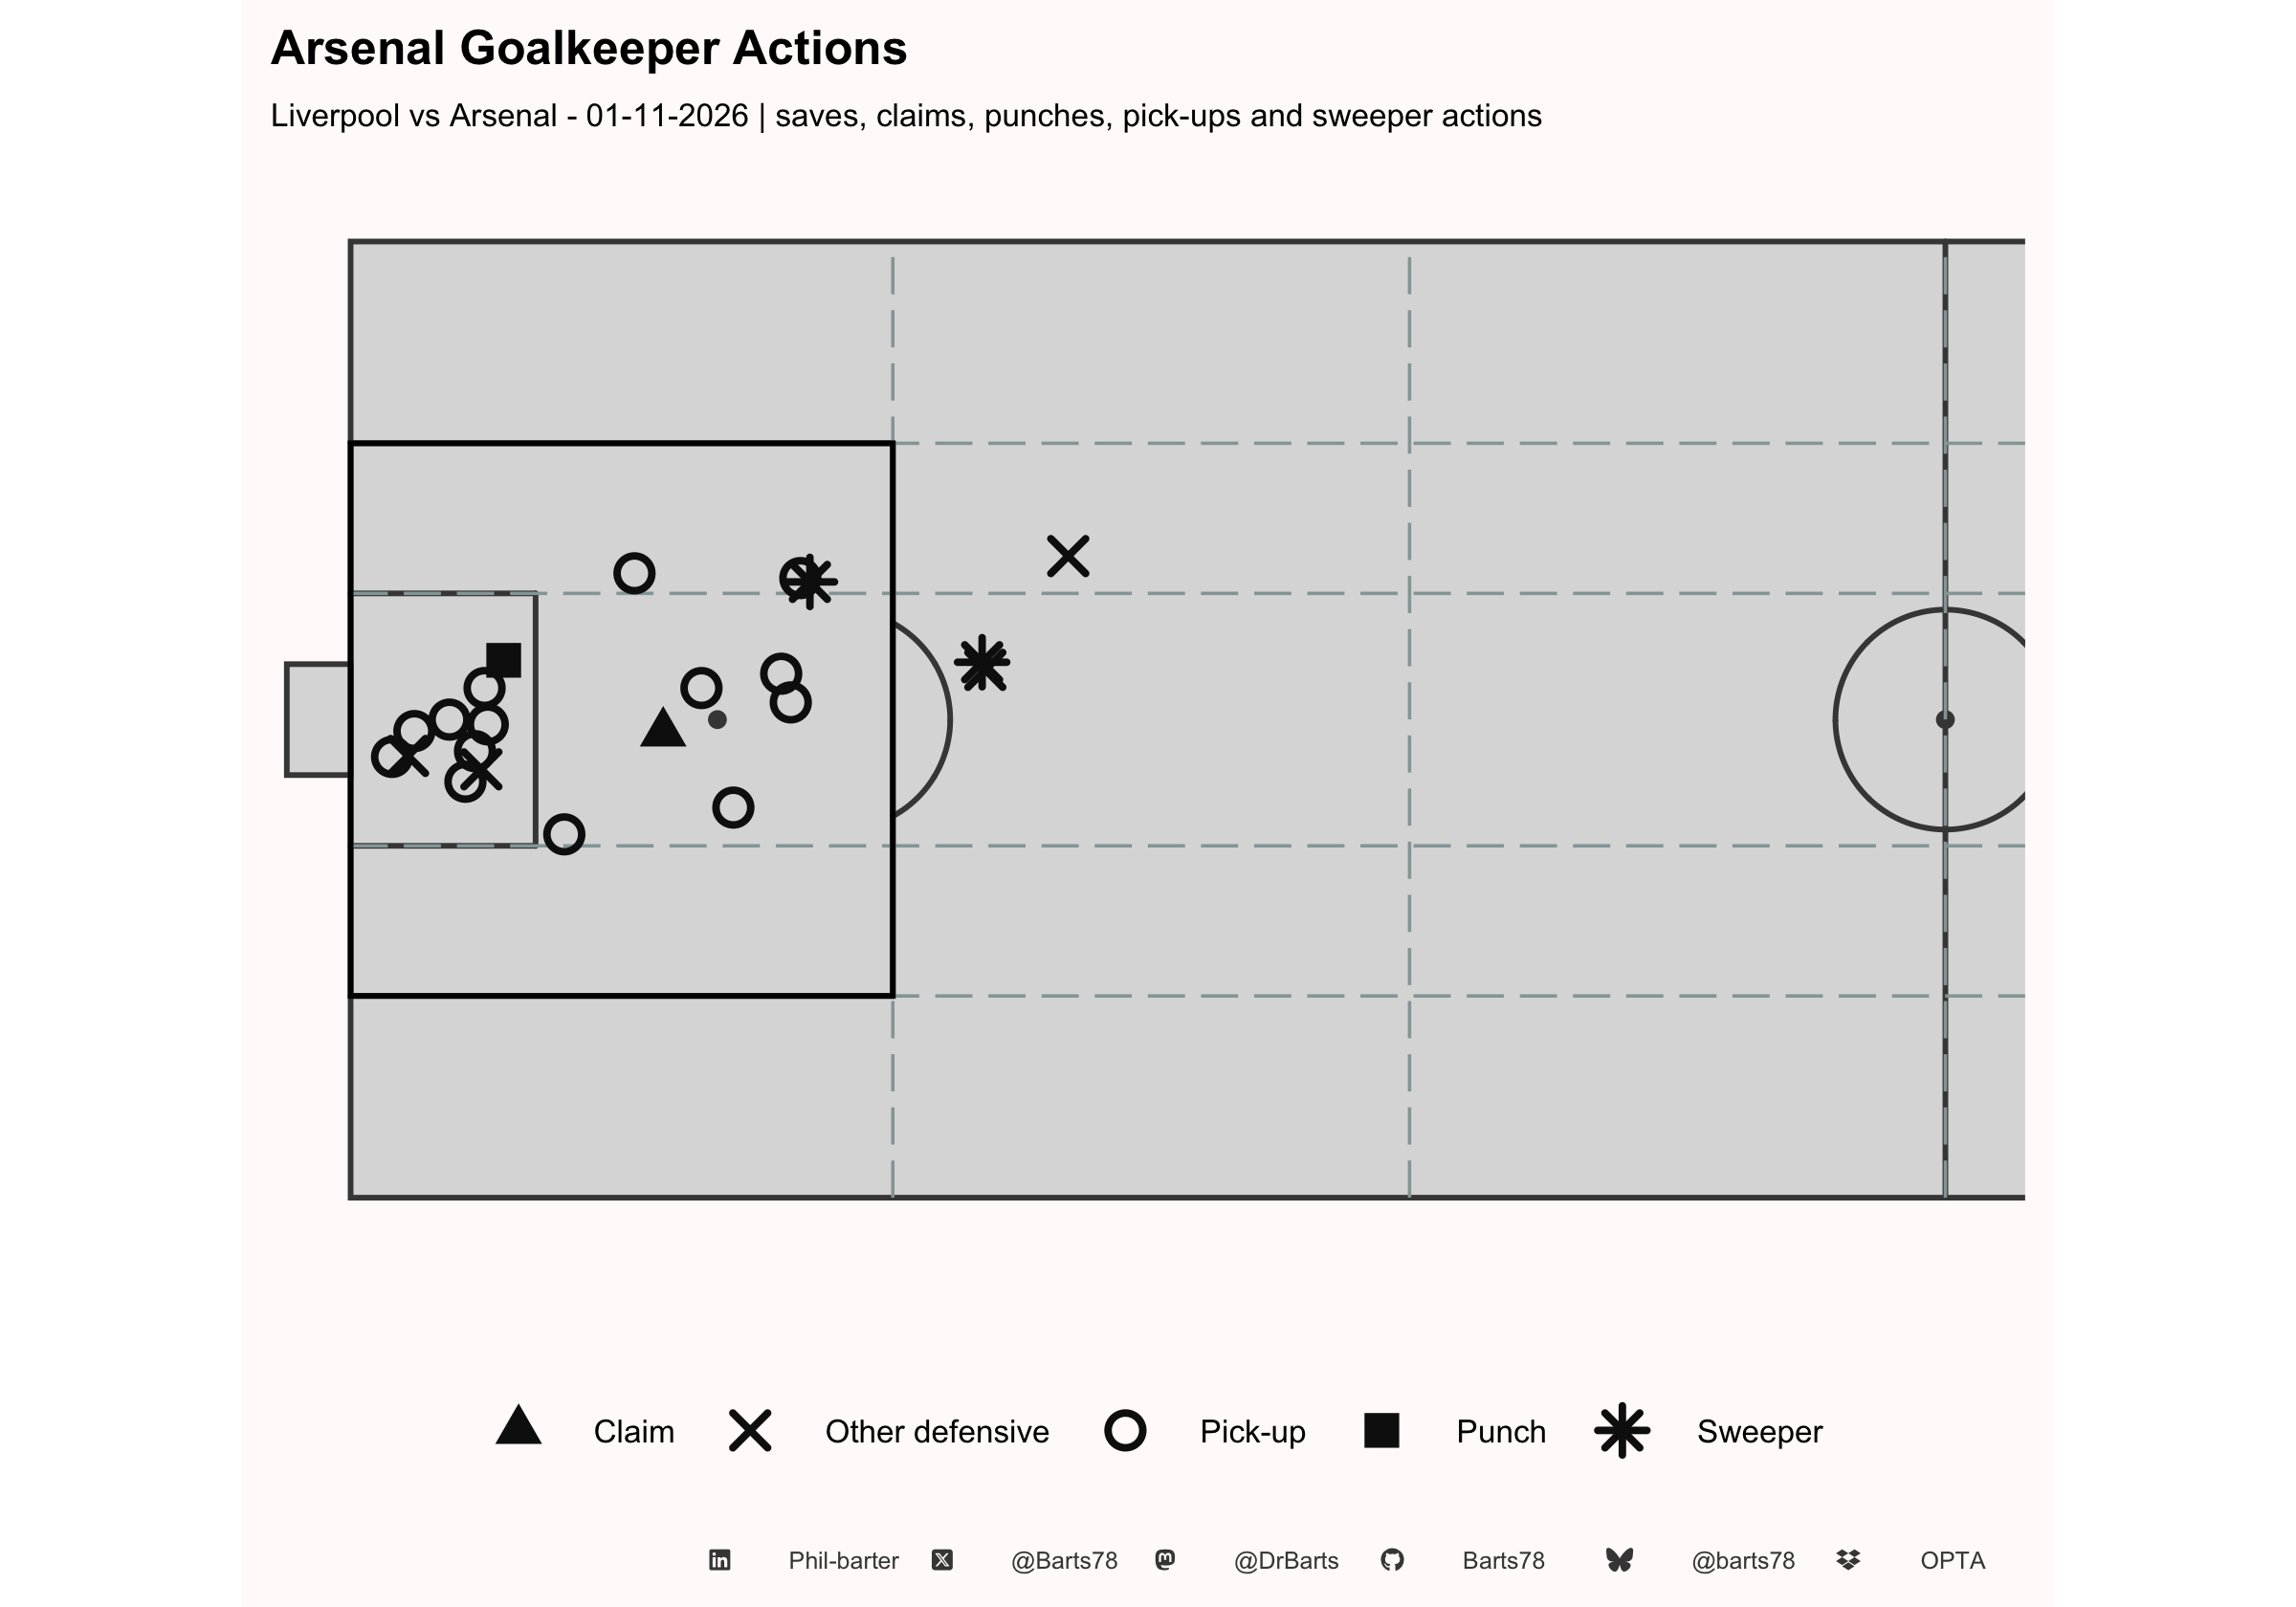
Event data: Opta (via WhoScored), processed with the Under Pressure pipeline.
Pitch: Opta coordinates, 0-100 on both axes; zone lines mark the thirds, the channels and Zone 14 / half-spaces.
Match minutes: charts use Opta’s continuous expandedMinute; scorer minutes on the overview page use the football convention (e.g. 45+2’).
[ADD DEFINITION - anything else readers should know about the data]
xG: [ADD DEFINITION]
NPxG: xG excluding penalties.
xGOT (expected goals on target): [ADD DEFINITION]
[ADD DEFINITION - what EPV measures and how to read it]
EPV % xG Conversion: team xG divided by team EPV, as a percentage - how much of the threat created turned into shot quality.
[ADD DEFINITION - grid/model used and how it differs from EPV]
Possession %: share of the two teams’ combined touches.
Field Tilt %: share of the two teams’ combined final-third touches.
Possession Control: possession won (interceptions, recoveries, net tackles, net aerials) minus possession lost (miscontrols, dispossessions, failed passes, crosses and dribbles, off-target and blocked shots, offsides).
Poss Control /100 Touches: Possession Control divided by touches x 100, so players and teams with different amounts of the ball can be compared. In the player tables it is greyed out for players with fewer than 20 touches (set by min_touches_pc).
[ADD DEFINITION - any interpretation notes]
PPDA (passes per defensive action): opponent passes in their own 60% of the pitch divided by the team’s tackles, interceptions, challenges and fouls committed in that same zone. Lower = more intense pressing. This one definition is used for the overview value box, the PPDA development plots, the PPDA table, the substitution windows and the match report (ppda_definition <- "standard"; set it to "simple" for the older all-passes / all-defensive-actions version, which is also shown in the PPDA table subtitle).
PPDO: [ADD DEFINITION]
PAPA (possession-adjusted pressing actions): presses scaled by the cube root of opponent possession over own possession, calculated per minute and shown as a rolling percentile.
OPPP (opponent passes per press): [ADD DEFINITION]
[ADD DEFINITION - how the PAPA percentile is built]
- Group Press: [ADD DEFINITION]
- Counter Press: [ADD DEFINITION]
- Pushed Opponent Back: [ADD DEFINITION]
- Direct Possession Win: [ADD DEFINITION]
- Won Possession: [ADD DEFINITION]
- Turnover: [ADD DEFINITION]
- Counter Attack: [ADD DEFINITION]
- High Value Press: [ADD DEFINITION]
- Led to Shot / Led to Goal: [ADD DEFINITION]
- Failed Press / Conceded Cross / Conceded Shot / Conceded Free Kick: [ADD DEFINITION]
- Press Efficiency: successful presses as a % of total presses.
- PAdj Presses: presses adjusted for possession share.
Each shot is simulated as a goal / no goal event 10,000 times, and the goals are summed per simulation to give scoreline and result probabilities.
- xG only: each shot scores with probability = its xG.
- Blended: probability = 0.4 x xG + 0.6 x xGOT.
- Optimistic: the higher of xG and xGOT for each shot.
- Pessimistic: the lower of xG and xGOT for each shot.
Shots with no xGOT value fall back to xG in all three. [ADD DEFINITION - note whether off-target shots carry xGOT = 0 in your data, which makes them count as 0 in the blended and pessimistic versions]
Own goals are not shots, so they are not simulated - the actual score can sit outside the simulated range.
[ADD DEFINITION - how to read the charts]
Game periods: 15-minute blocks (0-15 … 76-90, 90+).
Game quarters: 1st (1-25), 2nd (26 to the end of the first half), 3rd (start of the second half to 70), 4th (71-99), with everything else (extra time) as Injury Time.
Touch / press areas: the area covering activity within 1.5 MAD of the player’s median position (about 75% of actions); dot = average position.
Pass connections: built from completed passes only (Opta records no intended receiver for an incomplete pass). Line colour on pass networks = the two players’ overall completion %, weighted by passes on that link.
[ADD DEFINITION - game state labels, e.g. garbage time]
Sequence: starts when a team gets the ball (pass, carry, shot, take-on, touch, interception, recovery, won tackle, keeper claim/pick-up) and runs until the other team has it, the period ends or play restarts from a dead ball. Its start type is the first event: corner, free kick, throw-in, goal kick, kick-off, keeper, or open-play regain.
Shot-creating sequence: the sequence a shot belongs to. Passes = completed and attempted passes in it before the shot; duration = seconds from its first event to the shot.
Set pieces: corners, free kicks and throw-ins from the Opta corner/free-kick flags and qualifiers 5, 6 and 107. A short corner is the Short_Corners flag or a corner pass under 20m. First contact = the team of the next event within 8 seconds (aerial duels go to the winner); none if the ball goes out first. Set-piece xG uses the shot’s situation where available, otherwise the start type of its sequence.
Box / final-third entries: open-play passes and carries starting outside the box (or below the final third) and ending inside it. Channel = where the action started: wings (outer 21.1%), half-spaces, central. A carry is the ball moved 5m+ between where a player received it (end of the previous same-team event) and his next on-ball action, within 10 seconds. Taken from the processing pipeline (Carry_Start_X/Y to C_End_point_X/Y); files processed before that fix use the dashboard’s own equivalent definition.
[ADD DEFINITION - anything you want to add]
Open-play regain: a sequence started by winning the ball in play rather than from a restart or the keeper. Regain to shot = seconds from the regain to the shot; the fast-transition window is 15 seconds. Conceded = the opponent’s shots after your team lost the ball.
DA height: average position of defensive actions in metres from the team’s own goal (105m pitch). Block depth / width: by default (block_method <- "mad") the span of the median +/- 1.5 MAD (mad_k) of defensive-action positions along and across the pitch, drawn as a box (block_shape <- "hull" draws the outline of the actions inside instead); the block line is the median. Set block_method <- "quantile" for the 10th-90th percentile box with the mean as the line. On-ball height: average position of the team’s on-ball events.
PPDA (standard): opponent passes in their own 60% of the pitch divided by your tackles, interceptions, challenges and fouls in that same zone (your attacking 60%). Lower = more intense pressing. The older dashboard PPDA (all passes / all defensive actions) is shown in the table subtitle for comparison.
[ADD DEFINITION]
Substitution windows: the match split at each substitution (subs within 3 minutes are grouped). xG and EPV are per 10 minutes so windows of different length compare; field tilt and PPDA are calculated within the window.
Match vs season: this match against the average of the focus team’s other games in the season database (grey bar = range). Blue = better than average, red = worse; for goals, xG, shots, EPV and EPV to xG % against, lower is better. Off-ball side also shows interceptions, recoveries, tackles won and aerials won.
[ADD DEFINITION]
Goals prevented: xGOT of shots on target faced minus goals conceded (own goals excluded). Positive = the keeper kept out more than an average keeper would.
Distribution: keeper passes; long = Opta long ball or 32m+. Sweeper actions: Opta keeper-sweeper events plus claims, punches and defensive actions outside the penalty area.
[ADD DEFINITION]