| Season Summary - Full Games | |||||||||||||||||||||||||||
|---|---|---|---|---|---|---|---|---|---|---|---|---|---|---|---|---|---|---|---|---|---|---|---|---|---|---|---|
| Chelsea vs All Oppo | |||||||||||||||||||||||||||
| Possession % | Touches | PKBox Touches | Field Tilt % | Total Shots | OFF Shots | SoT | 6yrd box Shots | PK Box Shots | Outside Box Shots | BCs | Goals | xG | NPxG | xGOT | EPV | EPV % xG Con. | Attempted Passes | Successful Passes | Pass Success % | Long Passes | Long Ball Rate | Crosses | Cross Success % | Corners | Short Corners | Possession Control | EPV % NPxG Con. |
| All Oppo | |||||||||||||||||||||||||||
| 42.4% | 1636 | 50 | 37.8% | 34 | 14 | 9 | 2 | 21 | 13 | 3 | 1.00 | 2.41 | 2.41 | 0.68 | 4.860 | 49.6% | 1033 | 844 | 81.7% | 174 | 16.8% | 37 | 27.0% | 13 | 1 | -196 | 49.6% |
| Chelsea | |||||||||||||||||||||||||||
| 57.6% | 2223 | 84 | 62.2% | 44 | 12 | 15 | 10 | 31 | 13 | 12 | 7.00 | 6.70 | 5.91 | 8.98 | 8.395 | 79.8% | 1639 | 1444 | 88.1% | 163 | 9.9% | 51 | 23.5% | 22 | 3 | -171 | 70.4% |
| . Phil-barter . . @Barts78 . . @DrBarts . . Barts78 . . OPTA . | |||||||||||||||||||||||||||
| Season Summary - By Half | ||||||||||||||||||||||||||||
|---|---|---|---|---|---|---|---|---|---|---|---|---|---|---|---|---|---|---|---|---|---|---|---|---|---|---|---|---|
| Chelsea vs All Oppo | ||||||||||||||||||||||||||||
Possession
|
Shots
|
Passes
|
Pass Success % | Long Passes | Long Ball Rate | Crosses | Cross Success % | Corners | Short Corners | Possession Control | EPV % NPxG Con. | |||||||||||||||||
| Possession % | Touches | PKBox Touches | Field Tilt % | Total Shots | OFF Shots | SoT | 6yrd box Shots | PK Box Shots | Outside Box Shots | BCs | Goals | xG | NPxG | xGOT | EPV | EPV % xG Con. | Attempted Passes | Successful Passes | ||||||||||
| First Half | ||||||||||||||||||||||||||||
| All Oppo | 40.8% | 782 | 18 | 34.7% | 18 | 6 | 6 | 0 | 10 | 8 | 1 | 1.00 | 1.06 | 1.06 | 0.57 | 1.993 | 53.2% | 498 | 397 | 79.7% | 86 | 17.3% | 11 | 18.2% | 2 | 0 | -98 | 53.2% |
| Chelsea | 59.2% | 1137 | 37 | 65.3% | 23 | 4 | 7 | 7 | 14 | 9 | 6 | 4.00 | 3.22 | 3.22 | 4.55 | 4.391 | 73.3% | 848 | 743 | 87.6% | 87 | 10.3% | 24 | 33.3% | 12 | 2 | -93 | 73.3% |
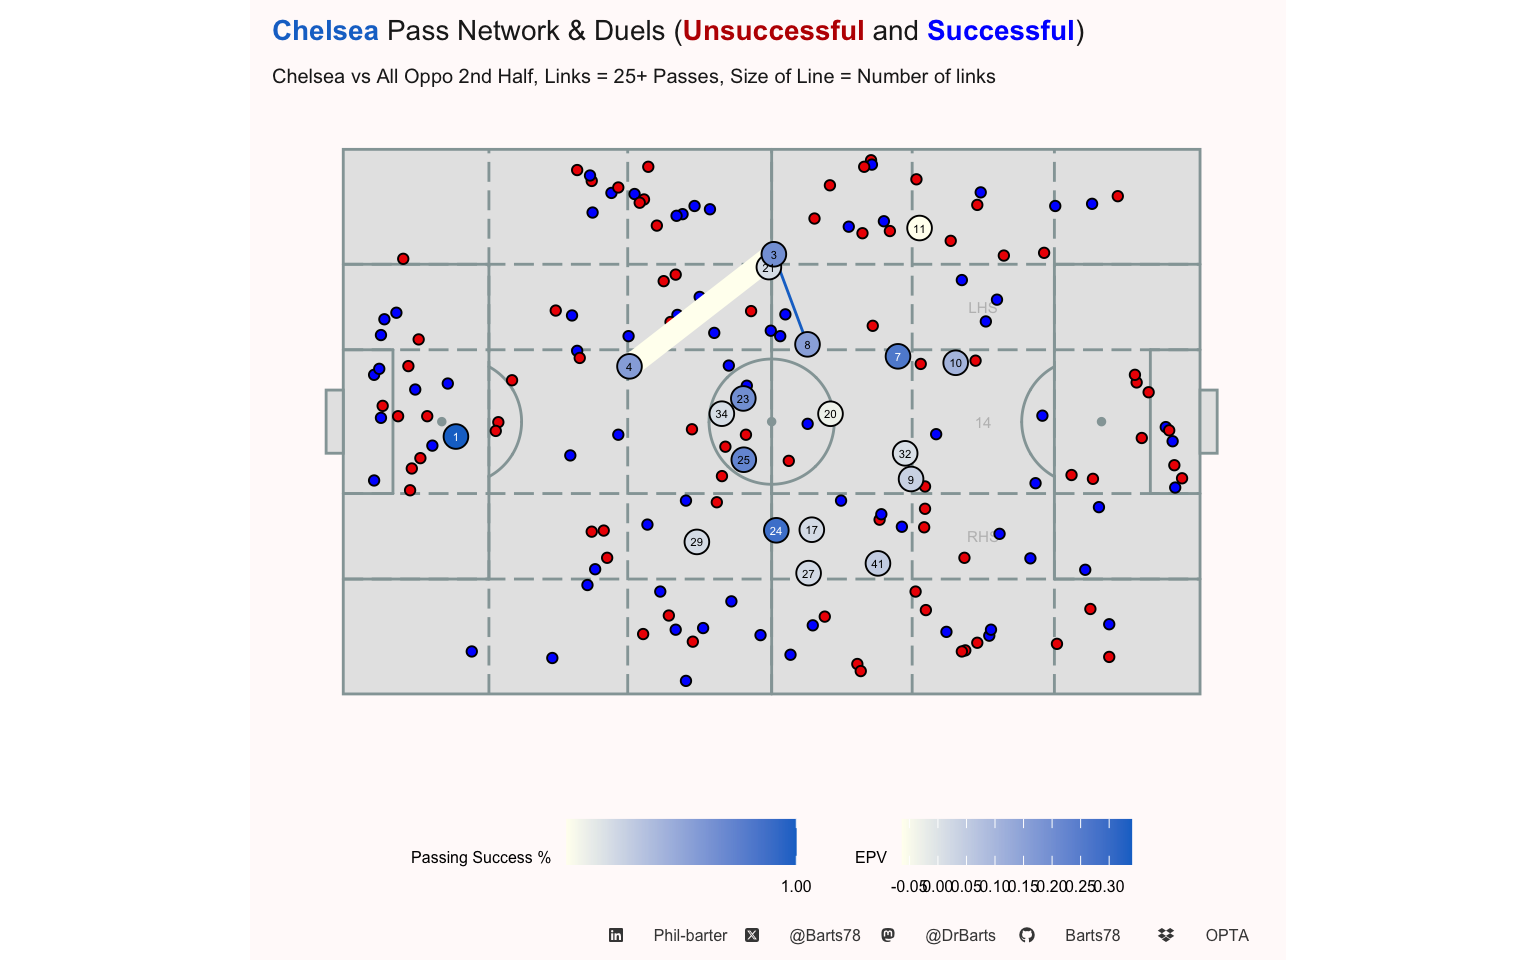
| Second Half | ||||||||||||||||||||||||||||
| All Oppo | 44.0% | 854 | 32 | 40.2% | 16 | 8 | 3 | 2 | 11 | 5 | 2 | 0.00 | 1.35 | 1.35 | 0.11 | 2.867 | 47.1% | 535 | 447 | 83.6% | 88 | 16.4% | 26 | 30.8% | 11 | 1 | -98 | 47.1% |
| Chelsea | 56.0% | 1086 | 47 | 59.8% | 21 | 8 | 8 | 3 | 17 | 4 | 6 | 3.00 | 3.48 | 2.69 | 4.43 | 4.004 | 86.9% | 791 | 701 | 88.6% | 76 | 9.6% | 27 | 14.8% | 10 | 1 | -78 | 67.2% |
| . Phil-barter . . @Barts78 . . @DrBarts . . Barts78 . . OPTA . | ||||||||||||||||||||||||||||
| Season Summary - By Game Period | ||||||||||||||||||||||||||||
|---|---|---|---|---|---|---|---|---|---|---|---|---|---|---|---|---|---|---|---|---|---|---|---|---|---|---|---|---|
| Chelsea vs All Oppo | ||||||||||||||||||||||||||||
Possession
|
Shots
|
Passes
|
Pass Success % | Long Passes | Long Ball Rate | Crosses | Cross Success % | Corners | Short Corners | Possession Control | EPV % NPxG Con. | |||||||||||||||||
| Possession % | Touches | PKBox Touches | Field Tilt % | Total Shots | OFF Shots | ONT Shots | 6yrd box Shots | PK Box Shots | Outside Box Shots | BCs | Goals | xG | NPxG | xGOT | EPV | EPV % xG Con. | Attempted Passes | Successful Passes | ||||||||||
| 0 - 15 | ||||||||||||||||||||||||||||
| All Oppo | 37.4% | 212 | 4 | 29.6% | 4 | 3 | 1 | 0 | 2 | 2 | 0 | 1.00 | 0.18 | 0.18 | 0.07 | 0.407 | 44.2% | 135 | 107 | 79.3% | 21 | 15.6% | 1 | 0.0% | 0 | 0 | -25 | 44.2% |
| Chelsea | 62.6% | 355 | 9 | 70.4% | 4 | 0 | 2 | 2 | 3 | 1 | 1 | 1.00 | 0.52 | 0.52 | 1.01 | 1.348 | 38.6% | 285 | 244 | 85.6% | 32 | 11.2% | 9 | 33.3% | 5 | 1 | -36 | 38.6% |
| 16 - 30 | ||||||||||||||||||||||||||||
| All Oppo | 44.1% | 225 | 3 | 37.4% | 6 | 1 | 3 | 0 | 2 | 4 | 1 | 0.00 | 0.37 | 0.37 | 0.32 | 0.595 | 62.2% | 146 | 117 | 80.1% | 25 | 17.1% | 5 | 20.0% | 1 | 0 | -37 | 62.2% |
| Chelsea | 55.9% | 285 | 13 | 62.6% | 11 | 3 | 2 | 1 | 6 | 5 | 2 | 1.00 | 0.87 | 0.87 | 0.92 | 0.979 | 88.9% | 196 | 170 | 86.7% | 22 | 11.2% | 6 | 33.3% | 3 | 1 | -22 | 88.9% |
| 31 - 45 | ||||||||||||||||||||||||||||
| All Oppo | 41.0% | 345 | 11 | 36.1% | 8 | 2 | 2 | 0 | 6 | 2 | 0 | 0.00 | 0.51 | 0.51 | 0.18 | 0.991 | 51.5% | 217 | 173 | 79.7% | 40 | 18.4% | 5 | 20.0% | 1 | 0 | -36 | 51.5% |
| Chelsea | 59.0% | 497 | 15 | 63.9% | 8 | 1 | 3 | 4 | 5 | 3 | 3 | 2.00 | 1.83 | 1.83 | 2.62 | 2.064 | 88.7% | 367 | 329 | 89.6% | 33 | 9.0% | 9 | 33.3% | 4 | 0 | -35 | 88.7% |
| 46 - 60 | ||||||||||||||||||||||||||||
| All Oppo | 45.8% | 256 | 3 | 27.5% | 1 | 1 | 0 | 0 | 1 | 0 | 0 | 0.00 | 0.04 | 0.04 | 0.00 | 0.506 | 7.9% | 170 | 135 | 79.4% | 28 | 16.5% | 3 | 33.3% | 0 | 0 | -30 | 7.9% |
| Chelsea | 54.2% | 303 | 17 | 72.5% | 8 | 3 | 4 | 1 | 6 | 2 | 4 | 3.00 | 2.01 | 1.22 | 3.11 | 1.237 | 162.5% | 217 | 184 | 84.8% | 27 | 12.4% | 9 | 11.1% | 2 | 0 | -18 | 98.6% |
| 61 - 75 | ||||||||||||||||||||||||||||
| All Oppo | 40.2% | 243 | 11 | 36.8% | 4 | 2 | 1 | 0 | 3 | 1 | 0 | 0.00 | 0.17 | 0.17 | 0.07 | 0.677 | 25.1% | 149 | 124 | 83.2% | 22 | 14.8% | 10 | 10.0% | 5 | 0 | -40 | 25.1% |
| Chelsea | 59.8% | 362 | 14 | 63.2% | 7 | 3 | 1 | 2 | 7 | 0 | 1 | 0.00 | 1.03 | 1.03 | 0.63 | 1.628 | 63.3% | 278 | 256 | 92.1% | 21 | 7.5% | 9 | 22.2% | 3 | 1 | -15 | 63.3% |
| 76 - 90 | ||||||||||||||||||||||||||||
| All Oppo | 44.9% | 279 | 11 | 51.9% | 7 | 4 | 2 | 1 | 4 | 3 | 1 | 0.00 | 0.53 | 0.53 | 0.04 | 1.221 | 43.4% | 172 | 148 | 86.0% | 29 | 16.9% | 9 | 44.4% | 4 | 0 | -27 | 43.4% |
| Chelsea | 55.1% | 343 | 11 | 48.1% | 4 | 1 | 2 | 0 | 2 | 2 | 0 | 0.00 | 0.13 | 0.13 | 0.06 | 0.743 | 17.5% | 254 | 222 | 87.4% | 26 | 10.2% | 3 | 33.3% | 1 | 0 | -23 | 17.5% |
| 90 + | ||||||||||||||||||||||||||||
| All Oppo | 49.4% | 76 | 7 | 47.6% | 4 | 1 | 0 | 1 | 3 | 1 | 1 | 0.00 | 0.61 | 0.61 | 0.00 | 0.463 | 131.7% | 44 | 40 | 90.9% | 9 | 20.4% | 4 | 50.0% | 2 | 1 | -1 | 131.7% |
| Chelsea | 50.6% | 78 | 5 | 52.4% | 2 | 1 | 1 | 0 | 2 | 0 | 1 | 0.00 | 0.31 | 0.31 | 0.63 | 0.396 | 78.3% | 42 | 39 | 92.9% | 2 | 4.8% | 6 | 0.0% | 4 | 0 | -22 | 78.3% |
| . Phil-barter . . @Barts78 . . @DrBarts . . Barts78 . . OPTA . | ||||||||||||||||||||||||||||
| Season Summary - By Game State | ||||||||||||||||||||||||||||
|---|---|---|---|---|---|---|---|---|---|---|---|---|---|---|---|---|---|---|---|---|---|---|---|---|---|---|---|---|
| Chelsea vs All Oppo | ||||||||||||||||||||||||||||
Possession
|
Shots
|
Passes
|
Pass Success % | Long Passes | Long Ball Rate | Crosses | Cross Success % | Corners | Short Corners | Possession Control | EPV % NPxG Con. | |||||||||||||||||
| Possession % | Touches | PKBox Touches | Field Tilt % | Total Shots | OFF Shots | SoT | 6yrd box Shots | PK Box Shots | Outside Box Shots | BCs | Goals | xG | NPxG | xGOT | EPV | EPV % xG Con. | Attempted Passes | Successful Passes | ||||||||||
| Away Garbage Time | ||||||||||||||||||||||||||||
| All Oppo | 46.5% | 422.00 | 18 | 58.4% | 10 | 5 | 3 | 1 | 8 | 2 | 1 | 0.00 | 0.70 | 0.70 | 0.25 | 1.760 | 39.8% | 284 | 250 | 88.0% | 29 | 10.2% | 11 | 36.4% | 6 | 0 | -41 | 39.8% |
| Chelsea | 53.5% | 486.00 | 17 | 41.6% | 7 | 3 | 3 | 1 | 6 | 1 | 4 | 2.00 | 1.12 | 1.12 | 2.27 | 1.132 | 98.9% | 377 | 334 | 88.6% | 36 | 9.6% | 9 | 11.1% | 4 | 0 | -33 | 98.9% |
| Away Lead | ||||||||||||||||||||||||||||
| All Oppo | 51.8% | 72.00 | 1 | 45.0% | 0 | 0 | 0 | 0 | 0 | 0 | 0 | 0.00 | 0.00 | 0.00 | 0.00 | 0.168 | 0.0% | 57 | 50 | 87.7% | 5 | 8.8% | 1 | 0.0% | 0 | 0 | -7 | 0.0% |
| Chelsea | 48.2% | 67.00 | 2 | 55.0% | 2 | 1 | 1 | 1 | 1 | 1 | 1 | 1.00 | 0.85 | 0.85 | 0.99 | 0.407 | 208.8% | 56 | 49 | 87.5% | 6 | 10.7% | 0 | 0.0% | 0 | 0 | -6 | 208.8% |
| Draw | ||||||||||||||||||||||||||||
| All Oppo | 39.6% | 802.00 | 17 | 28.6% | 18 | 6 | 6 | 0 | 8 | 10 | 1 | 1.00 | 0.99 | 0.99 | 0.43 | 1.852 | 53.5% | 476 | 364 | 76.5% | 100 | 21.0% | 14 | 14.3% | 4 | 0 | -107 | 53.5% |
| Chelsea | 60.4% | 1,225.00 | 47 | 71.4% | 28 | 7 | 7 | 6 | 18 | 10 | 5 | 2.00 | 3.08 | 3.08 | 3.26 | 4.971 | 62.0% | 880 | 771 | 87.6% | 93 | 10.6% | 34 | 26.5% | 15 | 2 | -105 | 62.0% |
| Home Garbage Time | ||||||||||||||||||||||||||||
| All Oppo | 47.4% | 279.00 | 12 | 46.1% | 5 | 2 | 0 | 1 | 4 | 1 | 1 | 0.00 | 0.68 | 0.68 | 0.00 | 0.901 | 75.5% | 182 | 154 | 84.6% | 32 | 17.6% | 9 | 33.3% | 3 | 1 | -34 | 75.5% |
| Chelsea | 52.6% | 309.00 | 12 | 53.9% | 5 | 1 | 2 | 1 | 4 | 1 | 0 | 0.00 | 0.53 | 0.53 | 0.72 | 1.169 | 45.3% | 216 | 191 | 88.4% | 22 | 10.2% | 4 | 25.0% | 2 | 1 | -20 | 45.3% |
| Home Lead | ||||||||||||||||||||||||||||
| All Oppo | 31.0% | 61.00 | 2 | 16.1% | 1 | 1 | 0 | 0 | 1 | 0 | 0 | 0.00 | 0.04 | 0.04 | 0.00 | 0.179 | 22.3% | 34 | 26 | 76.5% | 8 | 23.5% | 2 | 50.0% | 0 | 0 | -7 | 22.3% |
| Chelsea | 69.0% | 136.00 | 6 | 83.9% | 2 | 0 | 2 | 1 | 2 | 0 | 2 | 2.00 | 1.12 | 0.33 | 1.74 | 0.716 | 156.4% | 110 | 99 | 90.0% | 6 | 5.5% | 4 | 25.0% | 1 | 0 | -7 | 46.1% |
| . Phil-barter . . @Barts78 . . @DrBarts . . Barts78 . . OPTA . | ||||||||||||||||||||||||||||
| Season Summary - By Match Day | |||||||||||||||||||||||||||||
|---|---|---|---|---|---|---|---|---|---|---|---|---|---|---|---|---|---|---|---|---|---|---|---|---|---|---|---|---|---|
| Chelsea vs All Oppo | |||||||||||||||||||||||||||||
| Fixture |
Possession
|
Shots
|
Passes
|
Successful Passes | Pass Success % | Long Passes | Long Ball Rate | Crosses | Cross Success % | Corners | Short Corners | Possession Control | EPV % NPxG Con. | ||||||||||||||||
| Possession % | Touches | PKBox Touches | Field Tilt % | Total Shots | OFF Shots | SoT | 6yrd box Shots | PK Box Shots | Outside Box Shots | BCs | Goals | xG | NPxG | xGOT | EPV | EPV % xG Con. | Attempted Passes | ||||||||||||
| 1 | |||||||||||||||||||||||||||||
| All Oppo | Chelsea vs crystal palace 17-08-25 | 35.4% | 426.00 | 9 | 23.6% | 11 | 3 | 4 | 0 | 4 | 7 | 1 | 0.00 | 0.67 | 0.67 | 0.26 | 0.821 | 81.6% | 226 | 168 | 74.3% | 54 | 23.9% | 10 | 0.0% | 2 | 0 | -60 | 81.6% |
| Chelsea | Chelsea vs crystal palace 17-08-25 | 64.6% | 779.00 | 31 | 76.4% | 19 | 7 | 2 | 3 | 11 | 8 | 2 | 0.00 | 1.59 | 1.59 | 0.65 | 3.325 | 47.8% | 568 | 510 | 89.8% | 53 | 9.3% | 24 | 20.8% | 11 | 1 | -68 | 47.8% |
| 2 | |||||||||||||||||||||||||||||
| All Oppo | West Ham vs Chelsea 22-08-25 | 44.5% | 581.00 | 21 | 50.0% | 12 | 5 | 4 | 1 | 9 | 3 | 1 | 1.00 | 0.72 | 0.72 | 0.32 | 2.133 | 33.8% | 392 | 339 | 86.5% | 46 | 11.7% | 13 | 30.8% | 7 | 0 | -64 | 33.8% |
| Chelsea | West Ham vs Chelsea 22-08-25 | 55.5% | 724.00 | 26 | 50.0% | 12 | 4 | 7 | 3 | 10 | 2 | 7 | 5.00 | 2.75 | 2.75 | 5.13 | 2.320 | 118.5% | 577 | 505 | 87.5% | 53 | 9.2% | 14 | 21.4% | 5 | 0 | -55 | 118.5% |
| 3 | |||||||||||||||||||||||||||||
| All Oppo | Chelsea vs Fulham 30-08-25 | 46.6% | 629.00 | 20 | 40.2% | 11 | 6 | 1 | 1 | 8 | 3 | 1 | 0.00 | 1.02 | 1.02 | 0.10 | 1.906 | 53.5% | 415 | 337 | 81.2% | 74 | 17.8% | 14 | 42.9% | 4 | 1 | -72 | 53.5% |
| Chelsea | Chelsea vs Fulham 30-08-25 | 53.4% | 720.00 | 27 | 59.8% | 13 | 1 | 6 | 4 | 10 | 3 | 3 | 2.00 | 2.36 | 1.57 | 3.20 | 2.750 | 85.8% | 494 | 429 | 86.8% | 57 | 11.5% | 13 | 30.8% | 6 | 2 | -48 | 57.1% |
| . Phil-barter . . @Barts78 . . @DrBarts . . Barts78 . . OPTA . | |||||||||||||||||||||||||||||
Whole Season
Game State - Winning
Game State - Drawing
Game State - Garbage Time

Whole Season
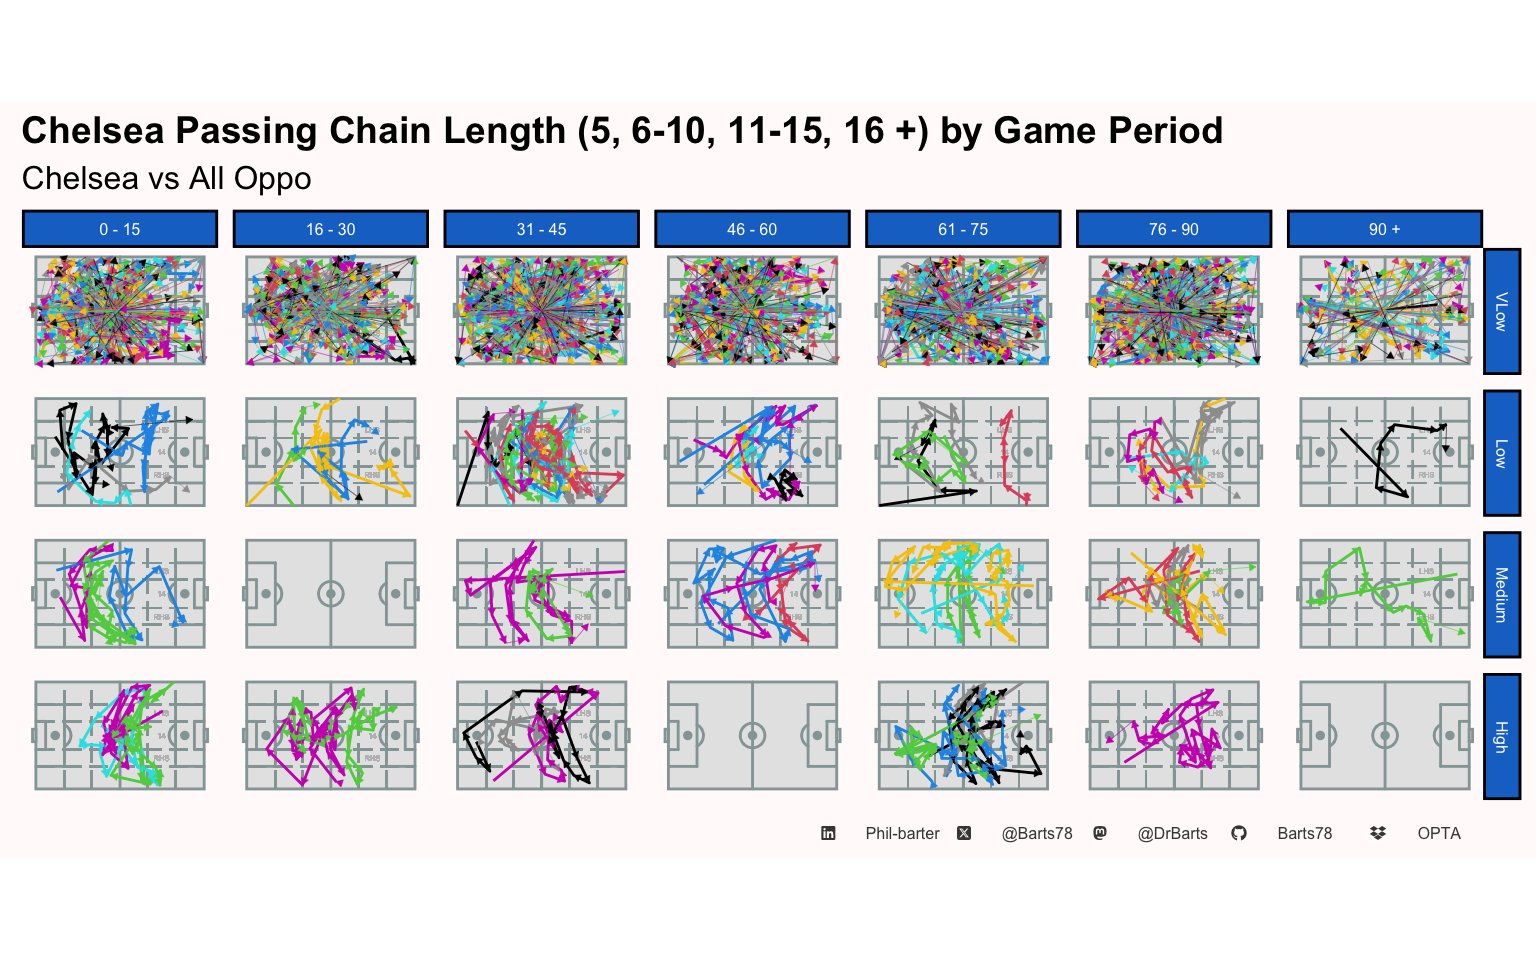
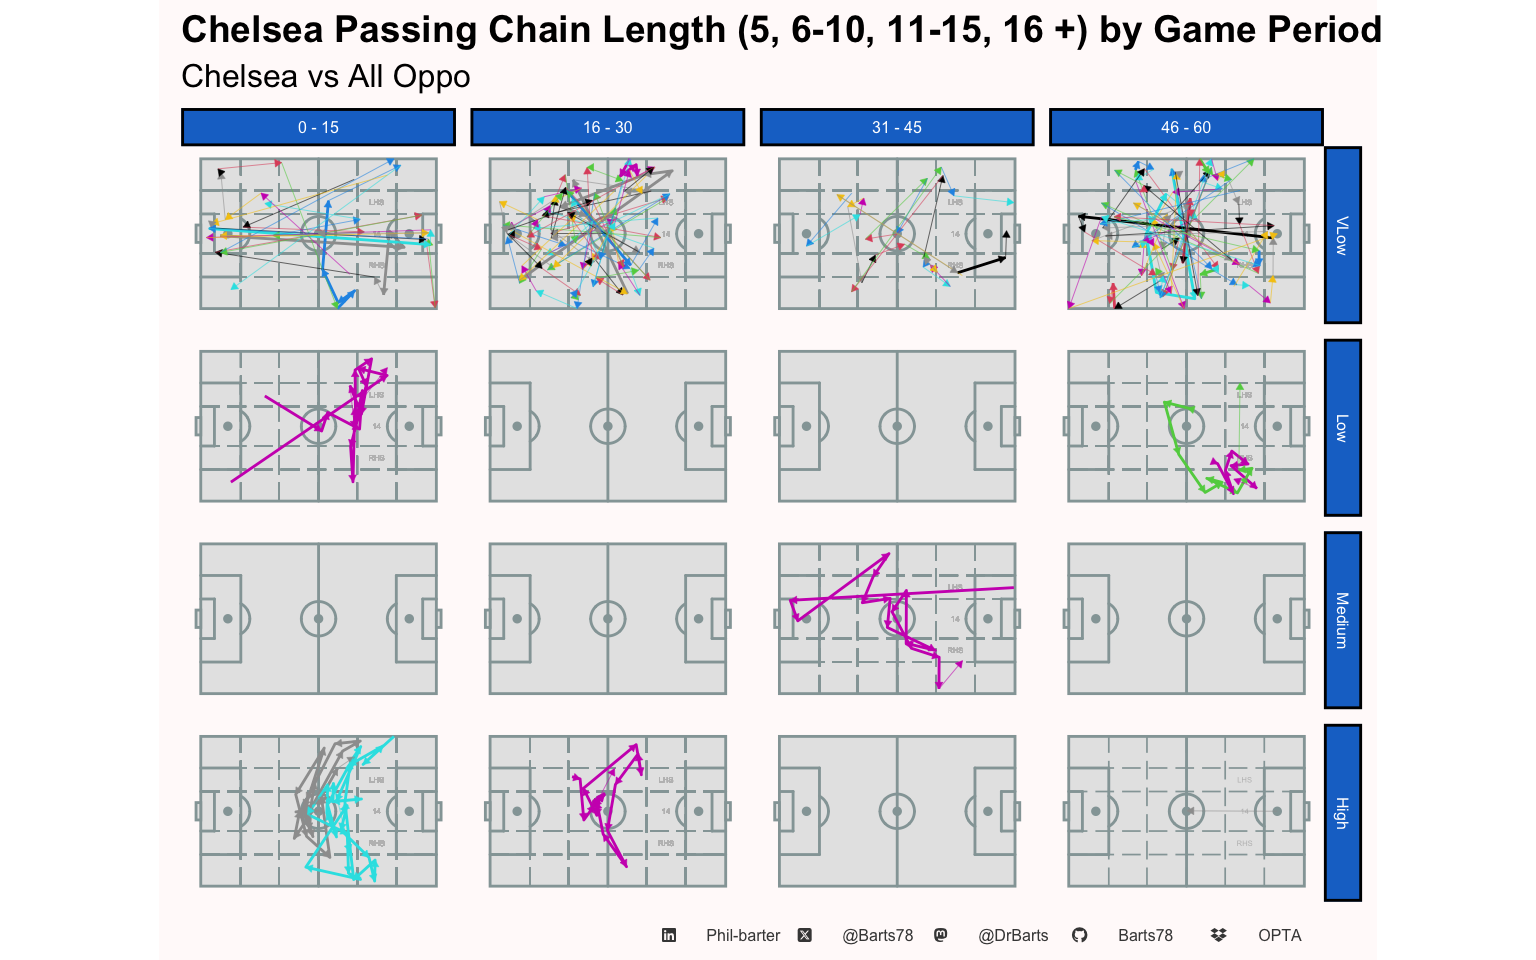
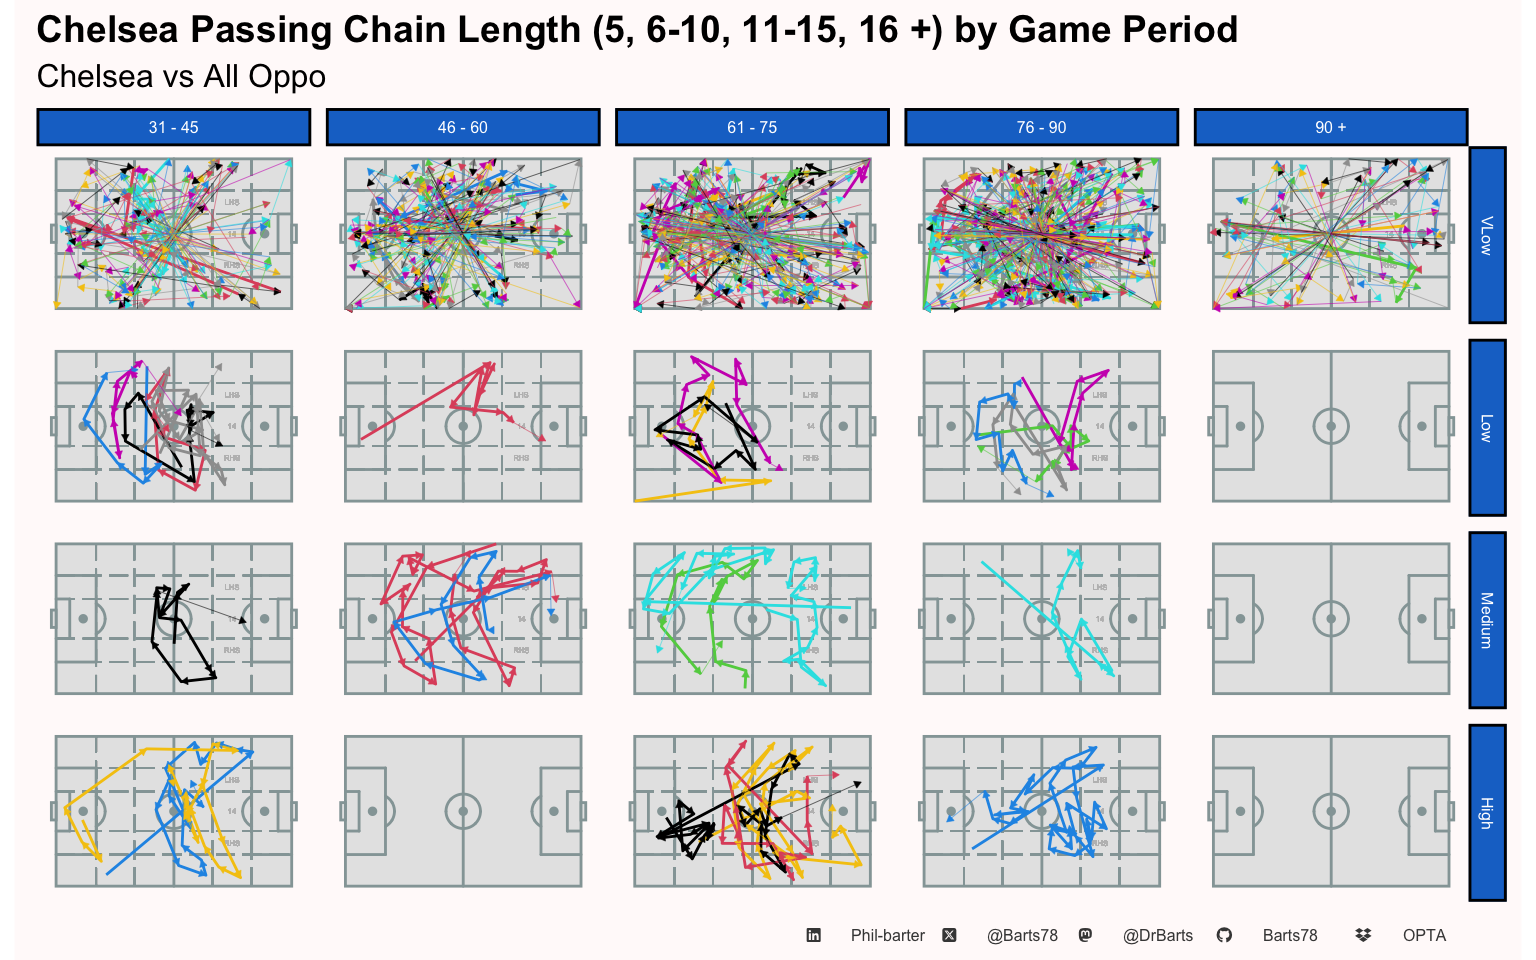
| Chelsea Full season Passing Chain Length (5, 6-10, 11-15, 16 +) & Distance (m) | |||||||||
|---|---|---|---|---|---|---|---|---|---|
| Chelsea vs All Oppo | |||||||||
| Pass Chain Length | Total Chain Passes | Max Chain Length | Average Chain Length | Percent of Teams Passes | Total Chain Distance | Max Chain Distance | Average Chain Distance | Percent of Teams Passing Distance | |
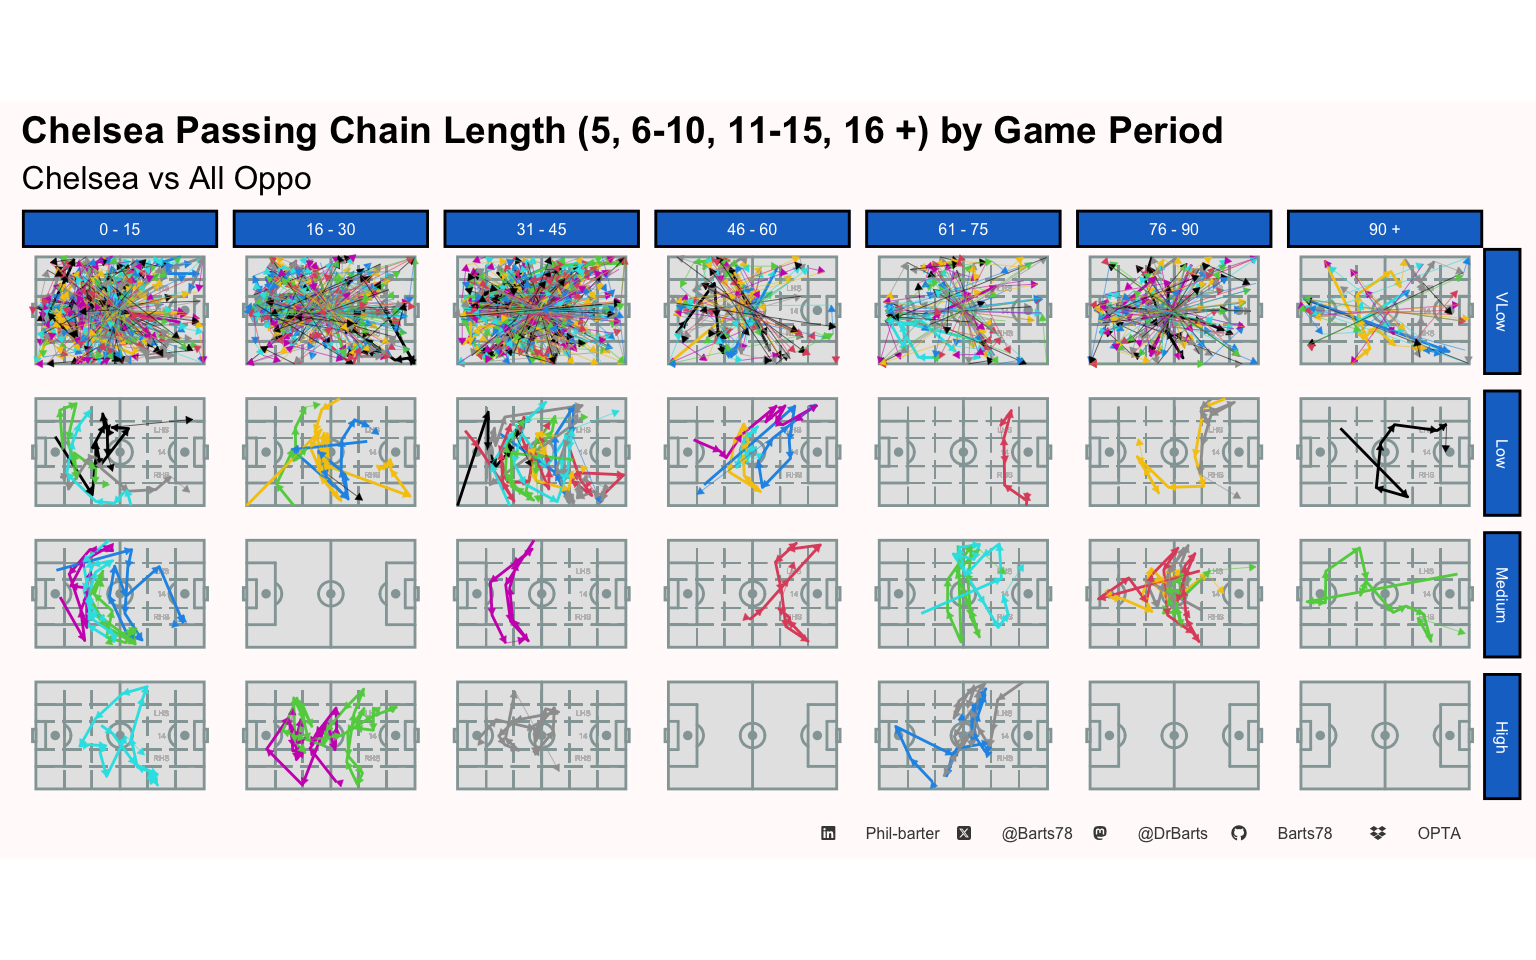
| VLow | 534 | 5 | 3 | 35% | 9,847.16 | 167.85 | 18.40 | 34% | |
| Low | 373 | 10 | 8 | 25% | 7,506.04 | 280.23 | 20.10 | 26% | |
| Medium | 280 | 15 | 13 | 18% | 5,600.06 | 371.26 | 20.00 | 19% | |
| High | 329 | 33 | 23 | 22% | 6,297.88 | 598.36 | 19.10 | 22% | |
| Overall Totals | — | 1,516 | 63 | 47 | — | 29,251 | 1,418 | 78 | — |
| Overall Average | — | 379 | 16 | 12 | — | 7,313 | 354 | 19 | — |
| . Phil-barter . . @Barts78 . . @DrBarts . . Barts78 . . OPTA . | |||||||||
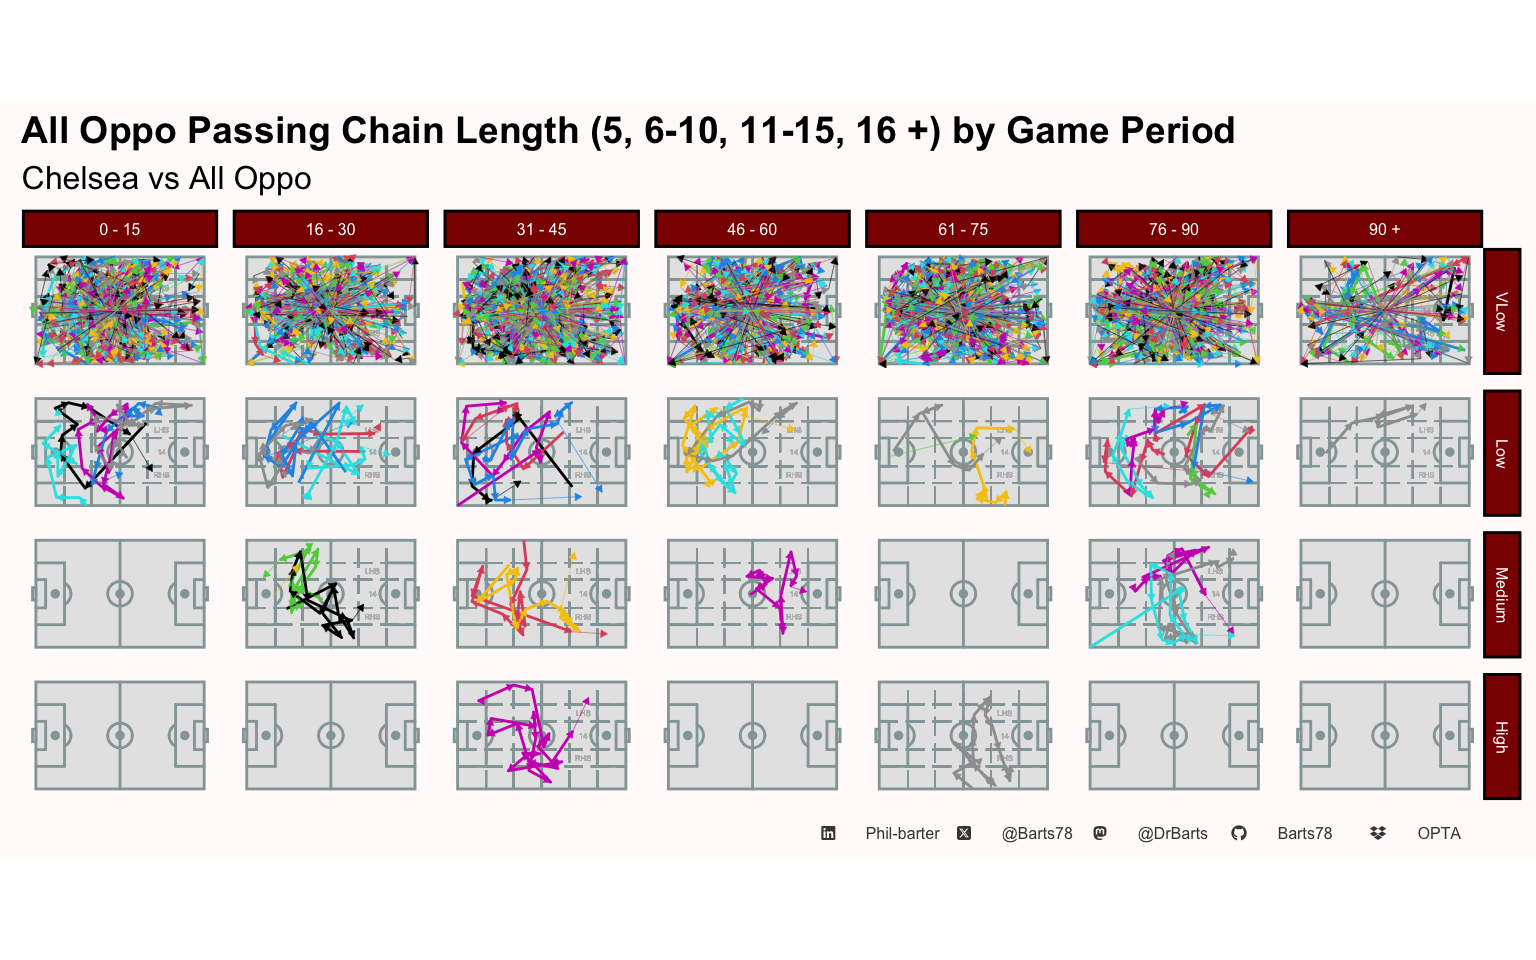
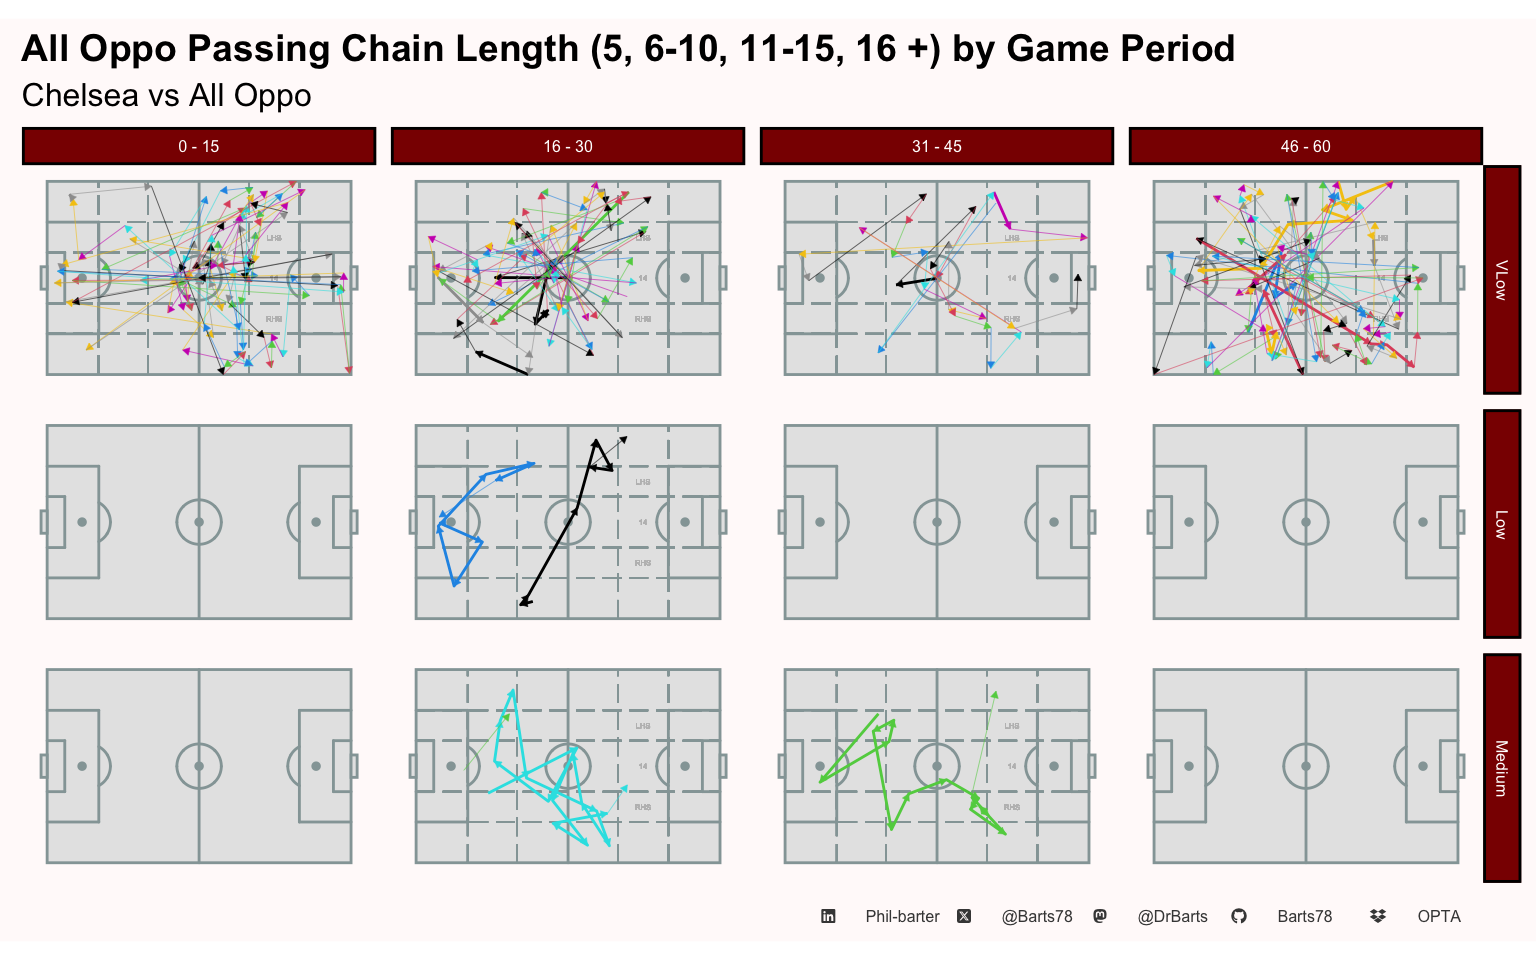
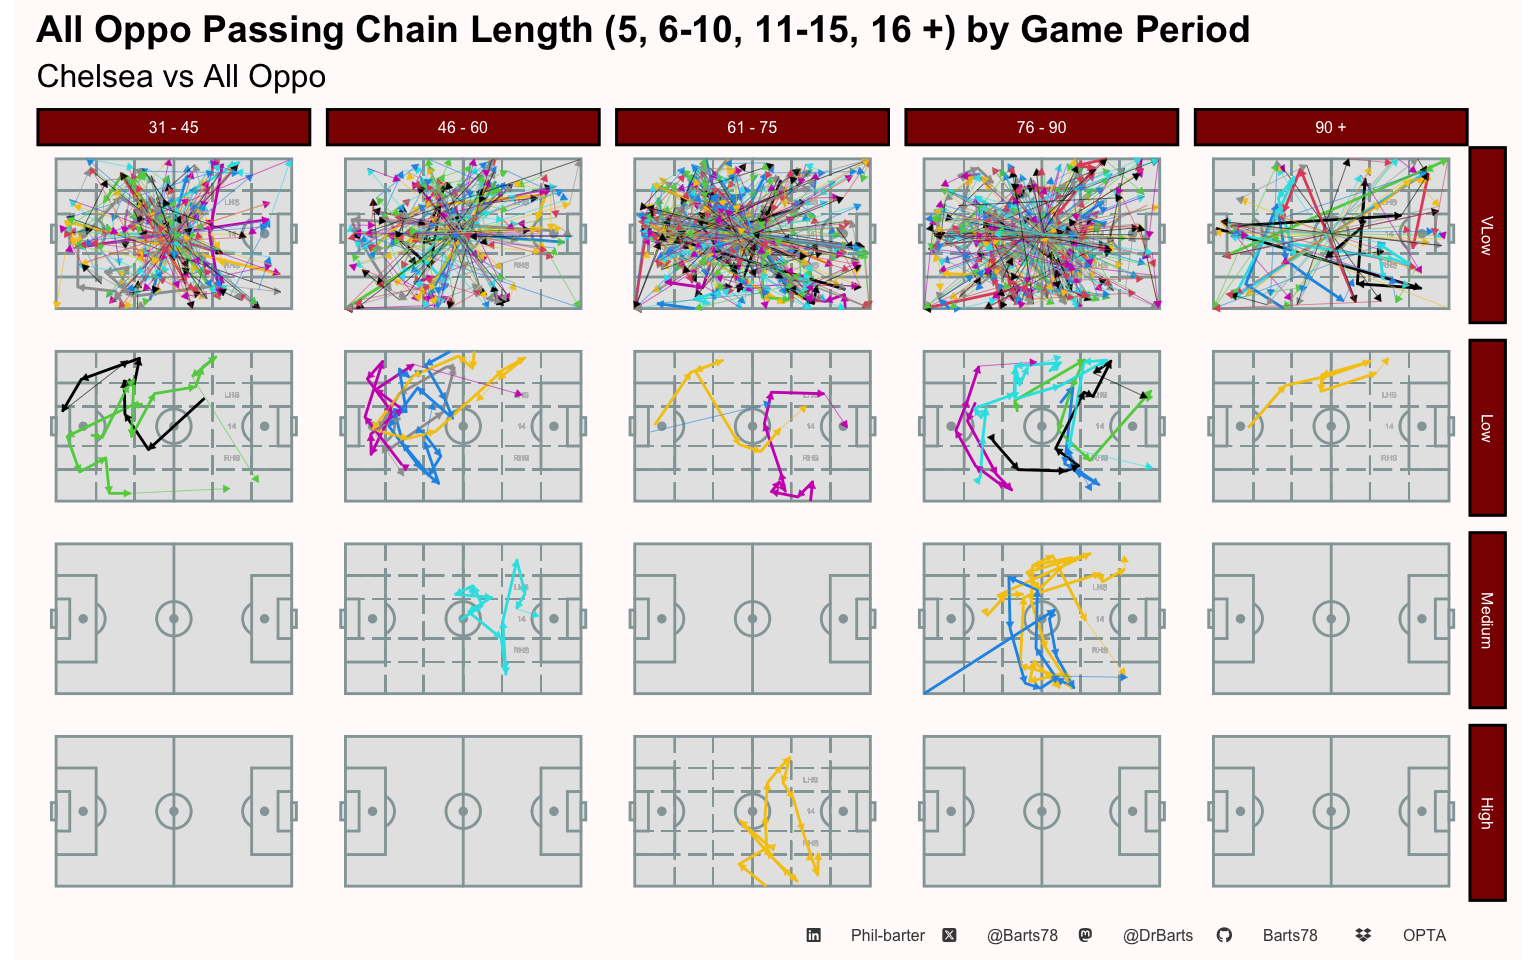
| All Oppo Full Season Passing Chain Length (5, 6-10, 11-15, 16 +) & Distance (m) | |||||||||
|---|---|---|---|---|---|---|---|---|---|
| Chelsea vs All Oppo | |||||||||
| Pass Chain Length | Total Chain Passes | Max Chain Length | Average Chain Length | Percent of Teams Passes | Total Chain Distance | Max Chain Distance | Average Chain Distance | Percent of Teams Passing Distance | |
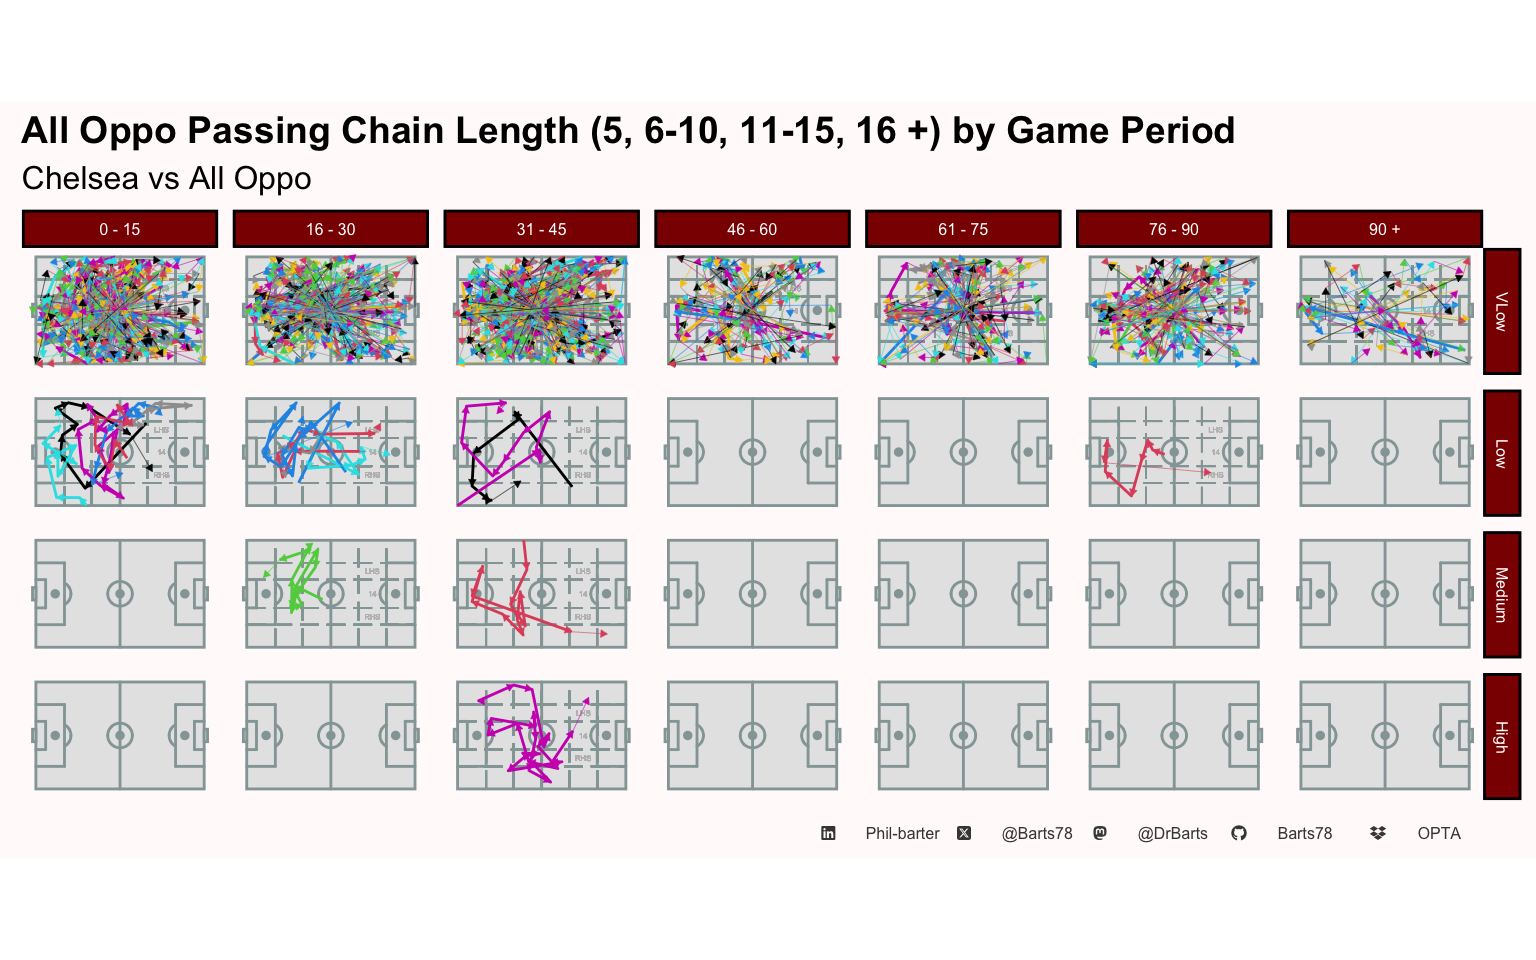
| VLow | 524 | 5 | 3 | 57% | 8,556.47 | 192.36 | 16.30 | 54% | |
| Low | 256 | 10 | 8 | 28% | 4,840.15 | 238.68 | 18.90 | 30% | |
| Medium | 103 | 14 | 13 | 11% | 1,873.86 | 325.02 | 18.20 | 12% | |
| High | 41 | 23 | 20 | 4% | 688.85 | 435.32 | 16.80 | 4% | |
| Overall Totals | — | 924 | 52 | 44 | — | 15,959 | 1,191 | 70 | — |
| Overall Average | — | 231 | 13 | 11 | — | 3,990 | 298 | 18 | — |
| . Phil-barter . . @Barts78 . . @DrBarts . . Barts78 . . OPTA . | |||||||||
Game State - Winning
Game State - Drawing
Game State - Garbage Time
| Chelsea Full season Passing Chain Length (5, 6-10, 11-15, 16 +) & Distance (m) | |||||||||
|---|---|---|---|---|---|---|---|---|---|
| Chelsea vs All Oppo | |||||||||
| Pass Chain Length | Total Chain Passes | Max Chain Length | Average Chain Length | Percent of Teams Passes | Total Chain Distance | Max Chain Distance | Average Chain Distance | Percent of Teams Passing Distance | |
| Away Garbage Time | |||||||||
| VLow | 100 | 5 | 3 | 19% | 1,805.42 | 148.17 | 18.10 | 18% | |
| Low | 99 | 10 | 8 | 27% | 1,989.08 | 246.39 | 20.10 | 26% | |
| Medium | 51 | 15 | 13 | 18% | 1,010.68 | 283.33 | 19.80 | 18% | |
| High | 96 | 33 | 25 | 29% | 1,744.66 | 557.05 | 18.20 | 28% | |
| Away Lead | |||||||||
| VLow | 14 | 5 | 3 | 3% | 202.30 | 85.94 | 14.40 | 2% | |
| Medium | 14 | 14 | 14 | 5% | 303.32 | 303.32 | 21.70 | 5% | |
| High | 22 | 22 | 22 | 7% | 356.86 | 356.86 | 16.20 | 6% | |
| Draw | |||||||||
| VLow | 306 | 5 | 3 | 57% | 5,928.04 | 167.85 | 19.40 | 60% | |
| Low | 228 | 10 | 8 | 61% | 4,609.17 | 280.23 | 20.20 | 61% | |
| Medium | 160 | 15 | 12 | 57% | 3,277.09 | 371.26 | 20.50 | 59% | |
| High | 121 | 28 | 21 | 37% | 2,356.26 | 598.36 | 19.50 | 37% | |
| Home Garbage Time | |||||||||
| VLow | 90 | 5 | 3 | 17% | 1,565.14 | 154.07 | 17.40 | 16% | |
| Low | 14 | 8 | 7 | 4% | 248.87 | 147.55 | 17.80 | 3% | |
| Medium | 55 | 15 | 14 | 20% | 1,008.97 | 329.50 | 18.30 | 18% | |
| High | 41 | 25 | 21 | 12% | 869.46 | 516.31 | 21.20 | 14% | |
| Home Lead | |||||||||
| VLow | 24 | 4 | 2 | 4% | 346.26 | 111.17 | 14.40 | 4% | |
| Low | 32 | 10 | 8 | 9% | 658.92 | 222.05 | 20.60 | 9% | |
| High | 49 | 25 | 24 | 15% | 970.64 | 519.48 | 19.80 | 15% | |
| Overall Totals | — | 1,516 | 254 | 211 | — | 29,251 | 5,399 | 338 | — |
| Overall Average | — | 84 | 14 | 12 | — | 1,625 | 300 | 19 | — |
| . Phil-barter . . @Barts78 . . @DrBarts . . Barts78 . . OPTA . | |||||||||
| All Oppo Full Season Passing Chain Length (5, 6-10, 11-15, 16 +) & Distance (m) | |||||||||
|---|---|---|---|---|---|---|---|---|---|
| Chelsea vs All Oppo | |||||||||
| Pass Chain Length | Total Chain Passes | Max Chain Length | Average Chain Length | Percent of Teams Passes | Total Chain Distance | Max Chain Distance | Average Chain Distance | Percent of Teams Passing Distance | |
| Away Garbage Time | |||||||||
| VLow | 125 | 5 | 3 | 24% | 1,739.87 | 150.38 | 13.90 | 20% | |
| Low | 92 | 10 | 8 | 36% | 1,574.87 | 238.68 | 17.10 | 33% | |
| Medium | 40 | 14 | 13 | 39% | 599.77 | 227.10 | 15.00 | 32% | |
| High | 18 | 17 | 17 | 44% | 253.53 | 264.63 | 14.10 | 37% | |
| Away Lead | |||||||||
| VLow | 11 | 3 | 2 | 2% | 175.23 | 60.83 | 15.90 | 2% | |
| Low | 13 | 7 | 7 | 5% | 262.52 | 142.78 | 20.20 | 5% | |
| Medium | 28 | 14 | 14 | 27% | 548.14 | 325.02 | 19.60 | 29% | |
| Draw | |||||||||
| VLow | 247 | 5 | 2 | 47% | 4,152.73 | 137.52 | 16.80 | 49% | |
| Low | 105 | 10 | 8 | 41% | 2,074.55 | 224.61 | 19.80 | 43% | |
| Medium | 24 | 12 | 12 | 23% | 531.84 | 292.54 | 22.20 | 28% | |
| High | 23 | 23 | 23 | 56% | 435.32 | 435.32 | 18.90 | 63% | |
| Home Garbage Time | |||||||||
| VLow | 111 | 5 | 3 | 21% | 2,020.06 | 192.36 | 18.20 | 24% | |
| Low | 46 | 9 | 8 | 18% | 928.21 | 179.85 | 20.20 | 19% | |
| Medium | 11 | 11 | 11 | 11% | 194.11 | 194.11 | 17.60 | 10% | |
| Home Lead | |||||||||
| VLow | 30 | 5 | 3 | 6% | 468.58 | 119.54 | 15.60 | 5% | |
| Overall Totals | — | 924 | 150 | 134 | — | 15,959 | 3,185 | 265 | — |
| Overall Average | — | 62 | 10 | 9 | — | 1,064 | 212 | 18 | — |
| . Phil-barter . . @Barts78 . . @DrBarts . . Barts78 . . OPTA . | |||||||||
Whole Season
| Chelsea Player Match Summary | ||||||||||||||||||||||
|---|---|---|---|---|---|---|---|---|---|---|---|---|---|---|---|---|---|---|---|---|---|---|
| Chelsea vs All Oppo | ||||||||||||||||||||||
| % of Team Possession | % of Team On Ball Time | Touches | Total Shots | Out Box Shots |
Shots
|
Passes
|
Duels
|
|||||||||||||||
| BCs | Goals | xG | xGOT | Attempted Passes | Successful Passes | Pass Success % | Assists | Key Passes | EPV | % of Team EPV | Aerials Total | Aerials Won | Aerial Success % | Duels Total | Duels Won | Duel Success | ||||||
| Midfielder | ||||||||||||||||||||||
| Andrey Santos | 1.5% | 3.6% | 34 | 2 | 0 | 1 | 0 | 0.31 | 0.63 | 22 | 20 | 90.9% | 0 | 2 | 0.12 | 1.4% | 0 | 0 | 0.0% | 4 | 2 | 50.0% |
| Cole Palmer | 2.2% | 5.2% | 49 | 4 | 2 | 0 | 0 | 0.16 | 0.00 | 33 | 26 | 78.8% | 0 | 1 | 0.16 | 1.9% | 0 | 0 | 0.0% | 6 | 2 | 33.3% |
| Enzo Fernández | 8.5% | 20.3% | 189 | 4 | 1 | 3 | 2 | 1.82 | 1.78 | 151 | 126 | 83.4% | 1 | 4 | 0.99 | 11.8% | 5 | 2 | 40.0% | 10 | 3 | 30.0% |
| Estêvão | 4.7% | 11.2% | 105 | 3 | 0 | 1 | 0 | 0.99 | 1.31 | 62 | 53 | 85.5% | 1 | 2 | 0.89 | 10.6% | 2 | 0 | 0.0% | 26 | 10 | 38.5% |
| Jamie Gittens | 1.9% | 4.5% | 43 | 3 | 2 | 0 | 0 | 0.10 | 0.00 | 20 | 20 | 100.0% | 0 | 2 | 0.19 | 2.3% | 2 | 1 | 50.0% | 10 | 3 | 30.0% |
| João Pedro | 4.3% | 10.3% | 96 | 6 | 2 | 2 | 2 | 0.53 | 1.01 | 52 | 45 | 86.5% | 1 | 3 | 0.48 | 5.7% | 12 | 8 | 66.7% | 17 | 8 | 47.1% |
| Moisés Caicedo | 11.0% | 26.2% | 245 | 3 | 1 | 1 | 1 | 0.34 | 0.89 | 196 | 179 | 91.3% | 0 | 0 | 0.54 | 6.4% | 4 | 1 | 25.0% | 22 | 9 | 40.9% |
| Pedro Neto | 6.9% | 16.5% | 153 | 3 | 1 | 1 | 1 | 0.41 | 0.66 | 90 | 74 | 82.2% | 0 | 5 | 1.68 | 20.0% | 3 | 1 | 33.3% | 14 | 8 | 57.1% |
| Average | — | 12.2 | 114.2 | 3.5 | 1.1 | 1.1 | 0.8 | 0.6 | 0.8 | 78.2 | 67.9 | 87.3 | 0.4 | 2.4 | 0.6 | 7.5 | 3.5 | 1.6 | 26.9 | 13.6 | 5.6 | 40.9 |
| Total | — | 98 | 914 | 28 | 9 | 9 | 6 | 5 | 6 | 626 | 543 | 699 | 3 | 19 | 5 | 60 | 28 | 13 | 215 | 109 | 45 | 327 |
| Defender | ||||||||||||||||||||||
| Jorrel Hato | 0.7% | 1.7% | 16 | 0 | 0 | 0 | 0 | 0.00 | 0.00 | 13 | 13 | 100.0% | 0 | 0 | 0.03 | 0.4% | 1 | 0 | 0.0% | 2 | 0 | 0.0% |
| Josh Acheampong | 4.9% | 11.7% | 108 | 1 | 0 | 0 | 0 | 0.09 | 0.00 | 93 | 87 | 93.5% | 0 | 0 | 0.12 | 1.5% | 7 | 5 | 71.4% | 8 | 6 | 75.0% |
| Malo Gusto | 6.3% | 15.0% | 141 | 1 | 1 | 0 | 0 | 0.02 | 0.00 | 98 | 91 | 92.9% | 0 | 1 | 0.38 | 4.5% | 3 | 1 | 33.3% | 9 | 4 | 44.4% |
| Marc Cucurella | 10.6% | 25.3% | 236 | 2 | 1 | 0 | 0 | 0.11 | 0.00 | 178 | 162 | 91.0% | 1 | 4 | 0.88 | 10.5% | 8 | 5 | 62.5% | 17 | 7 | 41.2% |
| Reece James | 6.2% | 14.8% | 137 | 1 | 1 | 0 | 0 | 0.04 | 0.04 | 103 | 95 | 92.2% | 0 | 4 | 0.68 | 8.1% | 2 | 2 | 100.0% | 6 | 3 | 50.0% |
| Tosin Adarabioyo | 9.2% | 21.9% | 205 | 0 | 0 | 0 | 0 | 0.00 | 0.00 | 177 | 164 | 92.7% | 0 | 0 | 0.33 | 3.9% | 16 | 11 | 68.8% | 8 | 2 | 25.0% |
| Trevoh Chalobah | 11.5% | 27.4% | 256 | 5 | 1 | 2 | 1 | 0.67 | 1.41 | 207 | 186 | 89.9% | 0 | 0 | 0.54 | 6.5% | 12 | 7 | 58.3% | 16 | 12 | 75.0% |
| Wesley Fofana | 0.7% | 1.7% | 15 | 0 | 0 | 0 | 0 | 0.00 | 0.00 | 11 | 11 | 100.0% | 0 | 0 | 0.02 | 0.3% | 2 | 0 | 0.0% | 4 | 2 | 50.0% |
| Average | — | 14.9 | 139.2 | 1.2 | 0.5 | 0.2 | 0.1 | 0.1 | 0.2 | 110.0 | 101.1 | 94.0 | 0.1 | 1.1 | 0.4 | 4.5 | 6.4 | 3.9 | 49.3 | 8.8 | 4.5 | 45.1 |
| Total | — | 120 | 1,114 | 10 | 4 | 2 | 1 | 1 | 1 | 880 | 809 | 752 | 1 | 9 | 3 | 36 | 51 | 31 | 394 | 70 | 36 | 361 |
| Forward | ||||||||||||||||||||||
| João Pedro | 1.0% | 2.4% | 23 | 2 | 0 | 0 | 0 | 0.28 | 0.00 | 13 | 11 | 84.6% | 0 | 0 | 0.08 | 1.0% | 5 | 2 | 40.0% | 3 | 1 | 33.3% |
| Liam Delap | 1.3% | 3.1% | 29 | 3 | 0 | 0 | 0 | 0.23 | 0.28 | 14 | 9 | 64.3% | 0 | 0 | 0.06 | 0.8% | 6 | 2 | 33.3% | 2 | 1 | 50.0% |
| Tyrique George | 0.8% | 1.9% | 17 | 1 | 0 | 1 | 0 | 0.60 | 0.97 | 6 | 6 | 100.0% | 0 | 0 | 0.03 | 0.3% | 0 | 0 | 0.0% | 3 | 2 | 66.7% |
| Average | — | 2.5 | 23.0 | 2.0 | 0.0 | 0.3 | 0.0 | 0.4 | 0.4 | 11.0 | 8.7 | 83.0 | 0.0 | 0.0 | 0.1 | 0.7 | 3.7 | 1.3 | 24.4 | 2.7 | 1.3 | 50.0 |
| Total | — | 7 | 69 | 6 | 0 | 1 | 0 | 1 | 1 | 33 | 26 | 249 | 0 | 0 | 0 | 2 | 11 | 4 | 73 | 8 | 4 | 150 |
| Keeper | ||||||||||||||||||||||
| Robert Sánchez | 5.7% | 13.6% | 126 | 0 | 0 | 0 | 0 | 0.00 | 0.00 | 100 | 66 | 66.0% | 0 | 0 | 0.19 | 2.3% | 2 | 1 | 50.0% | 0 | 0 | 0.0% |
| Average | — | 13.6 | 126.0 | 0.0 | 0.0 | 0.0 | 0.0 | 0.0 | 0.0 | 100.0 | 66.0 | 66.0 | 0.0 | 0.0 | 0.2 | 2.3 | 2.0 | 1.0 | 50.0 | 0.0 | 0.0 | 0.0 |
| Total | — | 14 | 126 | 0 | 0 | 0 | 0 | 0 | 0 | 100 | 66 | 66 | 0 | 0 | 0 | 2 | 2 | 1 | 50 | 0 | 0 | 0 |
| . Phil-barter . . @Barts78 . . @DrBarts . . Barts78 . . OPTA . | ||||||||||||||||||||||
| Chelsea Open Play Passing connections | |||||||
|---|---|---|---|---|---|---|---|
| Chelsea vs All Oppo Min 50 passes | |||||||
| Attempted Passes | Successful Passes | Pass Success % | Key Passes | Prog Passes | EPV | EPV_P_Pass | |
| Tosin Adarabioyo | |||||||
| Marc Cucurella | 53 | 53 | 100 | 0 | 0 | 0.032 | 0.001 |
| . Phil-barter . . @Barts78 . . @DrBarts . . Barts78 . . OPTA . | |||||||
Game State - Winning
| Chelsea Open Play Passing connections | ||||||
|---|---|---|---|---|---|---|
| Chelsea vs All Oppo Min 50 passes | ||||||
| Attempted Passes | Successful Passes | Pass Success % | Key Passes | Prog Passes | EPV | EPV_P_Pass |
| . Phil-barter . . @Barts78 . . @DrBarts . . Barts78 . . OPTA . | ||||||
Game State - Drawing
| Chelsea Open Play Passing connections | ||||||
|---|---|---|---|---|---|---|
| Chelsea vs All Oppo Min 50 passes | ||||||
| Attempted Passes | Successful Passes | Pass Success % | Key Passes | Prog Passes | EPV | EPV_P_Pass |
| . Phil-barter . . @Barts78 . . @DrBarts . . Barts78 . . OPTA . | ||||||
Game State - Garbage Time
| Chelsea Open Play Passing connections | ||||||
|---|---|---|---|---|---|---|
| Chelsea vs All Oppo Min 50 passes | ||||||
| Attempted Passes | Successful Passes | Pass Success % | Key Passes | Prog Passes | EPV | EPV_P_Pass |
| . Phil-barter . . @Barts78 . . @DrBarts . . Barts78 . . OPTA . | ||||||
Whole Season
| Chelsea Open Play Defensive Actions EPV Performance | |||||
|---|---|---|---|---|---|
| Chelsea vs All Oppo | |||||
| Player | Epv Faced | Percent Attacking Team Epv | Epv Won | Epv Lost | |
| Defender | |||||
| Jorrel Hato | 0.003 | 1.00% | 67% | 0% | |
| Josh Acheampong | 0.030 | 11.50% | 77% | 0% | |
| Malo Gusto | 0.081 | 40.30% | 99% | 1% | |
| Marc Cucurella | 0.043 | 13.00% | 60% | 0% | |
| Reece James | 0.000 | 0.00% | 0% | 0% | |
| Tosin Adarabioyo | 0.178 | 72.70% | 81% | 1% | |
| Trevoh Chalobah | 0.071 | 21.50% | 61% | 0% | |
| Wesley Fofana | 0.001 | 0.50% | 100% | 0% | |
| Midfielder | |||||
| Andrey Santos | 0.002 | 1.00% | 100% | 0% | |
| Enzo Fernández | 0.010 | 4.00% | 80% | 0% | |
| Estêvão | 0.058 | 28.40% | 38% | 60% | |
| Jamie Gittens | 0.001 | 0.00% | 0% | 0% | |
| João Pedro | 0.037 | 16.00% | 86% | 0% | |
| Moisés Caicedo | 0.033 | 13.00% | 79% | 0% | |
| Pedro Neto | 0.009 | 3.50% | 78% | 0% | |
| Forward | |||||
| João Pedro | 0.000 | 0.00% | 0% | 0% | |
| Liam Delap | 0.005 | 2.00% | 80% | 0% | |
| Tyrique George | 0.002 | 1.00% | 100% | 0% | |
| Overall Totals | — | 0.564 | — | — | — |
| Overall Average | — | 0.031 | — | — | — |
| . Phil-barter . . @Barts78 . . @DrBarts . . Barts78 . . OPTA . | |||||
Game State - Winning
| Chelsea Open Play Defensive Actions EPV Performance | |||||
|---|---|---|---|---|---|
| Chelsea vs All Oppo | |||||
| Player | Epv Faced | Percent Attacking Team Epv | Epv Won | Epv Lost | |
| Defender | |||||
| Malo Gusto | 0.004 | 25.00% | 100% | 0% | |
| Marc Cucurella | 0.004 | 18.80% | 75% | 0% | |
| Tosin Adarabioyo | 0.017 | 12.50% | 12% | 0% | |
| Trevoh Chalobah | 0.013 | 6.20% | 8% | 0% | |
| Midfielder | |||||
| Estêvão | 0.035 | 218.80% | 0% | 100% | |
| Overall Totals | — | 0.073 | — | — | — |
| Overall Average | — | 0.015 | — | — | — |
| . Phil-barter . . @Barts78 . . @DrBarts . . Barts78 . . OPTA . | |||||
Game State - Drawing
| Chelsea Open Play Defensive Actions EPV Performance | |||||
|---|---|---|---|---|---|
| Chelsea vs All Oppo | |||||
| Player | Epv Faced | Percent Attacking Team Epv | Epv Won | Epv Lost | |
| Defender | |||||
| Josh Acheampong | 0.030 | 15.40% | 77% | 0% | |
| Malo Gusto | 0.002 | 1.30% | 100% | 0% | |
| Marc Cucurella | 0.017 | 7.40% | 65% | 0% | |
| Reece James | 0.000 | 0.00% | 0% | 0% | |
| Tosin Adarabioyo | 0.021 | 8.10% | 57% | 0% | |
| Trevoh Chalobah | 0.033 | 12.80% | 58% | 0% | |
| Midfielder | |||||
| Andrey Santos | 0.002 | 1.30% | 100% | 0% | |
| Enzo Fernández | 0.004 | 2.70% | 100% | 0% | |
| Estêvão | 0.004 | 2.00% | 75% | 0% | |
| Jamie Gittens | 0.001 | 0.00% | 0% | 0% | |
| João Pedro | 0.010 | 5.90% | 90% | 0% | |
| Moisés Caicedo | 0.010 | 4.00% | 60% | 0% | |
| Pedro Neto | 0.002 | 1.30% | 100% | 0% | |
| Forward | |||||
| João Pedro | 0.000 | 0.00% | 0% | 0% | |
| Liam Delap | 0.003 | 1.30% | 67% | 0% | |
| Tyrique George | 0.002 | 1.30% | 100% | 0% | |
| Overall Totals | — | 0.141 | — | — | — |
| Overall Average | — | 0.009 | — | — | — |
| . Phil-barter . . @Barts78 . . @DrBarts . . Barts78 . . OPTA . | |||||
Game State - Garbage Time
| Chelsea Open Play Defensive Actions EPV Performance | |||||
|---|---|---|---|---|---|
| Chelsea vs All Oppo | |||||
| Player | Epv Faced | Percent Attacking Team Epv | Epv Won | Epv Lost | |
| Defender | |||||
| Jorrel Hato | 0.003 | 5.60% | 67% | 0% | |
| Malo Gusto | 0.075 | 208.30% | 99% | 1% | |
| Marc Cucurella | 0.022 | 33.40% | 55% | 0% | |
| Reece James | 0.000 | 0.00% | 0% | 0% | |
| Tosin Adarabioyo | 0.140 | 366.80% | 94% | 1% | |
| Trevoh Chalobah | 0.025 | 64.00% | 92% | 0% | |
| Wesley Fofana | 0.001 | 2.80% | 100% | 0% | |
| Midfielder | |||||
| Enzo Fernández | 0.006 | 11.10% | 67% | 0% | |
| Estêvão | 0.019 | 52.80% | 100% | 0% | |
| João Pedro | 0.027 | 64.00% | 85% | 0% | |
| Moisés Caicedo | 0.023 | 55.60% | 87% | 0% | |
| Pedro Neto | 0.007 | 13.90% | 71% | 0% | |
| Forward | |||||
| Liam Delap | 0.002 | 5.60% | 100% | 0% | |
| Overall Totals | — | 0.350 | — | — | — |
| Overall Average | — | 0.027 | — | — | — |
| . Phil-barter . . @Barts78 . . @DrBarts . . Barts78 . . OPTA . | |||||
Whole Season
Game State - Winning
Game State - Drawing
Game State - Garbage Time
Whole Season
Game State - Winning
Game State - Draw
Game State - Garbage Time
Whole Season
Game State - Winning
Game State - Drawing
Game State - Garbage Time